Abstract
Background: The aim of this study was to assess the association of triglyceride–glucose (TyG) index with glycated haemoglobin (HbA1c) and insulin resistance in type 2 diabetes mellitus (T2DM).
Methods:A total of 140 patients with T2DM were included in this cross-sectional study and divided into two groups according to their HbA1c levels: participants with HbA1c <7.0% (n=75) and those with HbA1c >7.0% (n=65) were defined as having a good glycemic control (group I) and a poor glycaemic control (group II) in T2DM. Anthropometric and biochemical parameters were measured, while the values of triglyceride (TG) to high density lipoprotein cholesterol (HDL-C) (TG/HDL-C) ratio and TyG index were calculated using formula.
Results: Body mass index (BMI), fasting blood glucose (FBS), HbA1c and homeostatic model assessment for insulin resistance (HOMA-IR) were significantly higher in diabetic patients with poor glycemic control. TyG index was significantly correlated with HbA1c, HOMA-IR, TyG-BMI and TyG-WC. The receiver operating characteristic (ROC) analysis showed that TyG had a maximum area under the curve of 0.806, with a cut off value of 15.5 for identifying glycemic control in diabetic patients.
Conclusion:TyG index is a useful tool for assessing glycemic control in T2DM patients and positively correlated with HbA1c and HOMA-IR. Hence, TyG can be used as a simple and inexpensive alternative to assess glycemic control in patients with diabetes.
Keywords:type 2 diabetic subjects, glycemic control, insulin resistance, TyG index and TG/HDL-C ratio.
INTRODUCTION
Diabetes mellitus has become a global health menace and has been alarmingly increasing, with T2DM being the most common form which accounts for about 90% of all cases of diabetes due to a decreased sensitivity of target tissues to insulin (1). As per the International Diabetes Federation, in 2019 the global prevalence of diabetes was 9.3%, and it was estimated that almost 463 million people were suffering from diabetes (2). In India, more than 62 million individuals were found to have diabetes. Patients with T2DM have two to four times and 1.5 to 3.6 fold increases in risks of cardiovascular disease and mortality, respectively (3). Persistent hyperglycaemia and insulin resistance are associated with long term damage to organs, especially eyes, kidney, nerves and the heart (4).
Patients with T2DM often display an atherogenic dyslipidemia and obesity, which greatly increases their risk for coronary artery disease. Studies have shown that elevated triacylglycerol, low density lipoprotein cholesterol (LDL-C) and TG/HDL, a marker of small dense LDL particle, augmented the development of cardiovascular disease in diabetes (5). The higher prevalence of lipid abnormalities in diabetes mellitus has been attributed to insulin resistance and its associated complications (6). Effective glycemic control and enhancing insulin sensitivity are essential in order to reduce the risk of developing diabetes complications. Glycated haemoglobin and HOMA-IR are commonly employed to assess long term blood glucose concentration and insulin resistance, respectively (7, 8), also being found to predict microvascular and macrovascular complications of T2DM (9). Although they are used to assess glycemic control and insulin sensitivity, they are expensive, time consuming, and not readily available in many laboratories. Thus, a simple and inexpensive marker, which identifies both glycemic control and insulin resistance, is essential. Therefore, a large number of surrogate indicators are being investigated to assess glycemic control in diabetic patients for effective management. Recently, various indexes such as TyG index, TG/HDL ratio, BMI, waist circumference (WC) and visceral adiposity index (VAI) showed promising results as surrogate markers for the assessment of insulin resistance (10, 11). Visceral adiposity index is an indicator of visceral adipose function and insulin sensitivity, which is calculated by BMI, WC, TG and HDL (10), being also strongly associated with cardiometabolic risk in healthy subjects. Mounting evidence indicate that TyG index, which is derived from triglycerides (TGs), and fasting glucose levels correlate with the HOMA-IR and hyperinsulinemic- euglycemic clamp test (12). The TyG index is used to assess the progression of coronary artery calcification (CAC) in adults (13) and it also predicts cardiovascular mortality among patients on peritoneal dialysis (14). Since an increased TG level is an important risk factor for cardiovascular disease (15) and metabolic syndrome, measuring the product of TG and glucose as TyG index represents the glycemic control and cardiovascular status of an individual simultaneously. Hence, the present study was designed to investigate the association of TyG index with HbA1c and insulin resistance in T2DM.
MATERIALS AND METHODS
The present study was conducted in the Departments of Biochemistry, in collaboration with the Department of General Medicine at Mahatma Gandhi Medical College and Research Institute (MGMCRI), Puducherry, India. It was initiated after obtaining permission from the Institute Human Ethics Committee (IHEC) and informed consent from study subjects.
This cross-sectional study included 140 patients with T2DM from a tertiary healthcare unit in MGMCRI, Puducherry, India. Subjects were divided into two groups, according to their HbA1c levels. Thus, HbA1c <7.0% (n=75) and HbA1c >7.0% (n=65) were defined as good control (group I) and poor glycemic control (group II), respectively. Diabetes mellitus was defined as per the American Diabetes Association (ADA) criteria (16). The National Cholesterol Education Programme (NCEP) Adult Treatment Panel III (ATP III) guidelines were used for the reference level of serum lipid profile (17). Patients with type 1 diabetes mellitus, pregnancy, previous history of hyperthyroidism, hypothyroidism, autoimmune disorders, cardiovascular diseases, liver and muscle diseases were excluded from this study. Demographic data, anthropometrics clinical details, family history of diabetes and duration of diabetes were recorded.
Anthropometric measurements
The BMI was calculated by dividing an individual’s weight in kilograms by the square of height in meters. The WC was measured to the nearest 0.1 cm midpoint between the iliac crest and costal margin at the end of expiration. TyG and TG/HDL indices were calculated according to previous study or formula (11, 12), and VAI for male and female subjects were calculated using the following formula (18):
VAI (women) = [WC/(36.58+1.89 x BMI)] x (TG/0.81) x (1.52/HDL)
VAI (men) = [WC/(39.68+1.88 x BMI)] x (TG/1.03) x (1.31/HDL)
(where TG and HDL-C concentrations are in mmol/L and WC in cm).
TyG index = ln [fasting TG (mg/dL) x fasting glucose (mg/dL)/2]
TyG-WC = TyG index x WC
TyG-BMI = TyG index x BMI
TG/HDL = TG (mg/dL)/HDL (mg/dL)
Estimation of biochemical parameters
Venous blood sample was collected following an overnight fasting. Fasting plasma glucose, HbA1c, plasma insulin, HOMA-IR and lipid profile were measured in blood samples. Fasting blood glucose and lipid profile were analysed by clinical chemistry analyser. Fasting plasma glucose was determined by the glucose oxidase and peroxidase method. HbA1c was estimated by an HPLC method using reagent kits from Biorad. Total cholesterol, triacylglycerol (TAG) and high density lipoprotein (HDL) were assessed by glycerol kinase, enzymatic method and polyanion precipitation respectively. Friedwald equation (19) was used to calculate low density lipoprotein cholesterol (LDL-C): LDL cholesterol = total cholesterol – (HDL-cholesterol + VLDL). Very low density lipoprotein cholesterol (VLDL-C) was calculated using the following formula: VLDL = TAG/5. Atherogenic index of plasma (AIP) was calculated using the formula: Log10[TG (mmol/L)/HDL (mmol/L)], fasting plasma insulin was determined by direct chemiluminescent technology, and HOMA-IR was calculated using the fasting glucose level (mmol/L) multiplied by fasting insulin level (lU/mL) and then divided by 22.5 (7).
Statistical analysis
Results are expressed as mean±SD. Categorical data were presented as number and percentage. Difference in means between the groups was evaluated by independent t test. Spearman correlation analysis was done to assess the correlation between TyG index, HbA1c and HOMA-IR. Receiver operating characteristic (ROC) curve analyses were done to find the cut off value of all indexes with maximum sensitivity and specificity to assess the glycemic control. A p-value of less than 0.05 (two-sided) was considered statistically significant.
RESULTS
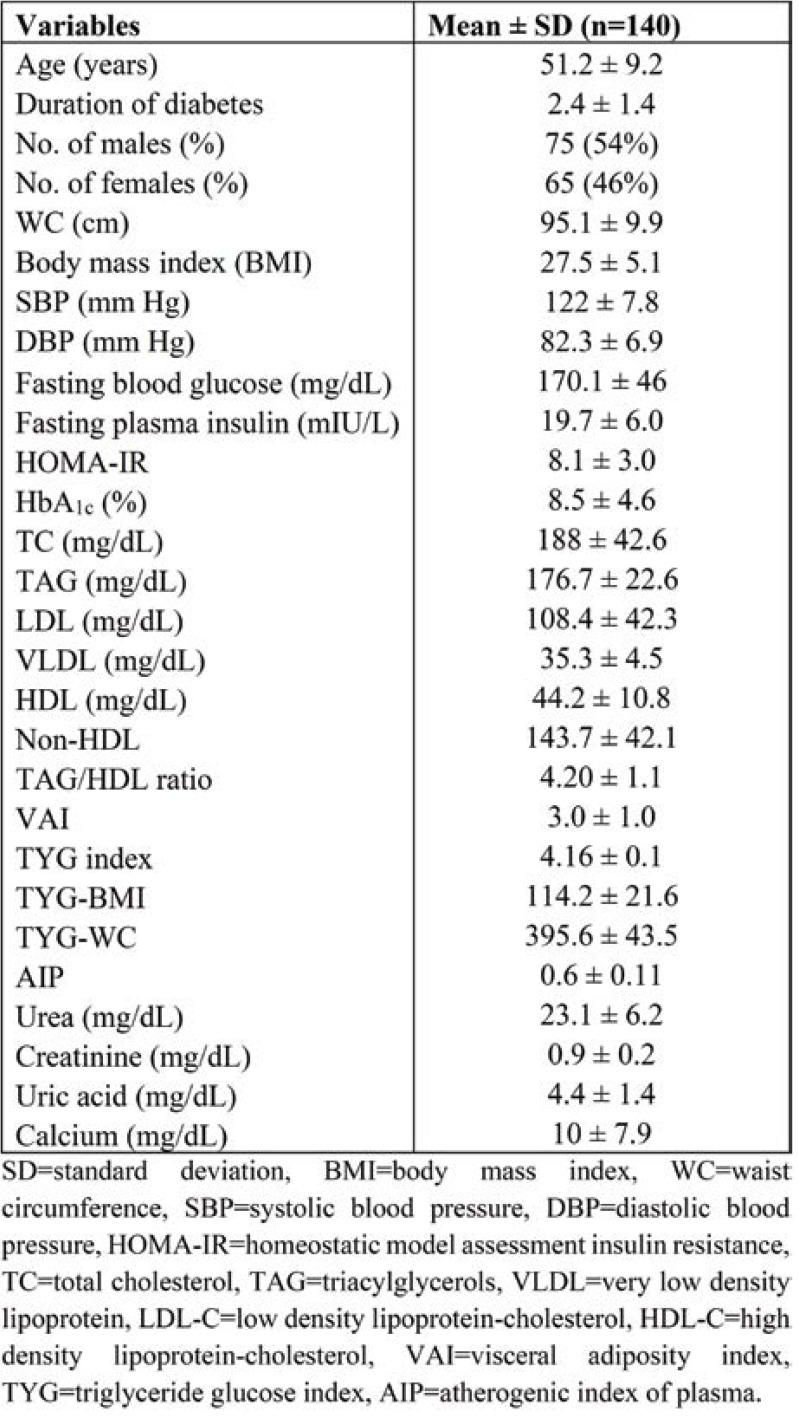
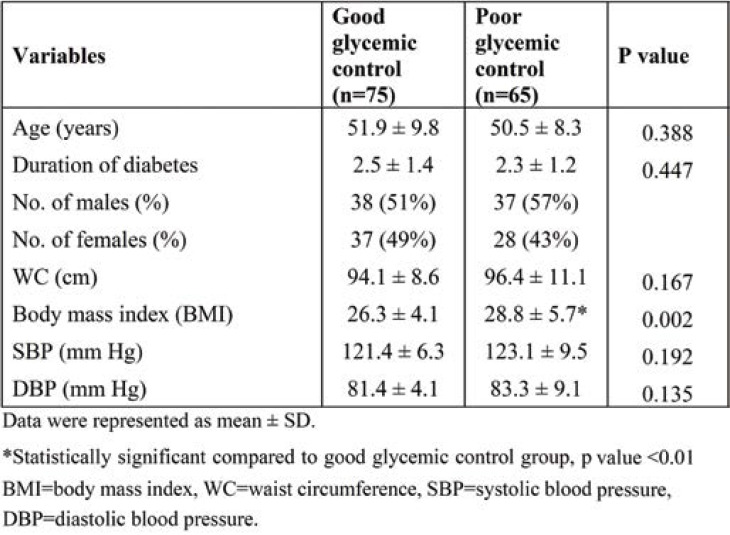
Table 1 depicts the baseline, clinical and anthropometric characteristics of subjects with good and poor glycemic control. The duration of diabetes was less than 2.5 years in both groups. The number of males and females was 38 (51%) and 37 (49%), respectively, in group I, and 37 (57%) and 28 (43%), respectively, in group II. The BMI was significantly higher in group II (P <0.05). There was no significant difference in systolic blood pressure (SBP) and diastolic blood pressure (DBP) between the two groups (Table 2).
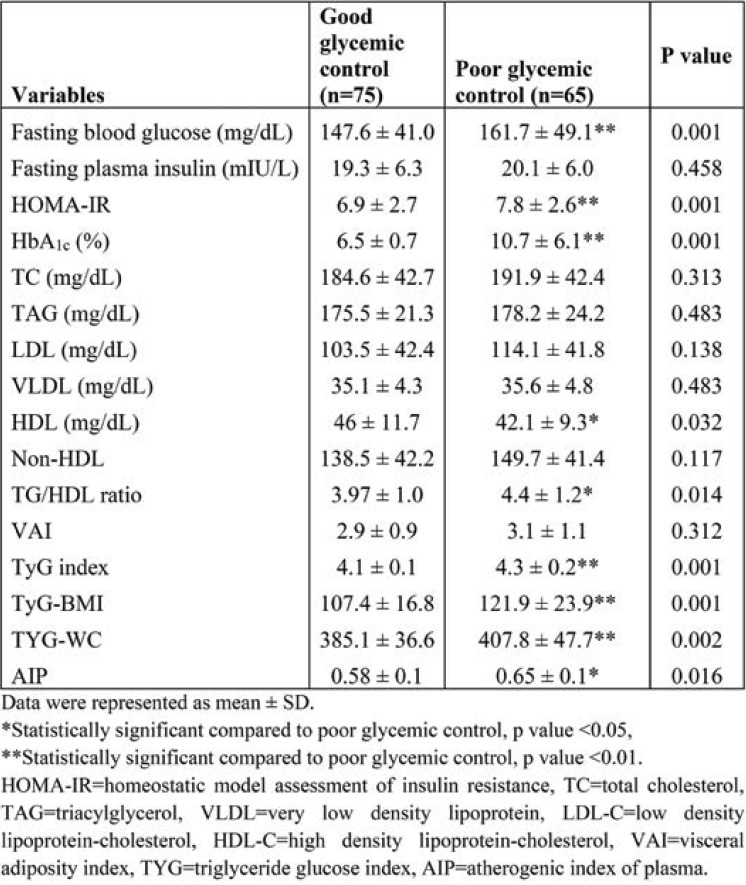
Table 3 shows the comparison between biochemical parameters and metabolic indexes of diabetic patients with good and poor glycemic control. Fasting blood glucose (167.7±49.1, p <0.001), HOMA-IR (7.8±2.6, p <0.001), HbA1c (10.7±6.1, p <0.001) and TG/HDL (4.4±1.2, p <0.05) ratio were significantly higher in group II. High density lipoprotein cholesterol (42.1±9.3) was significantly lower in group II. TyG indices such as TyG index (4.3±1.2, p <0.001), TyG-BMI (121.9±23.9, p <0.001) and TYG-WC (407.8±47.7, p <0.001 were significantly higher in T2DM subjects with poor glycemic control.
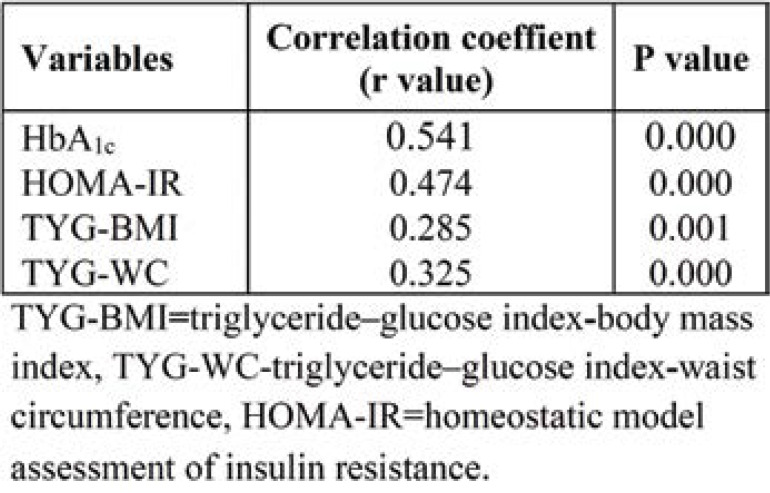
In Table 4, the TyG index positively correlated with HbA1c (r=0.541, p <0.000) and HOMA-IR (r=0.464, p <0.000), TyG-BMI (r=0.285, p <0.001) and TyG-WC (r=0.325, p <0.000).
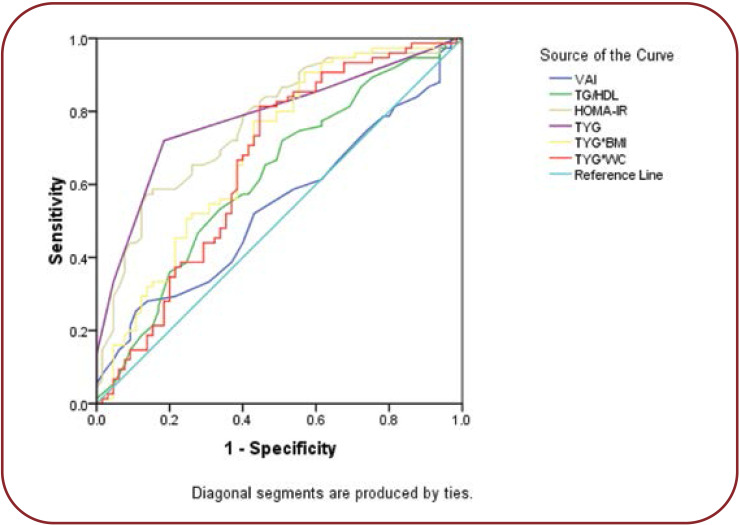
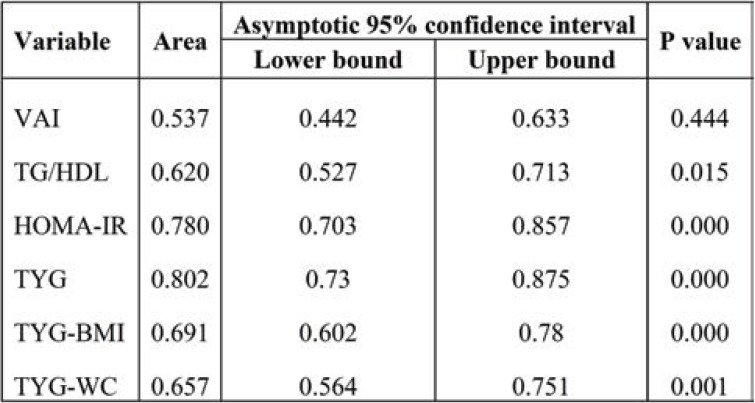
Receiver operating characteristic curve was plotted based on the sensitivity and specificity for HOMA-IR and TyG indexes were shown in Figure 1. The ROC analysis showed that TyG (AUC 0.806, cut off value 15.5) was the best marker for identifying glycemic control when compared with the other indexes. Areas under the curve for TG/HDL (0.620), HOMA-IR (0.780), TyG-BMI (0.691) and TyG-WC (0.657) are shown in Table 5.
DISCUSSION
Type 2 diabetes mellitus is a major global health problem and maintaining good glycemic control in T2DM remains a challenge. Dyslipidemia and insulin resistance plays a major role in development of micro- and macrovascular complications. We sought to attain a modest, sensitive and economically feasible biochemical predictors of glycemic control in diabetic patients. In the present study, we assessed the association between HbA1c and metabolic indices in T2DM.
The diabetes complications and control trial (DCCT) represent HbA1c as the good marker for glycemic control (20). Maintaining HbA1c <7.0% reduces the risk of developing microvascular and macrovascular complications. Hence, diabetic patients were divided into two groups based on their HbA1c levels. In our study, we found dyslipidemic changes in subjects with poor glycemic control as illustrated by elevated TG/HDL ratio and reduced levels of HDL-C. In association with this, we also observed increased values of BMI, fasting blood glucose (FBG) and HOMA-IR in subjects with HbA1c >7% (group II). Hyperglycaemia and decreased insulin sensitivity in T2DM are accompanied by low HDL-C and hypertriglyceridemia. Increased plasma cholesteryl ester transfer protein (CETP) is frequently seen in diabetes due to increased VLDL-C, which facilitates the transfer of cholesterol ester and TAG between lipoproteins (HDL and LDL particles) (21, 22). This led to increased small dense LDL, which is considered to be one of the hallmarks of diabetic dyslipidemia and also associated with cardiovascular risk. Moreover, estimation of small dense LDL particle is cumbersome and not feasible, thus the measurement of TG/HDL ratio indirectly reflects the size of LDL that could be comparable with the actual assessment of small dense LDL. ROC analysis of TG/HDL ratio yielded an AUC of 0.620 with a cut off value of 4.4 and a sensitivity of 73% to assess the magnitude of glycemic control in diabetic patients. Babic et al showed that TG/HDL-C ratio was found to be a useful marker in the prediction of glycemic control in T2DM (11). The TG/HDL-C ratio and BMI were independently associated with HbA1c after adjusting for age and gender (23). The average cut off value of TG/HDL-C ratio was 3.40 mg/dL and 5.82 mg/dL in good and poor glycemic control groups, respectively, suggesting the presence of insulin resistance in T2DM (23). Other authors have also stated the TG/HDL-C ratio with a cut off value of 3.0 mg/dL was a better marker for detecting insulin resistance (24).
The VAI is gender specific as well as a surrogate marker of visceral adiposity. Excess visceral adiposity has been linked to a greater risk of T2DM and cardiometabolic risk. Obesity and increased visceral fat accumulation induces metabolic derangement like increased free fatty acid and pro-inflammatory cytokines ultimately culminate in insulin resistance and poor glycemic control (25). In association with this, we found a significant positive correlation between VAI and HbA1c. In accordance with this, Hameed et al showed that increased VAI adversely affects glycemic control in women with T2DM. Also, VAI was significantly associated with adipocytokines and cardio-metabolic risk serum markers (26). A five-year prospective study conducted in Chinese T2DM adults demonstrated that Chinese VAI is a better predictor of T2DM and prediabetes than BMI, WC and waist-to-hip ratio (27). Marco et al reported that VAI was significantly associated with cardiometabolic risk in Caucasian Sicilian subjects (28).
In the current study, TyG index, TyG-BMI and TyG-WC were significantly elevated in group II, while TyG index, TyG-BMI and TyG-WC were significantly correlated with HbA1c and HOMA-IR. Therefore, we performed ROC analysis for TyG indices, which showed a maximum AUC of 0.806 for TyG index, followed by TyG-BMI and TyG-WC. Among these indexes, TyG index was found to be a good predictor of glycemic control when compared to others. Similarly, Hameed et al illustrated that TyG index had the largest AUC of 0.836 in ROC analysis, followed by TyGWC and TyG-BMI and correlated with HbA1c and HOMA-IR (12). Also, TyG index is useful in assessing the magnitude of insulin resistance in T2DM (11). Lee et al concluded that TyG index could be used as diagnostic criteria for identification of metabolically obese but normal weight individuals (29). Elevated triacylglycerol in patients with diabetes causes poor glycemic control by affecting glucose metabolism (30). Studies have shown that TyG index not only reflected the glycemic control but it was also good predictor of insulin resistance. Fernando et al reported that TyG index was significantly correlated with HOMA-IR and euglycemic-hyperinsulinemic clamp test for identifying insulin resistance (31). In agreement with previous studies, our study found that TyG index was an effective screening tool in predicting the glycemic control and insulin resistance in T2DM.
Measurement of HbA1c and insulin is expensive, requires automated procedures, and may not be feasible in primary health care settings. TyG index derived from fasting blood glucose and triglyceride levels is routinely measured in small laboratories and readily available. The diagnostic accuracy of TyG index in identifying glycemic control and insulin resistance in diabetic patients has been documented in few studies. Hence, TyG index could be used as a simple cost-effective surrogate marker of glycemic control and insulin resistance in T2DM.
Study limitations
In our study we used a small sample size. A large scale multicentric cohort study can be done in the future to confirm the reported findings in various ethnic population and external validity.
CONCLUSION
The TyG index can be used as a simple surrogate marker of glycemic control and insulin resistance in patients with T2DM. Owing to its cost effectiveness and easy quantifiability, it can be measured in small laboratories.
Conflict of interests: none declared
Financial support: self-funded.
TABLE 1.
Baseline anthropometric and biochemical characteristics of subjects with diabetes
TABLE 2.
Baseline, clinical and anthropometric characteristics among good glycemic and poor glycemic control of subjects with diabetes
TABLE 3.
Comparison between biochemical parameters and indices of diabetic patients with good and poor glycemic control
TABLE 4.
The correlation analysis of TYG with HbA1c, HOMA-IR, TYG-BMI and TYG-WC in type 2 diabetes mellitus
FIGURE 1.
Receiver operating characteristic curve (ROC)
TABLE 5.
Area under the curve of different parameters in predicting poor glycemic control
Contributor Information
Nachimuthu MAITHILI KARPAGA SELVI, Department of Biochemistry, Mahatma Gandhi Medical College and Research Institute, SBV, Puducherry, India.
Sivakumar NANDHINI, Department of Biochemistry, Mahatma Gandhi Medical College and Research Institute, SBV, Puducherry, India.
Varatharajan SAKTHIVADIVEL, Department of Medicine, All India Institute of Medical Sciences, Jodhpur, Rajasthan, India.
Shanmugam LOKESH, Department of Medicine, Mahatma Gandhi Medical College and Research Institute, SBV, Puducherry, India.
Abu Raghavan SRINIVASAN, Department of Biochemistry, Mahatma Gandhi Medical College and Research Institute, SBV, Puducherry, India.
Saravanan SUMATHI, Department of Biochemistry, Mahatma Gandhi Medical College and Research Institute, SBV, Puducherry, India.
References
- 1.González ELM, Johansson S, Wallander M-A, Rodríguez LAG. Trends in the prevalence and incidence of diabetes in the UK: 1996–2005. J Epidemiol Community Health. 2009;63:332–336. doi: 10.1136/jech.2008.080382. [DOI] [PubMed] [Google Scholar]
- 3.Wild S, Roglic G, Green A, et al. Global prevalence of diabetes: estimates for the year 2000 and projections for 2030. Diabetes Care. 2004;27:1047–1053. doi: 10.2337/diacare.27.5.1047. [DOI] [PubMed] [Google Scholar]
- 4.Chawla A, Chawla R, Jaggi S. Microvasular and macrovascular complications in diabetes mellitus: Distinct or continuum? Indian J Endocrinol Metab. 2016;20:546–551. doi: 10.4103/2230-8210.183480. [DOI] [PMC free article] [PubMed] [Google Scholar]
- 5.Dobiásová M, Frohlich J. The plasma parameter log (TG/HDL-C) as an atherogenic index: correlation with lipoprotein particle size and esterification rate in apoB-lipoprotein-depleted plasma (FER(HDL)). Clin Biochem. 2001;34:583–588. doi: 10.1016/s0009-9120(01)00263-6. [DOI] [PubMed] [Google Scholar]
- 6.Ormazabal V, Nair S, Elfeky O, et al. Association between insulin resistance and the development of cardiovascular disease. Cardiovasc Diabetol. 2018;17:122. doi: 10.1186/s12933-018-0762-4. [DOI] [PMC free article] [PubMed] [Google Scholar]
- 7.Matthews DR, Hosker JP, Rudenski AS, et al. Homeostasis model assessment: insulin resistance and beta-cell function from fasting plasma glucose and insulin concentrations in man. Diabetologia. 1985;28:412–419. doi: 10.1007/BF00280883. [DOI] [PubMed] [Google Scholar]
- 8.Saha S, Schwarz PEH. Impact of glycated hemoglobin (HbA1c) on identifying insulin resistance among apparently healthy individuals. J Public Health. 2017;25:505–512. [Google Scholar]
- 9.Škrha J, Šoupal J, Škrha J, Prázný M. Glucose variability, HbA1c and microvascular complications. Rev Endocr Metab Disord. 2016;17:103–110. doi: 10.1007/s11154-016-9347-2. [DOI] [PubMed] [Google Scholar]
- 10.Amato MC, Giordano C, Pitrone M, Galluzzo A . Cut-off points of the visceral adiposity index (VAI) identifying a visceral adipose dysfunction associated with cardiometabolic risk in a Caucasian Sicilian population. Lipids Health Dis. 2011;10:183. doi: 10.1186/1476-511X-10-183. [DOI] [PMC free article] [PubMed] [Google Scholar]
- 11.Babic N, Valjevac A, Zaciragic A, et al. The Triglyceride/HDL Ratio and Triglyceride Glucose Index as Predictors of Glycemic Control in Patients with Diabetes Mellitus Type 2. Med Arch. 2019;73:163–168. doi: 10.5455/medarh.2019.73.163-168. [DOI] [PMC free article] [PubMed] [Google Scholar]
- 12.Hameed EK. TyG index a promising biomarker for glycemic control in type 2 Diabetes Mellitus. Diabetes Metab Syndr. 2019;13:560–563. doi: 10.1016/j.dsx.2018.11.030. [DOI] [PubMed] [Google Scholar]
- 13.Park K, Ahn CW, Lee SB, et al. Elevated TyG Index Predicts Progression of Coronary Artery Calcification. Diabetes Care. 2019;42:1569–1573. doi: 10.2337/dc18-1920. [DOI] [PubMed] [Google Scholar]
- 14.Yan Z, Yu D, Cai Y, et al. Triglyceride Glucose Index Predicting Cardiovascular Mortality in Chinese Initiating Peritoneal Dialysis: A Cohort Study. Kidney Blood Press Res. 2019;44:669–678. doi: 10.1159/000500979. [DOI] [PubMed] [Google Scholar]
- 15.Miller M, Stone NJ, Ballantyne C, et al. Triglycerides and cardiovascular disease: a scientific statement from the American Heart Association. Circulation. 2011;123:2292–2333. doi: 10.1161/CIR.0b013e3182160726. [DOI] [PubMed] [Google Scholar]
- 16.Association AD. Diagnosis and Classification of Diabetes Mellitus. Diabetes Care 2. 010;33:S62–S69. [Google Scholar]
- 18.Amato MC, Giordano C, Galia M, et al. Visceral Adiposity Index: a reliable indicator of visceral fat function associated with cardiometabolic risk. Diabetes Care. 2010;33:920–922. doi: 10.2337/dc09-1825. [DOI] [PMC free article] [PubMed] [Google Scholar]
- 19.Friedewald WT, Levy RI, Fredrickson DS. Estimation of the Concentration of Low-Density Lipoprotein Cholesterol in Plasma, Without Use of the Preparative Ultracentrifuge. Clin Chem. 1972;18:499–502. [PubMed] [Google Scholar]
- 20.Rohlfing CL, Wiedmeyer H-M, Little RR, et al. Defining the relationship between plasma glucose and HbA(1c): analysis of glucose profiles and HbA(1c) in the Diabetes Control and Complications Trial. Diabetes Care. 2002;25:275–278. doi: 10.2337/diacare.25.2.275. [DOI] [PubMed] [Google Scholar]
- 21.Borggreve SE, De Vries R, Dullaart RPF. Alterations in high-density lipoprotein metabolism and reverse cholesterol transport in insulin resistance and type 2 diabetes mellitus: role of lipolytic enzymes, lecithin:cholesterol acyltransferase and lipid transfer proteins. Eur J Clin Invest. 2003;33:1051–1069. doi: 10.1111/j.1365-2362.2003.01263.x. [DOI] [PubMed] [Google Scholar]
- 22.Mooradian AD. Dyslipidemia in type 2 diabetes mellitus. Nat Clin Pract Endocrinol Metab. 2009;5:150–159. doi: 10.1038/ncpendmet1066. [DOI] [PubMed] [Google Scholar]
- 23.Ren X, Chen ZA, Zheng S, et al. Association between Triglyceride to HDL-C Ratio (TG/HDL-C) and Insulin Resistance in Chinese Patients with Newly Diagnosed Type 2 Diabetes Mellitus. PloS One. 2016;11:e0154345. doi: 10.1371/journal.pone.0154345. [DOI] [PMC free article] [PubMed] [Google Scholar]
- 24.McLaughlin T, Abbasi F, Cheal K, et al. Use of metabolic markers to identify overweight individuals who are insulin resistant. Ann Intern Med. 2003;139:802–809. doi: 10.7326/0003-4819-139-10-200311180-00007. [DOI] [PubMed] [Google Scholar]
- 25.Frayn KN. Visceral fat and insulin resistance — causative or correlative? Br J Nutr. 2000;83:S71–S77. doi: 10.1017/s0007114500000982. [DOI] [PubMed] [Google Scholar]
- 27.Wu J, Gong L, Li Q, et al. A novel visceral adiposity index for prediction of type 2 diabetes and pre-diabetes in Chinese adults: a 5-year prospective study. Sci Rep. 2017;7:13784. doi: 10.1038/s41598-017-14251-w. [DOI] [PMC free article] [PubMed] [Google Scholar]
- 28.Amato MC, Giordano C, Pitrone M, Galluzzo A. Cut-off points of the visceral adiposity index (VAI) identifying a visceral adipose dysfunction associated with cardiometabolic risk in a Caucasian Sicilian population. Lipids Health Dis. 2011;10:183. doi: 10.1186/1476-511X-10-183. [DOI] [PMC free article] [PubMed] [Google Scholar]
- 29.Lee S-H, Han K, Yang HK, et al. A novel criterion for identifying metabolically obese but normal weight individuals using the product of triglycerides and glucose. Nutr Diabetes. 2015;5:e149–e149. doi: 10.1038/nutd.2014.46. [DOI] [PMC free article] [PubMed] [Google Scholar]
- 30.Perry RJ, Samuel VT, Petersen KF, Shulman GI. The role of hepatic lipids in hepatic insulin resistance and type 2 diabetes. Nature. 2014;510:84–91. doi: 10.1038/nature13478. [DOI] [PMC free article] [PubMed] [Google Scholar]
- 31.Guerrero-Romero F, Simental-Mendía LE, González-Ortiz M, et al. The Product of Triglycerides and Glucose, a Simple Measure of Insulin Sensitivity. Comparison with the Euglycemic-Hyperinsulinemic Clamp. J Clin Endocrinol Metab. 2010;95:3347–3351. doi: 10.1210/jc.2010-0288. [DOI] [PubMed] [Google Scholar]


