

ABSTRACT
Background
Higher ultra-processed food intake has been linked with several cardiometabolic and cardiovascular diseases. However, prospective evidence from US populations remains scarce.
Objectives
To test the hypothesis that higher intake of ultra-processed foods is associated with higher risk of coronary artery disease.
Methods
A total of 13,548 adults aged 45–65 y from the Atherosclerosis Risk in Communities study were included in the analytic sample. Dietary intake data were collected through a 66-item FFQ. Ultra-processed foods were defined using the NOVA classification, and the level of intake (servings/d) was calculated for each participant and divided into quartiles. We used Cox proportional hazards models and restricted cubic splines to assess the association between quartiles of ultra-processed food intake and incident coronary artery disease.
Results
There were 2006 incident coronary artery disease cases documented over a median follow-up of 27 y. Incidence rates were higher in the highest quartile of ultra-processed food intake (70.8 per 10,000 person-y; 95% CI: 65.1, 77.1) compared with the lowest quartile (59.3 per 10,000 person-y; 95% CI: 54.1, 65.0). Participants in the highest compared with lowest quartile of ultra-processed food intake had a 19% higher risk of coronary artery disease (HR: 1.19; 95% CI: 1.05, 1.35) after adjusting for sociodemographic factors and health behaviors. An approximately linear relation was observed between ultra-processed food intake and risk of coronary artery disease.
Conclusions
Higher ultra-processed food intake was associated with a higher risk of coronary artery disease among middle-aged US adults. Further prospective studies are needed to confirm these findings and to investigate the mechanisms by which ultra-processed foods may affect health.
Keywords: ultra-processed foods, coronary artery disease, cardiovascular disease, ARIC, NOVA classification, diet and nutrition, epidemiology
Introduction
Cardiovascular disease is the leading cause of death worldwide, accounting for more than 17 million deaths each year (1). In the United States, cardiovascular disease remains a major cause of growing medical expenditures and health disparities. Despite prevention and treatment efforts over the last few decades, the prevalence of cardiovascular disease continues to grow, with a projection of nearly half of the US population developing cardiovascular disease by 2035 (2). A large proportion of cardiovascular disease cases are attributed to modifiable lifestyle risk factors, including diet (3).
Ultra-processed foods are defined as food and drink products formulated through industrial processes, and they generally contain nonculinary substances (e.g., hydrolyzed protein, modified starches, hydrogenated oils) and additives (e.g., colorants, nonsugar sweeteners, emulsifiers, humectants). Ultra-processed foods usually contain high amounts of refined carbohydrates, saturated fat, salt, and sugar, and are low in fiber and vitamins (4). Many of these nutritional factors have been linked to increased risk of cardiometabolic diseases (5). In addition to the poor nutritional quality of ultra-processed foods, the chemical and physical alterations they undergo, along with compounds that are either generated or added during the process, are believed to pose negative health effects (6). However, due to their hyperpalatable, inexpensive, and accessible nature, the consumption of ultra-processed foods has drastically increased over the last few decades. According to a nationwide cross-sectional study (NHANES), ultra-processed food consumption contributes to as high as 60% of total energy intake in the United States (7). The rising obesity epidemic in the United States, as well as related cardiovascular diseases, are correlated with a rise in ultra-processed food consumption (8).
Previous ecological and cross-sectional evidence from Brazil, Europe, and the United States indicated that ultra-processed food consumption is associated with excess weight gain, obesity, and metabolic syndrome (9–11). Longitudinal studies have provided evidence of a temporal relation between ultra-processed food intake and adverse cardiometabolic outcomes. Investigators have reported higher risk of incident hypertension, obesity, and all-cause mortality for those with a higher intake of ultra-processed food consumption group in the Seguimiento Universidad de Navarra cohort study conducted in Spain (12–14). In the NutriNet-Santé study conducted in France, consumption of ultra-processed foods was prospectively linked to a higher risk of type 2 diabetes, incident cardiovascular disease, and all-cause mortality (15–17). Even though the United States has one of the highest volumes of sales of ultra-processed foods per capita in the world (18), there is limited research on the prospective association between ultra-processed food consumption and cardiovascular disease risk in US populations.
In light of the current gaps in the literature, we aimed to investigate the prospective association between ultra-processed food consumption and the risk of incident coronary artery disease (CAD) in the Atherosclerosis Risk in Communities (ARIC) study, a large cohort of US adults.
Methods
Study population
The ARIC study is a community-based prospective cohort study of cardiovascular disease and its risk factors conducted in middle-aged US adults, predominately black and white men and women (19). The baseline population included 15,792 participants aged 45–64 y recruited in 1987–1989 from 4 communities in the United States: Washington County, MD; suburbs of Minneapolis, MN; Forsyth County, NC; and Jackson, MS. There have been 6 follow-up study visits, conducted in 1990–1992 (visit 2), 1993–1995 (visit 3), 1996–1998 (visit 4), 2011–2013 (visit 5), 2016–2017 (visit 6), and 2018–2019 (visit 7). The institutional review board at each site approved the study protocol, and all participants provided informed consent at each study visit. Procedures were followed in accordance with the ethical standards of the institutional review boards.
Our analytic sample included adults with ≤10 missing items on the FFQ and no missing data for baseline covariates (n = 14,976) (Supplemental Figure 1). Participants were excluded if they reported implausibly low or high energy intake (<600 or >4500 kcal/d for men and <500 or >3500 kcal/d for women, n = 6); had a history of CAD (n = 1332), were neither white nor black, or were black individuals from Washington County and suburbs of Minneapolis (n = 90), who were excluded due to small numbers. Our final sample size was 13,548.
Dietary assessment and ultra-processed food classification
Usual food intake was assessed by trained interviewers at baseline (1987–1989) and visit 3 (1993–1995) using a 66-item semiquantitative FFQ, modified from the Willett FFQ (20, 21). Different sizes of measuring cups and glasses were referenced to illustrate portion sizes. Participants reported how often on average they consumed each food item of a particular portion size in the previous year. Nutrient intake was calculated by multiplying self-reported frequency of consumption and portion size by the nutritional content of each food item from USDA data sources.
We used the NOVA classification system to categorize each reported food item in the FFQ into 1 of the following groups based on levels of processing: 1) unprocessed or minimally processed foods (obtained directly from plants or animals, with little or no alteration); 2) processed culinary ingredients (extracted from natural foods or from nature and has undergone processes such as pressing, grinding, crushing, pulverizing, and refining); 3) processed foods (products manufactured by industry with the use of group 2 added to group 1 to preserve or to make them more durable); 4) ultra-processed foods (industrial formulations made entirely or mostly from substances extracted from foods) (22). Examples of foods in all of these 4 categories are presented in Supplemental Table 1.
We focused on the ultra-processed food group for the present study. We incorporated dietary intake data from both visit 1 and visit 3 to improve the estimation of usual dietary intake (23). Specifically, visit 1 dietary intake data were used for those who developed CAD or were censored between visit 1 and visit 3. The average of visit 1 and visit 3 values was used for those who developed CAD or were censored after visit 3. We then adjusted for total energy intake using the residual method (24) and divided participants into quartiles based on their intake of ultra-processed food consumption at baseline (25).
Outcome ascertainment
CAD events were ascertained by a variety of techniques, including annual telephone interviews, to obtain information on hospitalizations and health events that occurred during the prior year. Additional cardiovascular events were detected by active surveillance of discharge lists from local hospitals and linkage to the National Death Index (19, 26). Trained medical chart abstractors recorded chest pain, cardiac enzyme concentrations, and up to three 12-lead electrocardiograms (ECGs) for hospitalized individuals. The ECGs were coded using the Minnesota Code and waveform changes were evaluated by trained technicians (27). Death certificates, interviews with ≥1 next of kin, and questionnaires completed by patients’ physicians were used for out-of-hospital death investigation. Coroner reports and autopsy reports were obtained for validation when available.
CAD incidence was defined as the first occurrence of a definite or probable hospitalization due to myocardial infarction (MI) or definite CAD death (26). Definite or probable MI hospitalization was identified by chest pain, cardiac enzyme concentrations, and/or ECG readings. Definite CAD death was defined based on a combination of chest pain symptoms, medical history, and relevant ICD-9 codes (410–414, 427.5, 429.2 and/or 799) from the death certificate. The ARIC Morbidity and Mortality Classification Committee reviewed and validated all potential clinical CAD diagnoses using published criteria and decided upon the final classification (26).
Measurement of covariates
Participants reported sociodemographic characteristics (age, race, sex, education level), health behaviors (smoking status, drinking status, physical activity), and medical history (diagnosed disease) through a validated questionnaire administered by trained interviewers. BMI (in kg/m2) was calculated from measurements of weight to the nearest pound and height to the nearest centimeter, with the participants wearing a scrub suit and no shoes. Blood creatinine was measured using the modified kinetic Jaffé method, standardized according to the National Institute of Standards and Technology standard, with calibrations accounting for between-assay variation (28, 29). Serum total cholesterol concentration was assessed using the enzymatic method from a single aqueous reagent (30).
Participants were classified as normal weight (BMI <25), overweight (BMI ≥25 or <30 kg/m2), or obese (BMI ≥30). Hypertension was defined as systolic blood pressure ≥140 mm Hg, diastolic blood pressure ≥90 mm Hg, or use of antihypertensive medication in the preceding 2 wk. Diabetes was defined as fasting blood glucose concentration ≥126 mg/dL, nonfasting blood glucose concentration ≥200 mg/dL, self-reported history of diagnosed diabetes, or use of current diabetes medication in the preceding 2 wk. Kidney function was described by stages of chronic kidney disease using estimated glomerular filtration rate (eGFR), which was calculated based on the Chronic Kidney Disease Epidemiology Collaboration (CKD-EPI) equation using blood creatinine (31).
Statistical analyses
Baseline characteristics and nutritional characteristics were examined according to quartiles of frequency of ultra-processed food consumption, using means ± SDs for continuous variables, and proportions for categorical variables.
We used multivariable Cox proportional hazards models, with years of follow-up from the baseline as the time metric, to calculate HRs and 95% CIs for the association between quartiles of ultra-processed food intake and incident CAD. We used the median value of each quartile to test for linear trends across quartiles. Model 1 adjusted for demographic characteristics (age, sex, total energy intake, and a combined term for race and study center). We used a combined term for race and study center to account for nonuniform racial distribution of participants in each study center. Model 2 additionally adjusted for socioeconomic level (education level) and health behaviors (smoking and drinking status, physical activity during leisure time). We considered model 2 as the main model.
We performed a mediation analysis to examine potential mediators (BMI, total serum cholesterol concentration, eGFR, hypertension status, and diabetes status) along the causal pathway between ultra-processed foods and incident CAD (Supplemental Figure 2).
In model 2, we conducted subgroup analyses by sex, race, BMI categories, diabetes status, and hypertension status. We performed likelihood ratio tests with interactions terms to test whether the association between ultra-processed foods and incident CAD differed across subgroups.
We used a restricted cubic spline with 4 knots at the 5th, 35th, 65th, and 95th percentiles to visually depict the shape of the association between ultra-processed food consumption and CAD risk in our multivariable Cox proportional models. The reference level was set at the 25th percentile of ultra-processed food consumption (4.02 servings/d). We also explored the association between each additional serving of ultra-processed foods above the reference level and the risk of incident CAD during follow-up.
Sensitivity analyses were performed by excluding the first 2 y of follow-up for all participants to minimize the possibility of competing risk due to other underlying health conditions at baseline. Additionally, we excluded the first 5 y of follow-up and CAD cases that were diagnosed within that period to avoid potential reverse causation. All data analyses were performed using Stata version 16.0 (StataCorp, LLC).
Results
A total of 13,548 participants were included in the present study. The mean baseline age of participants was 54 y and 56% were women. The energy-adjusted average ultra-processed food intake was 6.0 servings/d (range: 0.1–28.8 servings/d). Beverages such as low-calorie and regular soft drinks and fruit-flavored punch or noncarbonated beverages (27%), fats and oils such as margarine (18%), and bakery goods such as ready-made pie, donuts, biscuits or cornbread, and danish pastry (15%) contributed the most to the frequency of ultra-processed food consumption in the study population (Figure 1).
FIGURE 1.
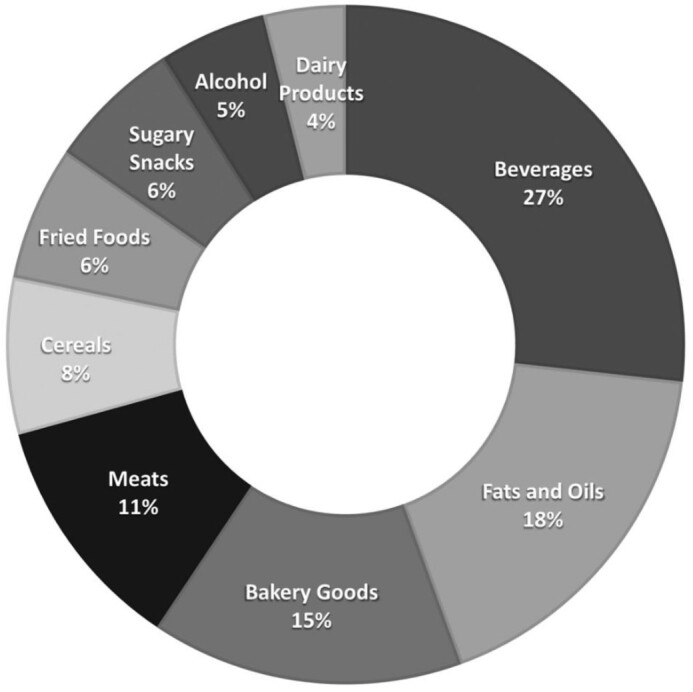
Proportion (%) of each food group contributing to the frequency (servings/d) of ultra-processed food consumption in the Atherosclerosis Risk in Communities Study. Dairy products: ice cream; fats and oils: margarine; meats: hamburgers, hot dogs, processed meats (sausage, salami, bologna), beef, pork, or lamb in dishes; sugary products: chocolate bars or pieces (Hershey's, plain M&M's, Snickers, Reese's), candy without chocolate; bakery goods: ready-made pie, donuts, biscuits, or cornbread; Danish pastry, sweet roll, coffee cake, croissant, cookies, cake, or brownie; cereals: cold breakfast cereal; fried foods: potato chips or corn chips, French fried potatoes, food fried away from home; beverages: orange or grapefruit juice, low calorie and regular soft drinks, fruit-flavored punch or noncarbonated beverages (lemonade, Kool-Aid, Hawaiian Punch); liquor: hard liquor.
Compared with participants in the lowest quartile, those in the highest quartile of frequency of ultra-processed food intake were more likely to be white, male, obese, and to have diabetes and stage 2+ chronic kidney disease (Table 1). The intake of ultra-processed foods was generally similar across the 4 study centers, with slightly higher intake in participants residing in the suburbs of Minneapolis, MN. Participants in the highest quartile of frequency of ultra-processed food intake had higher intakes of total fat, SFAs, MFAs, and PFAs, and sugar (Table 2). Dietary intake of protein, cholesterol, fiber, and micronutrients (e.g., folate, niacin, vitamin A, vitamin B6, vitamin B12, sodium, calcium, iron, phosphorus, magnesium, and potassium) were lower among participants in the highest quartile.
TABLE 1.
Baseline characteristics according to quartiles of ultra-processed food consumption in the Atherosclerosis Risk in Communities Study1
| Quartile 1 (n = 3343) | Quartile 2 (n = 3395) | Quartile 3 (n = 3430) | Quartile 4 (n = 3380) | |
|---|---|---|---|---|
| Ultra-processed food intake, servings/d | 3.9 ± 0.9 | 5.4 ± 0.3 | 6.4 ± 0.3 | 8.4 ± 1.6 |
| Age, y | 54.2 ± 5.8 | 54.1 ± 5.8 | 54.0 ± 5.7 | 53.7 ± 5.7 |
| Female | 1908 (57.1%) | 1970 (58.0%) | 1940 (56.6%) | 1750 (51.8%) |
| Black | 966 (28.9%) | 1042 (30.7%) | 910 (26.5%) | 574 (17.0%) |
| Study center | ||||
| Minneapolis, MN | 758 (22.7%) | 758 (22.3%) | 870 (25.4%) | 1197 (35.4%) |
| Jackson, MS | 844 (25.2%) | 952 (28.0%) | 829 (24.2%) | 491 (14.5%) |
| Washington County, MD | 781 (23.4%) | 799 (23.5%) | 844 (24.6%) | 937 (27.7%) |
| Forsyth County, NC | 960 (28.7%) | 886 (26.1%) | 887 (25.9%) | 755 (22.3%) |
| Education level | ||||
| Less than high school | 724 (21.7%) | 767 (22.6%) | 797 (23.2%) | 703 (20.8%) |
| High school | 968 (29.0%) | 1109 (32.7%) | 1163 (33.9%) | 1173 (34.7%) |
| Higher than high school | 1651 (49.4%) | 1519 (44.7%) | 1470 (42.9%) | 1504 (44.5%) |
| BMI | ||||
| Normal weight, <25.0 | 1217 (36.4%) | 1173 (34.6%) | 1175 (34.3%) | 1043 (30.9%) |
| Overweight, 25.0 to <30.0 | 1319 (39.5%) | 1312 (38.6%) | 1349 (39.3%) | 1368 (40.5%) |
| Obese, ≥30.0 | 807 (24.1%) | 910 (26.8%) | 906 (26.4%) | 969 (28.7%) |
| Smoking status | ||||
| Current smoker | 878 (26.3%) | 823 (24.2%) | 904 (26.4%) | 890 (26.3%) |
| Former smoker | 1031 (30.8%) | 1078 (31.8%) | 1036 (30.2%) | 1149 (34.0%) |
| Never smoker | 1434 (42.9%) | 1494 (44.0%) | 1490 (43.4%) | 1341 (39.7%) |
| Drinking status | ||||
| Current drinker | 1931 (57.8%) | 1837 (54.1%) | 1925 (56.1%) | 2086 (61.7%) |
| Former drinker | 576 (17.2%) | 620 (18.3%) | 592 (17.3%) | 612 (18.1%) |
| Never drinker | 836 (25.0%) | 938 (27.6%) | 913 (26.6%) | 682 (20.2%) |
| Physical activity score2 | 2.5 ± 0.8 | 2.4 ± 0.8 | 2.4 ± 0.8 | 2.4 ± 0.8 |
| Diabetes | 270 (8.1%) | 277 (8.2%) | 317 (9.2%) | 320 (9.5%) |
| Hypertension | 902 (27.0%) | 993 (29.2%) | 960 (28.0%) | 886 (26.2%) |
| Total serum cholesterol, mg/dL | 215 ± 42.1 | 215 ± 41.3 | 215 ± 41.4 | 214 ± 41.6 |
| Stage 2+ CKD, eGFR < 90 mL/(min·1.73 m²) | 492 (14.7%) | 520 (15.3%) | 558 (16.3%) | 542 (16.0%) |
Baseline characteristics are reported as means ± SDs for continuous variables and n (%) for categorical variables. CKD, chronic kidney disease; eGFR, estimated glomerular filtration rate.
Physical activity score for sport-related exercise during leisure time.
TABLE 2.
Nutritional characteristics according to quartiles of ultra-processed food consumption in the Atherosclerosis Risk in Communities Study1
| Nutrient | Quartile 1 (n = 3343) | Quartile 2 (n = 3395) | Quartile 3 (n = 3430) | Quartile 4 (n = 3380) |
|---|---|---|---|---|
| Total energy, kcal/d | 1690 ± 545 | 1490 ± 501 | 1520 ± 513 | 1740 ± 589 |
| Protein, % of energy | 19.7 ± 3.9 | 18.9 ± 3.5 | 17.7 ± 3.3 | 16.6 ± 3.5 |
| Carbohydrate, % of energy | 49.4 ± 8.8 | 49.1 ± 8.2 | 49.3 ± 8.2 | 48.9 ± 8.8 |
| Total fat, % of energy | 30.5 ± 6.4 | 32.1 ± 5.7 | 32.9 ± 5.6 | 34.1 ± 6.1 |
| SFA, % of energy | 11.1 ± 2.9 | 11.6 ± 2.6 | 11.8 ± 2.5 | 12.2 ± 2.6 |
| MUFA, % of energy | 11.7 ± 2.8 | 12.4 ± 2.6 | 12.9 ± 2.5 | 13.4 ± 2.7 |
| PUFA, % of energy | 4.5 ± 1.2 | 4.8 ± 1.1 | 5.0 ± 1.1 | 5.3 ± 1.3 |
| Sugar, g/1000 kcal | 65.2 ± 21.2 | 66.9 ± 20.9 | 68.8 ± 22.4 | 69.6 ± 25.5 |
| Alcohol, g/d | 7.0 ± 15.1 | 4.7 ± 10.1 | 5.0 ± 10.4 | 6.4 ± 14.2 |
| Cholesterol, mg/1000 kcal | 160 ± 59.3 | 161 ± 52.1 | 157 ± 54.2 | 145 ± 48.7 |
| Folate, μg/1000 kcal | 160 ± 50.0 | 157 ± 50.3 | 152 ± 50.5 | 145 ± 56.7 |
| Niacin, mg/1000 kcal | 12.8 ± 2.8 | 12.5 ± 2.7 | 11.8 ± 2.5 | 11.1 ± 2.7 |
| Fiber, g/1000 kcal | 12.3 ± 4.2 | 11.4 ± 3.6 | 10.5 ± 3.2 | 9.7 ± 3.0 |
| Vitamin A, IU/1000 kcal | 7270 ± 4830 | 6540 ± 3820 | 5760 ± 3690 | 4950 ± 3100 |
| Vitamin B6, mg/1000 kcal | 1.2 ± 0.3 | 1.2 ± 0.3 | 1.1 ± 0.3 | 1.0 ± 0.3 |
| Vitamin B12, μg/1000 kcal | 4.9 ± 2.3 | 4.9 ± 2.4 | 4.5 ± 2.1 | 4.1 ± 2.0 |
| Vitamin C, mg/1000 kcal | 78.5 ± 38.5 | 80.1 ± 38.9 | 80.5 ± 40.4 | 77.8 ± 44.8 |
| Vitamin E, mg/1000 kcal | 3.2 ± 1.4 | 3.2 ± 1.4 | 3.1 ± 1.4 | 3.0 ± 1.5 |
| Sodium, mg/1000 kcal | 938 ± 190 | 927 ± 171 | 924 ± 176 | 919 ± 177 |
| Calcium, mg/1000 kcal | 458 ± 184 | 418 ± 164 | 390 ± 143 | 381 ± 144 |
| Iron, mg/1000 kcal | 7.3 ± 2.0 | 7.3 ± 2.1 | 7.2 ± 2.2 | 6.8 ± 2.2 |
| Phosphorus, mg/1000 kcal | 727 ± 145 | 687 ± 140 | 650 ± 138 | 639 ± 148 |
| Magnesium, mg/1000 kcal | 177 ± 37.1 | 165 ± 35.6 | 155 ± 33.9 | 148 ± 34.4 |
| Zinc, mg/1000 kcal | 6.8 ± 1.4 | 6.8 ± 1.4 | 6.6 ± 1.5 | 6.6 ± 1.7 |
| Potassium, mg/1000 kcal | 1820 ± 378 | 1730 ± 370 | 1630 ± 357 | 1546 ± 357 |
Nutritional characteristics are reported as means ± SDs. IU, international units.
During a median follow-up of 27 y (312,266 person-years), a total of 2006 cases of incident CAD occurred. CAD incidence rate was 19.4% greater in the highest quartile (70.8 per 10,000 person-years; 95% CI: 65.1, 77.1) of ultra-processed food consumption compared with the lowest quartile (59.3 per 10,000 person-years; 95% CI: 54.1, 65.0). The cumulative incidence of CAD was higher for those in the highest quartile of ultra-processed food consumption compared with those in the lowest quartile throughout the follow-up period (Figure 2).
FIGURE 2.
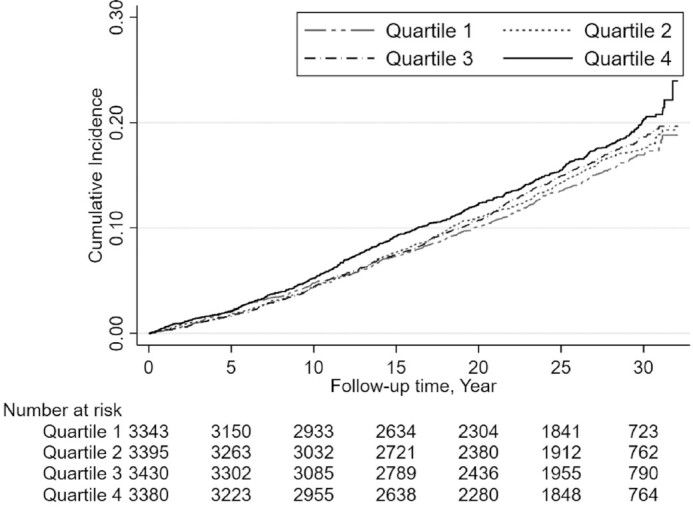
Kaplan-Meier estimate of cumulative incidence of coronary artery disease according to quartile of ultra-processed food consumption over 32 y of follow-up in the Atherosclerosis Risk in Communities Study.
After adjusting for age, sex, race-center, and total energy intake (model 1), participants in the highest compared with those in the lowest quartile of ultra-processed food intake had a 21% higher risk of incident CAD (HR: 1.21; 95% CI: 1.06, 1.37; Table 3). After additional adjustment for socioeconomic status and health behaviors (smoking, drinking, physical activity) (model 2), those in the highest compared with the lowest quartile of ultra-processed food intake had a 19% higher risk of CAD (HR: 1.19; 95% CI: 1.05, 1.35).
TABLE 3.
Incident coronary artery disease according to quartiles of ultra-processed food consumption in the Atherosclerosis Risk in Communities Study1
| Quartile 1 (n = 3343) | Quartile 2 (n = 3395) | Quartile 3 (n = 3430) | Quartile 4 (n = 3380) | |
|---|---|---|---|---|
| Events observed, n | 452 | 490 | 519 | 545 |
| Model 1 | 1 [reference] | 1.08 (0.95, 1.22) | 1.12 (0.98, 1.27) | 1.21 (1.06, 1.37) |
| Model 2 | 1 [reference] | 1.05 (0.92, 1.19) | 1.08 (0.95, 1.23) | 1.19 (1.05, 1.35) |
Model 1 was adjusted for age, sex, race–center, and total energy intake. Model 2 was adjusted for the variables in model 1 plus education level, smoking status, drinking status, and physical activity score. Results are presented as hazard ratios (95% CIs) unless indicated.
There was an approximately linear relation between higher intake of ultra-processed food intake and the risk of incident CAD, particularly for those who consumed ≥4 servings of ultra-processed foods/d (Figure 3). For each additional serving of ultra-processed food intake >4.02 servings/d, there was a 3.2% higher risk of incident CAD (95% CI: 0.74, 5.74).
FIGURE 3.
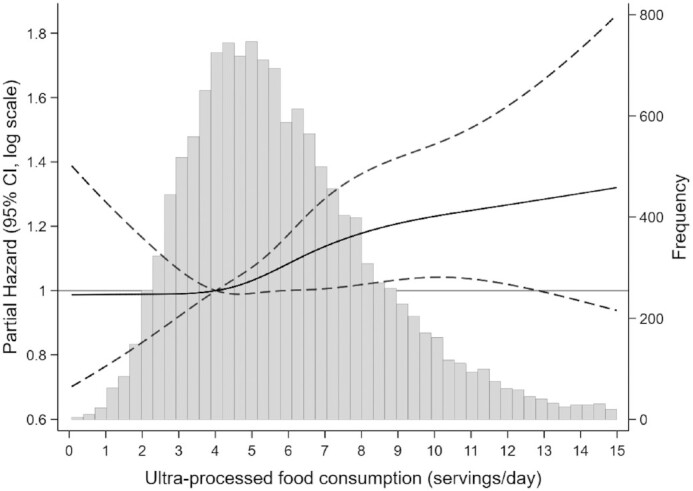
Partial hazard and 95% CIs for incident coronary artery disease according to intake of ultra-processed food/d using a restricted cubic spline in the Atherosclerosis Risk in Communities Study.1 The gray histogram shows the distribution of ultra-processed food consumption. The black solid line represents the partial hazard for incident coronary artery disease, modeled using restricted cubic splines with 4 knots at the 5th, 35th, 65th, and 95th percentiles. The reference level was set at the 25th percentile (4.02 servings/d). The black dashed lines represent 95% CIs. Partial hazard was adjusted for age, sex, race-center, total energy intake, education level, smoking and alcohol drinking status, and physical activity score.
BMI, eGFR, and diabetes status were mediators of the association between ultra-processed food consumption and incident CAD, with diabetes status accounting for the largest proportion of the association between ultra-processed food and incident CAD (9.9% mediated; 95% CI: 2.0%, 32.0%; Supplemental Table 2).
The association between ultra-processed food and incident CAD was similar across subgroups by sex, race, BMI category, diabetes status, and hypertension status (Figure 4). Results were similar in sensitivity analyses when we excluded the first 2 y of follow-up and excluded CAD cases that occurred in the first 5 y of follow-up.
FIGURE 4.

Subgroup analyses for the association between ultra-processed food consumption and incident coronary artery disease in the Atherosclerosis Risk in Communities Study.1 The model was adjusted for age, sex, race–center, total energy intake, education level, smoking and alcohol drinking status, and physical activity score. CAD, coronary artery disease.
Discussion
In this large prospective study of middle-aged US adults, we observed a significant association between higher ultra-processed food intake and higher risk of incident CAD. We found an approximately linear association, which remained significant after adjusting for demographic, socioeconomic, and clinical factors. The results were consistent across subgroups by sex, race, BMI categories, hypertension status, and diabetes status.
Our findings are consistent with those of previous studies which used the NOVA framework to study the association between ultra-processed food consumption and cardiovascular disease. Specifically, in the French NutriNet-Santé cohort, researchers found that a 10% higher intake of ultra-processed food was associated with a 13% higher risk of overall CAD (15). A recent study from the Framingham Offspring cohort reporter a 9% higher risk of incident CAD for each additional daily serving of ultra-processed foods (32). Our findings on the nutritional characteristics of ultra-processed food were also in line with those of previous studies indicating that diets that were higher in ultra-processed foods consisted of a higher amount of fat and sugar and a lower amount of protein, fiber, and micronutrients (32–34). However, most of the prior studies were conducted in European populations (France, Spain) and comprised =predominately white, highly educated, younger adults, with dietary patterns that are likely to be distinct from those in the United States. On the other hand, studies of ultra-processed foods conducted in US populations have mostly been cross-sectional or consisted of only a small proportion of African-American or Hispanic participants, which limits the generalizability of the results (10, 33). Only 1 prospective study in the United States conducted in NHANES included a sizable proportion of different racial groups in addition to white participants (34). To the best of our knowledge, our study is the first to assess the prospective association between ultra-processed food intake and incident CAD in a diverse sample of US adults consisting of black and white participants.
There are several potential pathways which may explain the association between ultra-processed food consumption and CAD. From a nutrition standpoint, participants in the highest quartile of ultra-processed food consumption had a higher intake of total fat, saturated fat, and sugar, and lower intake of fiber, protein, and micronutrients. Previous studies have reported that excessive intakes of saturated fat and sugar were associated with a higher risk of obesity and diabetes, which are important cardiovascular disease risk factors (35, 36). In a recent study conducted in a large sample of Italian men and women, high sugar intake explained around 36% of the association between ultra-processed foods and cerebrovascular mortality (37).
Beyond nutritional factors, ultra-processed food intake may elevate the risk of CAD by introducing neo-formed contaminants during food processing. For example, acrylamide and acrolein are 2 compounds that are found to be associated with elevated CAD risk (38, 39). Processing of food can alter the structure of food, which influences its functionality and bioavailability of nutrients (40). The modified structure of foods in combination with their poor nutritional quality such as the low fiber content, are likely to facilitate faster eating rates and higher energy intakes through the alterations of satiety and glycemic responses, which have been linked to major cardiovascular disease risk factors such as obesity and diabetes (41, 42).
Food additives used in ultra-processed foods may also play a role in the elevated CAD risk observed in our study. Research has shown peptides γ-glutamylvaline and γ-glutamylisoleucine, which are often used in chicken broth products to induce the lasting savory taste, are found to be associated with diabetes and progression of arterial stiffness (43). Monosodium glutamate is another glutamate metabolite that is used as a food additive and has been shown to lead to atherosclerosis and other CADs in animal experiments (44). Some studies have indicated that excess dietary phosphorus consumption, especially inorganic phosphate, which is high in ultra-processed foods, is associated with vascular calcification and increased risk of other cardiovascular outcomes (45, 46). Noncaloric sweeteners such as acesulfame potassium have also been found to accelerate atherosclerosis in cellular models (47). Emulsifiers like carboxymethylcellulose may influence the gut microbiome environment and lead to low-grade gastrointestinal inflammation in animals (48). Lastly, environmental chemicals from plastic food packaging for ultra-processed foods also play an important role in elevating the risk of CAD. One study using data from a nationally representative sample of US adults in NHANES found that urine concentrations of certain phthalates and bisphenols (endocrine-disrupting chemicals linked to obesity and diabetes) were higher among those in the highest compared with those in the lowest quartile of ultra-processed food intake (49).
It is worth noting that lower intake of sodium and cholesterol was observed among those in the highest quartile of ultra-processed food consumption, which was in contrast with our expectation. However, similar results have been reported in other US population–based studies (33, 47). We suspect that the low sodium intake observed in our study may have been due to the less comprehensive documentation of sodium intake in the FFQ or underestimation of sodium intake in the food composition databases. As for cholesterol concentrations, there are many food items that are high in cholesterol (e.g., eggs, unprocessed beef, simple cheeses, plain yogurt, etc.) that were not classified as ultra-processed foods, which may explain the observed inverse relation between ultra-processed food intake and cholesterol concentrations (50).
Strengths of our study include the long-term follow-up, prospective study design which allowed us to establish temporality between ultra-processed food consumption and incident CAD, large biracial sample of US adults to improve the external validity of the results, repeated measurements of dietary intake (visit 1 and 3) to account for within-individual variation, and rigorous ascertainment of CAD incidence.
There are also several limitations that need to be considered. First, the FFQ used in the present study was not specifically designed to answer food processing questions, and some common ultra-processed food items (e.g., energy bars, sports drinks) were not included. Second, misclassification errors can occur when classifying food items from the FFQ due to the lack of detailed information about food preparation and brands. However, there were similar trends in nutritional characteristics in our study compared with other studies that used 24-h dietary recalls, suggesting that we were able to rank participants according to frequency of consumption of ultra-processed foods reasonably well with the FFQ. Additionally, misclassification is likely nondifferential and biases our estimates toward the null. Third, despite many important confounders that we considered, residual confounding from unmeasured or imprecisely measured covariates cannot be ruled out. Last, the NOVA system has its own limitations, including lack of rigorous definition for processing levels and classification criteria that have been revised over time (51, 52). We decided to use the NOVA classification system to facilitate comparison with other studies, since it is the most commonly used framework.
In conclusion, in this study of middle-aged US adults, higher ultra-processed food consumption was associated with a higher risk of CAD. Our findings confirm the association between ultra-processed food intake and cardiovascular disease found in other study populations. We expanded these findings by using data from a biracial cohort with similar results for black and white participants. Given the rise in ultra-processed food consumption and correlated trend in obesity in recent years, our study supports considering levels of food processing in national dietary guidelines. In addition, these findings provide justification for clinicians to advise their patients to limit consumption of ultra-processed food. Further research is necessary to confirm our results in longitudinal studies using a universally agreed upon ultra-processed food definition and classification system. It is warranted to further explore the relevant mechanisms underlying the association between ultra-processed foods and CAD.
Supplementary Material
Acknowledgments
We thank the staff and participants of the Atherosclerosis Risk in Communities study for their important contributions.
The authors’ responsibilities were as follows—SD: designed the study, conducted data analysis, and drafted the manuscript; HK, CMR: contributed to data analysis, study planning, and manuscript revisions; and all authors: read and approved the final manuscript.
Notes
The Atherosclerosis Risk in Communities Study was carried out as a collaborative study supported by National Heart, Lung, and Blood Institute contracts (HHSN268201700001I, HHSN268201700002I, HHSN268201700003I, HHSN268201700004I, HHSN268201700005I). CMR is supported by grants from the National Institute of Diabetes and Digestive and Kidney Diseases (K01 DK107782, R03 DK128386) and the National Heart, Lung, and Blood Institute (R21 HL143089, R56 HL153178). The study funders had no role in the design, implementation, analysis, or data interpretation for the present study.
Author disclosures: The authors report no conflicts of interest.
Supplementary Figures 1 and 2 and Supplementary Tables 1 and 2 are available from the “Supplementary data” link in the online posting of the article and from the same link in the online table of contents at https://academic.oup.com/jn.
Abbreviations used: ARIC, Atherosclerosis Risk in Communities; CAD, coronary artery disease; ECG, electrocardiogram; eGFR, estimated glomerular filtration rate; IU, international unit; MI, myocardial infarction.
Contributor Information
Shutong Du, Welch Center for Prevention, Epidemiology, and Clinical Research, Johns Hopkins University, Baltimore, MD; Department of Epidemiology, Johns Hopkins Bloomberg School of Public Health, Baltimore, MD.
Hyunju Kim, Welch Center for Prevention, Epidemiology, and Clinical Research, Johns Hopkins University, Baltimore, MD; Department of Epidemiology, Johns Hopkins Bloomberg School of Public Health, Baltimore, MD.
Casey M Rebholz, Welch Center for Prevention, Epidemiology, and Clinical Research, Johns Hopkins University, Baltimore, MD; Department of Epidemiology, Johns Hopkins Bloomberg School of Public Health, Baltimore, MD.
Data Availability
The code book and analytic code will be made available upon request pending application and approval from the Atherosclerosis Risk in Communities (ARIC) study. Data described in the manuscript will be made available upon request pending application and approval from the National Heart, Lung, and Blood Institute (NHLBI) Biologic Specimen and Data Repository Information Coordinating Center (BioLINCC).
References
- 1. World Health Organization . Cardiovascular diseases [Internet]. Available from: https://www.who.int/westernpacific/health-topics/cardiovascular-diseases (accessed Apr 2021). [Google Scholar]
- 2. Khavjou OA, Phelps D, Leib A. Projections of cardiovascular disease prevalence and costs: 2015–2035. [Internet]. 2017. Available from: https://healthmetrics.heart.org/wp-content/uploads/2017/10/Projections-of-Cardiovascular-Disease.pdf (accessed Apr 2021) [Google Scholar]
- 3. Roth GA, Johnson C, Abajobir A, Abd-Allah F, Abera SF, Abyu G, Ahmed M, Aksut B, Alam T, Alam Ket al. Global, regional, and national burden of cardiovascular diseases for 10 causes, 1990 to 2015. J Am Coll Cardiol. 2017;70:1–25. [DOI] [PMC free article] [PubMed] [Google Scholar]
- 4. Gibney MJ. Ultra-processed foods: definitions and policy issues. Curr Dev Nutr. 2019;3:nzy077. [DOI] [PMC free article] [PubMed] [Google Scholar]
- 5. Anand SS, Hawkes C, de Souza RJ, Mente A, Dehghan M, Nugent R, Zulyniak MA, Weis T, Bernstein AM, Krauss Ret al. Food consumption and its impact on cardiovascular disease: importance of solutions focused on the globalized food system. J Am Coll Cardiol. 2015;66:1590–614. [DOI] [PMC free article] [PubMed] [Google Scholar]
- 6. Miclotte L, Van de Wiele T. Food processing, gut microbiota and the globesity problem. Crit Rev Food Sci Nutr. 2020;60:1769–82. [DOI] [PubMed] [Google Scholar]
- 7. Baraldi LG, Martinez Steele E, Canella DS, Monteiro CA. Consumption of ultra-processed foods and associated sociodemographic factors in the USA between 2007 and 2012: evidence from a nationally representative cross-sectional study. BMJ Open. 2018;8:e020574. [DOI] [PMC free article] [PubMed] [Google Scholar]
- 8. Laster J, Frame LA. Beyond the calories—is the problem in the processing?. Curr Treat Options Gastroenterol. 2019;17:577–86. [DOI] [PubMed] [Google Scholar]
- 9. Louzada ML da C, Baraldi LG, Steele EM, Martins APB, Canella DS, Moubarac J-C, Levy RB, Cannon G, Afshin A, Imamura Fet al. Consumption of ultra-processed foods and obesity in Brazilian adolescents and adults. Prev Med. 2015;81:9–15. [DOI] [PubMed] [Google Scholar]
- 10. Juul F, Martinez-Steele E, Parekh N, Monteiro CA, Chang VW. Ultra-processed food consumption and excess weight among US adults. Br J Nutr. 2018;120:90–100. [DOI] [PubMed] [Google Scholar]
- 11. Monteiro CA, Moubarac J-C, Levy RB, Canella DS, Louzada ML, da C, Cannon G. Household availability of ultra-processed foods and obesity in nineteen European countries. Public Health Nutr. 2018;21:18–26. [DOI] [PMC free article] [PubMed] [Google Scholar]
- 12. Mendonça R de D, Lopes ACS, Pimenta AM, Gea A, Martinez-Gonzalez MA, Bes-Rastrollo M. Ultra-processed food consumption and the incidence of hypertension in a Mediterranean cohort: the Seguimiento Universidad de Navarra project. Am J Hypertens. 2017;30:358–66. [DOI] [PubMed] [Google Scholar]
- 13. Mendonça R de D, Pimenta AM, Gea A, de la Fuente-Arrillaga C, Martinez-Gonzalez MA, Lopes ACS, Bes-Rastrollo M. Ultra-processed food consumption and risk of overweight and obesity: the University of Navarra Follow-Up (SUN) cohort study. Am J Clin Nutr. 2016;104:1433–40. [DOI] [PubMed] [Google Scholar]
- 14. Rico-Campà A, Martínez-González MA, Alvarez-Alvarez I, Mendonça R de D, de la Fuente-Arrillaga C, Gómez-Donoso C, Bes-Rastrollo M. Association between consumption of ultra-processed foods and all cause mortality: SUN prospective cohort study. BMJ. 2019;365:l1949. [DOI] [PMC free article] [PubMed] [Google Scholar]
- 15. Srour B, Fezeu LK, Kesse-Guyot E, Allès B, Méjean C, Andrianasolo RM, Chazelas E, Deschasaux M, Hercberg S, Galan Pet al. Ultra-processed food intake and risk of cardiovascular disease: prospective cohort study (NutriNet-Santé). BMJ. 2019;365:l1451. [DOI] [PMC free article] [PubMed] [Google Scholar]
- 16. Schnabel L, Kesse-Guyot E, Allès B, Touvier M, Srour B, Hercberg S, Buscail C, Julia C. Association between ultra-processed food consumption and risk of mortality among middle-aged adults in France. JAMA Intern Med. 2019;179:490–8. [DOI] [PMC free article] [PubMed] [Google Scholar]
- 17. Srour B, Fezeu LK, Kesse-Guyot E, Allès B, Debras C, Druesne-Pecollo N, Chazelas E, Deschasaux M, Hercberg S, Galan Pet al. Ultra-processed food consumption and risk of type 2 diabetes among participants of the NutriNet-Santé prospective cohort. JAMA Intern Med. 2020;180:283–91. [DOI] [PMC free article] [PubMed] [Google Scholar]
- 18. Vandevijvere S, Jaacks LM, Monteiro CA, Moubarac J-C, Girling-Butcher M, Lee AC, Pan A, Bentham J, Swinburn B. Global trends in ultra-processed food and drink product sales and their association with adult body mass index trajectories. Obes Rev. 2019;20(S2):10–19. [DOI] [PubMed] [Google Scholar]
- 19. The Atherosclerosis Risk in Communities (ARIC) study: design and objectives. The ARIC investigators. Am J Epidemiol. 1989;129:687–702. [PubMed] [Google Scholar]
- 20. Willett WC, Sampson L, Stampfer MJ, Rosner B, Bain C, Witschi J, Hennekens CH, Speizer FE. Reproducibility and validity of a semiquantitative food frequency questionnaire. Am J Epidemiol. 1985;122:51–65. [DOI] [PubMed] [Google Scholar]
- 21. Stevens J, Metcalf PA, Dennis BH, Tell GS, Shimakawa T, Folsom AR. Reliability of a food frequency questionnaire by ethnicity, gender, age and education. Nutr Res. 1996;16:735–45. [Google Scholar]
- 22. Monteiro CA, Cannon G, Moubarac J-C, Levy RB, Louzada MLC, Jaime PC. The UN Decade of Nutrition, the NOVA food classification, and the trouble with ultra-processing. Public Health Nutr. 2018;21:5–17. [DOI] [PMC free article] [PubMed] [Google Scholar]
- 23. Hu FB, Stampfer MJ, Rimm E, Ascherio A, Rosner BA, Spiegelman D, Willett WC. Dietary fat and coronary heart disease: a comparison of approaches for adjusting for total energy intake and modeling repeated dietary measurements. Am J Epidemiol. 1999;149:531–40. [DOI] [PubMed] [Google Scholar]
- 24. Willett WC, Howe GR, Kushi LH. Adjustment for total energy intake in epidemiologic studies. Am J Clin Nutr. 1997;65:1220S–8S.; discussion 1229S-1231S. [DOI] [PubMed] [Google Scholar]
- 25. Brown CC, Kipnis V, Freedman LS, Hartman AM, Schatzkm A, Wacholder S. Energy adjustment methods for nutritional epidemiology: the effect of categorization. Am J Epidemiol. 1994;139:323–38. [DOI] [PubMed] [Google Scholar]
- 26. White AD, Folsom AR, Chambless LE, Sharret AR, Yang K, Conwill D, Higgins M, Williams OD, Tyroler HA. Community surveillance of coronary heart disease in the Atherosclerosis Risk in Communities (ARIC) Study: methods and initial two years’ experience. J Clin Epidemiol. 1996;49:223–33. [DOI] [PubMed] [Google Scholar]
- 27. Prineas RJ, Crow RS, Blackburn H. The Minnesota code manual of electrocardiographic findings: standards and procedures for measurement and classification. Littleton, MA: John Wright; 1982. [Google Scholar]
- 28. Lustgarten JA, Wenk RE. Simple, rapid, kinetic method for serum creatinine measurement. Clin Chem. 1972;18:1419–22. [PubMed] [Google Scholar]
- 29. Parrinello CM, Grams ME, Couper D, Ballantyne CM, Hoogeveen RC, Eckfeldt JH, Selvin E, Coresh J. Recalibration of blood analytes over 25 years in the Atherosclerosis Risk in Communities Study: impact of recalibration on chronic kidney disease prevalence and incidence. Clin Chem. 2015;61:938–47. [DOI] [PMC free article] [PubMed] [Google Scholar]
- 30. Allain CC, Poon LS, Chan CSG, Richmond W, Fu PC. Enzymatic determination of total serum cholesterol. Clin Chem. 1974;20:470–5. [PubMed] [Google Scholar]
- 31. Levey AS, Stevens LA, Schmid CH, Zhang YL, Castro AF, Feldman HI, Kusek JW, Eggers P, Van Lente F, Greene Tet al. A new equation to estimate glomerular filtration rate. Ann Intern Med. 2009;150:604–12. [DOI] [PMC free article] [PubMed] [Google Scholar]
- 32. Juul F, Vaidean G, Lin Y, Deierlein AL, Parekh N. Ultra-processed foods and incident cardiovascular disease in the Framingham Offspring Study. J Am Coll Cardiol. 2021;77:1520–31. [DOI] [PubMed] [Google Scholar]
- 33. Zhong G-C, Gu H-T, Peng Y, Wang K, Wu Y-Q-L, Hu T-Y, Jing F-C, Hao F-B. Association of ultra-processed food consumption with cardiovascular mortality in the US population: long-term results from a large prospective multicenter study. Int J Behav Nutr Phys Act. 2021;18:21. [DOI] [PMC free article] [PubMed] [Google Scholar]
- 34. Kim H, Hu EA, Rebholz CM. Ultra-processed food intake and mortality in the USA: results from the Third National Health and Nutrition Examination Survey (NHANES III, 1988–1994). Public Health Nutr. 2019;22:1777–85. [DOI] [PMC free article] [PubMed] [Google Scholar]
- 35. Perfilyev A, Dahlman I, Gillberg L, Rosqvist F, Iggman D, Volkov P, Nilsson E, Risérus U, Ling C. Impact of polyunsaturated and saturated fat overfeeding on the DNA-methylation pattern in human adipose tissue: a randomized controlled trial. Am J Clin Nutr. 2017;105:991–1000. [DOI] [PubMed] [Google Scholar]
- 36. Malik VS, Schulze MB, Hu FB. Intake of sugar-sweetened beverages and weight gain: a systematic review. Am J Clin Nutr. 2006;84:274–88. [DOI] [PMC free article] [PubMed] [Google Scholar]
- 37. Bonaccio M, Di Castelnuovo A, Costanzo S, De Curtis A, Persichillo M, Sofi F, Cerletti C, Donati MB, de Gaetano G, Iacoviello L. Ultra-processed food consumption is associated with increased risk of all-cause and cardiovascular mortality in the Moli-Sani Study. Am J Clin Nutr. 2021;113:446–55. [DOI] [PubMed] [Google Scholar]
- 38. Zhang Y, Huang M, Zhuang P, Jiao J, Chen X, Wang J, Wu Y. Exposure to acrylamide and the risk of cardiovascular diseases in the National Health and Nutrition Examination Survey 2003–2006. Environ Int. 2018;117:154–63. [DOI] [PubMed] [Google Scholar]
- 39. Wang L, Sun Y, Asahi M, Otsu K. Acrolein, an environmental toxin, induces cardiomyocyte apoptosis via elevated intracellular calcium and free radicals. Cell Biochem Biophys. 2011;61:131–6. [DOI] [PubMed] [Google Scholar]
- 40. Sensoy I. A review on the relationship between food structure, processing, and bioavailability. Crit Rev Food Sci Nutr. 2014;54:902–9. [DOI] [PubMed] [Google Scholar]
- 41. Hall KD, Ayuketah A, Brychta R, Cai H, Cassimatis T, Chen KY, Chung ST, Costa E, Courville A, Darcey Vet al. Ultra-processed diets cause excess calorie intake and weight gain: an inpatient randomized controlled trial of ad libitum food intake. Cell Metab. 2019;30:67–77.e3. [DOI] [PMC free article] [PubMed] [Google Scholar]
- 42. Fardet A. Minimally processed foods are more satiating and less hyperglycemic than ultra-processed foods: a preliminary study with 98 ready-to-eat foods. Food & Function. 2016;7(5):2338–46. [DOI] [PubMed] [Google Scholar]
- 43. Li C, He J, Li S, Chen W, Bazzano L, Sun X, Shen L, Liang L, Shen Y, Gu Xet al. Novel metabolites are associated with augmentation index and pulse wave velocity: findings from the Bogalusa Heart Study. Am J Hypertens. 2019;32:547–56. [DOI] [PMC free article] [PubMed] [Google Scholar]
- 44. Singh K, Ahluwalia P. Effect of monosodium glutamate on lipid peroxidation and certain antioxidant enzymes in cardiac tissue of alcoholic adult male mice. J Cardiovasc Dis Res. 2012;3:12–8. [DOI] [PMC free article] [PubMed] [Google Scholar]
- 45. Disthabanchong S. Phosphate and cardiovascular disease beyond chronic kidney disease and vascular calcification. Int J Nephrol. 2018;2018:3162806. [DOI] [PMC free article] [PubMed] [Google Scholar]
- 46. McGovern AP, Lusignan S, Vlymen J, Liyanage H, Tomson CR, Gallagher H, Rafiq M, Jones S. Serum phosphate as a risk factor for cardiovascular events in people with and without chronic kidney disease: a large community based cohort study. PLoS One. 2013;8:e74996. [DOI] [PMC free article] [PubMed] [Google Scholar]
- 47. Jang W, Jeoung NH, Cho K-H. Modified apolipoprotein (apo) A-I by artificial sweetener causes severe premature cellular senescence and atherosclerosis with impairment of functional and structural properties of apoA-I in lipid-free and lipid-bound state. Mol Cells. 2011;31:461–70. [DOI] [PMC free article] [PubMed] [Google Scholar]
- 48. Chassaing B, Koren O, Goodrich JK, Poole AC, Srinivasan S, Ley RE, Gewirtz AT. Dietary emulsifiers impact the mouse gut microbiota promoting colitis and metabolic syndrome. Nature. 2015;519:92–6. [DOI] [PMC free article] [PubMed] [Google Scholar]
- 49. Buckley JP, Kim H, Wong E, Rebholz CM. Ultra-processed food consumption and exposure to phthalates and bisphenols in the US National Health and Nutrition Examination Survey, 2013–2014. Environ Int. 2019;131:105057. [DOI] [PMC free article] [PubMed] [Google Scholar]
- 50. Zhang Z, Jackson SL, Martinez E, Gillespie C, Yang Q. Association between ultra-processed food intake and cardiovascular health in US adults: a cross-sectional analysis of the NHANES 2011–2016. Am J Clin Nutr. 2021;113:428–36. [DOI] [PMC free article] [PubMed] [Google Scholar]
- 51. Poti JM, Braga B, Qin B. Ultra-processed food intake and obesity: what really matters for health—processing or nutrient content?. Curr Obes Rep. 2017;6:420–31. [DOI] [PMC free article] [PubMed] [Google Scholar]
- 52. Gibney MJ, Forde CG, Mullally D, Gibney ER. Ultra-processed foods in human health: a critical appraisal. Am J Clin Nutr. 2017;106:717–24. [DOI] [PubMed] [Google Scholar]
Associated Data
This section collects any data citations, data availability statements, or supplementary materials included in this article.
Supplementary Materials
Data Availability Statement
The code book and analytic code will be made available upon request pending application and approval from the Atherosclerosis Risk in Communities (ARIC) study. Data described in the manuscript will be made available upon request pending application and approval from the National Heart, Lung, and Blood Institute (NHLBI) Biologic Specimen and Data Repository Information Coordinating Center (BioLINCC).