

Abstract
Background
Patients with chronic kidney disease (CKD) have an increased risk of peripheral arterial disease (PAD). The ankle–brachial index (ABI), a noninvasive measure of PAD, is a predictor of adverse events among individuals with CKD. In general populations, changes in ABI have been associated with mortality, but this association is not well understood among patients with CKD.
Methods
We conducted a prospective study of 2920 participants in the Chronic Renal Insufficiency Cohort Study without lower extremity revascularization or amputation at baseline and with at least one follow-up ABI measurement (taken at annual visits) during the first 4 years of follow-up. The ABI was obtained by the standard protocol.
Results
In Cox proportional hazard regression analyses, we found a U-shaped association of average annual change in ABI with all-cause mortality. After adjusting for baseline ABI and other covariates, compared with participants with an average annual change in ABI of 0–<0.02, individuals with an average annual change in ABI <−0.04 or ≥0.04 had multivariable-adjusted hazard ratios (HRs) of 1.81 [95% confidence interval (CI) 1.34–2.44) and 1.42 (95% CI 1.12–1.82) for all-cause mortality, respectively. Compared with the cumulative average ABI of 1.0–<1.4, multivariable-adjusted HRs for those with a cumulative average ABI of <0.9, 0.9–<1.0 and ≥1.4 were 1.93 (95% CI 1.42–2.61), 1.20 (0.90–1.62) and 1.31 (0.94–1.82), respectively.
Conclusions
This study indicates both larger decreases and increases in average annual changes in ABI (>0.04/year) were associated with higher mortality risk. Monitoring changes in ABI over time may facilitate risk stratification for mortality among individuals with CKD.
Keywords: biomarker, blood pressure, chronic renal insufficiency, epidemiology, survival analysis
Key Learning Points
What is already known about this subject?
Individuals with chronic kidney disease (CKD) have elevated risk of cardiovascular disease, including peripheral arterial disease (PAD).
The ankle–brachial index (ABI), a simple measure of subclinical PAD, is a predictor of all-cause mortality among patients with CKD.
It is important to better understand how changes in ABI over time are related to the risk of mortality among patients with CKD.
What this study adds?
Using ABI measurements collected over multiple years (median of five measurements) from the Chronic Renal Insufficiency Cohort Study, we found that larger decreases and increases in average annual changes in ABI (>0.04/year) were associated with a higher risk of mortality.
This is the first study to report that a larger average increase in ABI per year is related to a higher risk of mortality among patients with CKD, a finding that should be explored in further research.
There was also a nonlinear relationship of cumulative average ABI with the risk of mortality, with the greatest risk among individuals with a cumulative average ABI <0.9.
What impact this may have on practice or policy?
Monitoring changes in ABI over time may facilitate risk stratification for mortality among individuals with CKD.
If similar associations are observed in other populations, then this may potentially support the use of repeated ABI monitoring for risk stratification among other high-risk populations.
INTRODUCTION
Compared with the general population, individuals with chronic kidney disease (CKD) have a higher risk of cardiovascular disease (CVD) [1, 2], including peripheral arterial disease (PAD) [3, 4]. Meta-analyses of general population studies have reported that both low and high ankle–brachial indices (ABIs) are associated with an elevated risk of mortality [5, 6]. Among patients with CKD [7] and with end-stage renal disease (ESRD) on chronic hemodialysis [8, 9], low ABI is a predictor of all-cause mortality. A meta-analysis reported a high ABI is associated with an elevated risk of mortality among individuals in the general population and among patients with CKD [6].
In contrast to an ABI measured once, associations with repeated measurements of ABI over time (e.g. change in ABI per year) with subsequent mortality risk have been much less explored. Prior studies have reported that declines in ABI over time are associated with adverse outcomes [10–13]. However, with the exception of a small study among participants with diabetes and proteinurea [13], no prior publications have reported the association of ABI measured over multiple years with the risk of all-cause mortality among individuals with CKD. As ABI is a simple, minimal risk and noninvasive measure of subclinical PAD [14] and individuals with CKD are at increased risk of PAD [3], it is important to better understand how, after taking a baseline ABI into account, repeated measures of ABI and the change in ABI over time are related to the risk of mortality in this population. A better understanding of such associations may help to improve risk stratification among individuals with CKD.
We used data from the Chronic Renal Insufficiency Cohort (CRIC) Study to study the associations between change in ABI and cumulative average ABI derived from repeated ABI measurements collected over multiple years with risk of all-cause mortality among individuals with CKD [15].
MATERIALS AND METHODS
Study design and population
The design of the CRIC Study is described in detail elsewhere [15, 16]. The CRIC Study enrolled 3939 men and women 21–74 years of age with mild to moderate CKD from 2003 to 2008 at seven US clinical centers. Individuals were eligible if they had an estimated glomerular filtration rate (eGFR) of 20–70 mL/min/1.73 m2. Exclusion criteria included previous dialysis (>1 month), New York Heart Association class III or IV heart failure, polycystic kidney disease or other primary kidney diseases that required active immunosuppression. Participants provided written informed consent. The institutional review boards at each participating site approved the CRIC protocol.
Self-reported information on claudication, amputation or angioplasty and procedures to open up blood vessels in the arms or legs was collected at baseline. We excluded individuals with a lower extremity revascularization or amputation prior to baseline (n = 269), with missing baseline ABI (n = 43) or with missing covariates at baseline (n = 207), yielding 3420 individuals. We further restricted analyses to those with at least two ABI measurements by the fifth CRIC visit (4 years after the start of the study) and still under follow-up after the fifth CRIC visit (n = 2920).
All-cause mortality
Study participants were followed up with annual clinic visits and 6-month telephone interviews. Deaths were ascertained from next of kin, obituaries, death certificates, reviews of hospital records and the National Death Index.
ABI
At each annual clinic visit, ABI measurements were obtained by the standard protocol [17]. After the participant rested supine for 5 min, systolic blood pressure (BP) was measured in both arms with the appropriately sized arm cuff. For each leg, systolic BP in the posterior tibial and dorsalis pedis artery was measured. A continuous-wave Doppler ultrasound probe was used to detect all pressures. Leg-specific ABI was calculated by dividing the higher systolic BP in the posterior tibial or dorsalis pedis by the higher of the right or left brachial systolic BPs. For derivation of all ABI exposures, we derived the change in ABI or time-updated ABI using the same leg throughout (leg with the lowest ABI at the first visit).
Covariates
At baseline and follow-up examinations, participants self-reported sociodemographic information, medical history, medication use and lifestyle factors. Current smokers were defined as participants who currently smoked or had smoked >100 cigarettes in their lifetime. Participants who consumed one or more beverages containing alcohol per week over the past year were defined as alcohol drinkers. Physical activity was estimated by the total metabolic equivalent of task per week. Details on the collection of anthropometric measures and laboratory measurements are included in the Supplementary Materials.
Statistical analyses
Descriptive statistics
Baseline characteristics were calculated for study participants based on the category of average annual change in ABI (categories derived from splines, as described below).
Average annual change in ABI
First, we assessed the association of the average change in ABI per year with subsequent hazard of all-cause mortality. We used annual ABI measurements to calculate the ABI slope during a baseline period consisting of the first five CRIC visits. To calculate each participant’s ABI slope we used linear regression models with ABI at a visit as the dependent variable and time of ABI measurement (years since first visit) as the independent variable.
We used Cox proportional hazards models to assess the association of the average change in ABI per year during the baseline period with subsequent risk of all-cause mortality, starting follow-up at the fifth CRIC visit [18, 19]. We adjusted for ABI and covariates measured or reported at the first CRIC visit. We first adjusted for age, sex, race/ethnicity, clinic site and baseline ABI. Second, we adjusted for high school education, physical activity, current cigarette smoking, alcohol consumption, body mass index, systolic BP, glucose, high-density lipoprotein cholesterol, low-density lipoprotein cholesterol, high-sensitivity C-reactive protein, history of CVD, diabetes, hypertension and use of medications (angiotensin-converting enzyme inhibitors or angiotensin II receptor blockers, β-blockers, aspirin and statins). Third, we additionally adjusted for eGFR and 24-h urine albumin excretion.
We used a restricted cubic spline to explore the association of the average change in ABI per year with the multivariable-adjusted hazard of mortality [20]. This allowed us to nonparametrically examine the association with mortality. We used four knots with cut points at the 5, 35, 50, 65 and 95th percentiles of the average annual change in ABI [21]. To minimize the influence of outliers, the bottom 2.5 and top 2.5 percentiles were removed from the spline models. Based on the spline’s shape, we empirically chose cut points of <−0.04, −0.04–<−0.02, −0.02–<0, 0–<0.02, 0.02–<0.04 and ≥0.04 for categories of average change in ABI per year. Tests for nonlinearity used the likelihood ratio test, comparing the model with only the linear term to the model with the spline terms.
Cumulative average ABI
We used Cox proportional hazards models to examine the association of mortality with time-updated ABI exposure. To minimize within-subject variation in the ABI, we used the cumulative average ABI, in which mortality between each clinic visit was related to the cumulative average of ABI calculated by averaging all prior ABI measurements [22]. We started follow-up at the fifth CRIC visit.
We adjusted for the same variables previously described. Except for variables measured only at baseline or time-invariant variables, we adjusted for time-updated covariates. Based on results from a restricted cubic spline and prior research [6, 7], we selected a level of 1.0–1.4 ABI as the reference category, with groups categorized as <0.9, 0.9–<1.0, 1.0–<1.4 and ≥1.4 [7].
We conducted analyses using SAS version 9.4 (SAS Institute, Cary, NC, USA) and R version 4.0.2 (R Foundation for Statistical Computing, Vienna, Austria). All P-values are two‐sided and statistical significance was defined as P < 0.05. Additional details are included in the Supplementary Methods.
RESULTS
Baseline characteristics by the average change in ABI per year categories are presented in Table 1. Compared with other categories, those with an average change in ABI per year <−0.04 were more likely to be female, less likely to be current drinkers and had higher systolic BP. Those with an average change in ABI per year ≥0.04 were less likely to be female and more likely to have clinical CVD. Compared with those with an average change in ABI per year of −0.04–0.04, those with a change in ABI of <−0.04 or ≥0.04 had higher 24-h urinary albumin excretion; lower eGFR; were more likely to have clinical CVD, hypertension and diabetes mellitus and were more likely to take β-blockers or aspirin. Those with an average change in ABI per year of <0 were more likely to smoke than those with average change of ≥0. ABI at the first study visit was highest for those with an average change in ABI per year of <−0.04 and lowest for those with an average change in ABI per year of ≥0.04. During a mean follow-up time of 5.6 years, there were 619 deaths. Participants had a mean of 4.5 ABI measurements (range 2–5; median 5). The average time between consecutive ABI measurements was 1.1 years (median 1 year).
Table 1.
Baseline characteristics of study participants according to categories of average annual change in ABI
| Variables | <−0.04 (n = 263) | −0.04–< −0.02 (n = 261) | −0.02– <0 (n = 473) | 0–<0.02 (n = 642) | 0.02–<0.04 (n = 534) | ≥0.04 (n = 747) |
|---|---|---|---|---|---|---|
| Age (years), mean (SD) | 60 (10) | 58 (11) | 57 (11) | 57 (11) | 58 (11) | 58 (11) |
| Female, n (%) | 139 (53) | 126 (48) | 230 (49) | 307 (48) | 245 (46) | 322 (43) |
| Race/ethnicity, n (%) | ||||||
| Non-Hispanic white | 104 (40) | 107 (41) | 204 (43) | 304 (47) | 255 (48) | 319 (43) |
| Non-Hispanic black | 119 (45) | 110 (42) | 206 (44) | 260 (41) | 199 (37) | 292 (39) |
| Hispanic | 31 (12) | 33 (13) | 42 (9) | 55 (9) | 53 (10) | 109 (15) |
| Other | 9 (3) | 11 (4) | 21 (4) | 23 (4) | 27 (5) | 27 (4) |
| High-school graduate, n (%) | 201 (76) | 205 (79) | 396 (84) | 541 (84) | 456 (85) | 594 (80) |
| Physical activity (total METs/week), mean (SD) | 196.4 (129.8) | 191.7 (161.2) | 213.5 (161.5) | 212.2 (137.4) | 216.8 (159.1) | 201.4 (141.4) |
| Current smoking, n (%) | 48 (15) | 32 (15) | 65 (14) | 69 (11) | 58 (10) | 76 (10) |
| Alcohol drinking, n (%) | 143 (54) | 175 (67) | 323 (68) | 433 (68) | 361 (68) | 470 (63) |
| Body mass index (kg/m2), mean (SD) | 33.0 (8.6) | 31.7 (7.1) | 31.5 (7.5) | 31.7 (7.5) | 32.0 (7.4) | 33.0 (7.6) |
| Systolic BP (mmHg), mean (SD) | 132 (23) | 126 (19) | 126 (20) | 125 (21) | 124 (20) | 127 (22) |
| HDL cholesterol (mg/dL), mean (SD) | 47.3 (14.1) | 47.5 (14.9) | 48.9 (15.7) | 49.0 (15.7) | 49.7 (15.4) | 46.5 (15.2) |
| LDL cholesterol (mg/dL), mean (SD) | 102.4 (38.7) | 101.0 (33.1) | 106.9 (34.5) | 105.4 (32.7) | 106.0 (34.9) | 98.2 (34.2) |
| Glucose (mg/dL), mean (SD) | 123.8 (67.0) | 107.4 (33.0) | 110.5 (49.9) | 107.7 (41.5) | 106.7 (39.7) | 116.4 (49.5) |
| High-sensitivity CRP (mg/L), mean (SD) | 5.86 (9.42) | 5.10 (8.52) | 5.67 (12.21) | 5.28 (8.36) | 4.94 (9.09) | 5.01 (7.61) |
| Estimated GFR [ mL/min/1.73 m2 (CKD-EPI equation)], mean (SD) | 43 (14) | 46 (14) | 46 (15) | 47 (15) | 47 (15) | 43 (14) |
| 24-h urine albumin excretion (g/24 h), mean (SD) | 0.67 (1.54) | 0.55 (1.46) | 0.53 (1.26) | 0.50 (1.25) | 0.44 (1.10) | 0.83 (1.87) |
| History of clinical CVD, n (%) | 82 (31) | 63 (24) | 123 (26) | 154 (24) | 126 (24) | 258 (35) |
| Hypertension, n (%) | 235 (89) | 221 (85) | 392 (83) | 531 (83) | 434 (82) | 664 (89) |
| Diabetes mellitus, n (%) | 155 (59) | 105 (40) | 175 (37) | 251 (39) | 195 (36) | 403 (54) |
| Use of ACE-I or ARBs, n (%) | 181 (69) | 173 (66) | 292 (62) | 437 (68) | 355 (66) | 534 (71) |
| Use of β-blockers, n (%) | 136 (52) | 123 (47) | 202 (43) | 281 (44) | 230 (43) | 384 (51) |
| Use of aspirin, n (%) | 117 (44) | 91 (35) | 192 (41) | 244 (38) | 208 (39) | 336 (45) |
| Use of statins, n (%) | 158 (60) | 147 (56) | 240 (51) | 330 (51) | 258 (48) | 426 (57) |
| ABI at first study visit | 1.17 (0.27) | 1.12 (0.18) | 1.08 (0.15) | 1.03 (0.15) | 1.03 (0.15) | 0.99 (0.20) |
METs: metabolic equivalent of task; BP: blood pressure; HDL: high-density lipoprotein; LDL: low-density lipoprotein; CRP: C-reactive protein; CKD-EPI: Chronic Kidney Disease Epidemiology Collaboration; CVD: cardiovascular disease; ACE-I: angiotensin-converting enzyme inhibitor; ARB: angiotensin II receptor blocker.
Average annual change in ABI
A multivariable-adjusted spline regression model suggested a U-shaped association between the average annual change in ABI and all-cause mortality (Figure 1). Table 2 reports the multivariable-adjusted associations between the average annual change in ABI and mortality. After adjusting for baseline ABI and other covariates, an average annual ABI change of <−0.04 or ≥0.04 (a decrease of >0.04/year or an increase of ≥0.04/year) were both associated with a higher hazard of mortality relative to the average annual change of 0–<0.02/year. In the fully adjusted multivariable model, compared with the average annual ABI change of 0–<0.02, those with an average annual ABI change <−0.04 had a hazard ratio (HR) of 1.81 [95% confidence interval (CI) 1.34–2.44] and those with an average annual ABI change ≥0.04 had an HR of 1.42 (95% CI 1.12–1.82). When the annual average change in ABI was removed from the model, the concordance decreased from 0.762 [standard error (SE) 0.009] to 0.757 (SE 0.009) (difference −0.005; P = 0.03).
FIGURE 1.
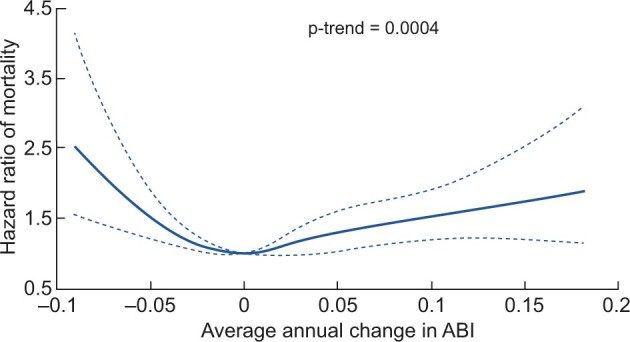
Spline plot of multivariable-adjusted HRs and 95% CIs of all-cause mortality associated with the average annual change in ABI. The solid line represents the point estimate and the dotted lines represent 95% CIs. Adjusted for age, sex, race, clinic site, baseline ABI (categories <0.9, 0.9–<1.0, 1.0–<1.4 and ≥1.4) and the following covariates: high-school education, physical activity, current smoking, alcohol use, body mass index, systolic BP, low-density lipoprotein and high-density lipoprotein cholesterol, glucose, high-sensitivity C-reactive protein, history of cardiovascular disease, diabetes, hypertension, use of angiotensin-converting enzyme inhibitors or angiotensin receptor blockers, β-blockers, aspirin and statins, 24-h urine albumin excretion at baseline and eGFR. Adjusted for baseline covariates. HR is plotted relative to a reference value of average annual change in ABI of 0.
Table 2.
Multivariable adjusted HRs of all-cause mortality associated with average annual change in ABI
| Average annual change in ABI | Model 1 | Model 2 | Model 3 | ||
|---|---|---|---|---|---|
| No. of events | Person-years | HR (95% CI) | HR (95% CI) | HR (95% CI) | |
| <−0.04/year | 88 | 1332 | 2.02 (1.50–2.72) | 1.81 (1.34–2.44) | 1.81 (1.34–2.44) |
| −0.04–<−0.02/year | 50 | 1407 | 1.22 (0.87–1.71) | 1.29 (0.92–1.81) | 1.31 (0.93–1.84) |
| −0.02–<0/year | 79 | 2737 | 0.98 (0.73–1.32) | 0.97 (0.74–1.31) | 0.94 (0.70–1.27) |
| 0–<0.02/year | 103 | 3747 | 1 (reference) | 1 (reference) | 1 (reference) |
| 0.02–<0.04/year | 93 | 3065 | 1.05 (0.79–1.39) | 1.12 (0.84–1.48) | 1.15 (0.86–1.52) |
| ≥0.04/year | 206 | 3999 | 1.50 (1.17–1.91) | 1.49 (1.17–1.90) | 1.42 (1.12–1.82) |
Model 1 adjusted for age, sex, race, clinic site and baseline ABI (categories <0.9, 0.9–<1.0, 1.0–<1.4 and ≥1.4). Model 2 additionally adjusted the following covariates: high-school education, physical activity, current smoking, alcohol use, body mass index, systolic blood pressure, low-density lipoprotein and high-density lipoprotein cholesterol, glucose, high-sensitivity C-reactive protein, history of cardiovascular disease, diabetes, hypertension, use of angiotensin-converting enzyme inhibitors or angiotensin receptor blockers, β-blockers, aspirin and statins. Model 3 additionally adjusted for 24-h urine albumin excretion and estimated GFR. Adjusted for covariates reported or measured at baseline.
Cumulative average ABI
The multivariable-adjusted spline model showed a nonlinear association between the cumulative average ABI and all-cause mortality (Figure 2). Table 3 reports multivariable-adjusted associations between the cumulative average ABI and mortality. After adjusting for baseline ABI and other covariates, compared with the cumulative average ABI of 1.0–<1.4, those with an ABI <0.9 had a 1.9 times higher mortality risk [HR 1.93 (95% CI 1.42–2.61)]; the HRs (95% CIs) for ABI 0.9–<1.0 and ABI ≥1.4 were 1.20 (0.90–1.61) and 1.31 (0.94–1.82), respectively. When the cumulative average ABI was removed from the model, the concordance decreased from 0.782 (SE 0.009) to 0.776 (SE 0.009) (difference −0.006; P = 0.0003).
FIGURE 2.

Spline plot of multivariable-adjusted HRs and 95% CIs of all-cause mortality associated with cumulative average ABI. The solid line represents the point estimate and the dotted lines represent 95% CIs. Adjusted for age, sex, race, clinic site and the following covariates: high-school education, physical activity, current smoking, alcohol use, body mass index, systolic blood pressure, low-density lipoprotein and high-density lipoprotein cholesterol at baseline, glucose, high-sensitivity C-reactive protein at baseline, history of cardiovascular disease, diabetes, hypertension, use of angiotensin-converting enzyme inhibitors or angiotensin receptor blockers, β-blockers, aspirin and statins, 24-h urine albumin excretion at baseline and estimated GFR. Unless otherwise noted or a variable that does not change over time (e.g. sex, race, clinic site and education), covariates were time-updated. HR is plotted relative to a reference value of cumulative average ABI of 1.2.
Table 3.
Multivariable-adjusted HRs of all-cause mortality associated with cumulative average ABI
| Cumulative average ABI | Model 1 | Model 2 | Model 3 | ||
|---|---|---|---|---|---|
| No. of events | Person-years | HR (95% CI) | HR (95% CI) | HR (95% CI) | |
| <0.9 | 143 | 1197 | 2.93 (2.15–3.99) | 2.05 (1.51–2.79) | 1.93 (1.42–2.61) |
| 0.9–<1.0 | 67 | 1324 | 1.51 (1.12–2.02) | 1.22 (0.91–1.64) | 1.20 (0.90–1.62) |
| 1.0–<1.4 | 359 | 13 067 | 1 (reference) | 1 (reference) | 1 (reference) |
| ≥1.4 | 50 | 699 | 2.36 (1.71, 3.26) | 1.52 (1.09–2.10) | 1.31 (0.94–1.82) |
Model 1 adjusted for age, sex, race, clinic site and baseline ABI (categories <0.9, 0.9–<1.0, 1.0–<1.4 and ≥1.4). Model 2 additionally adjusted for the following covariates: high-school education, physical activity, current smoking, alcohol use, body mass index, systolic blood pressure, low-density lipoprotein and high-density lipoprotein cholesterol at baseline, glucose, high-sensitivity C-reactive protein at baseline, history of cardiovascular disease, diabetes, hypertension, use of angiotensin-converting enzyme inhibitors or angiotensin receptor blockers, β-blockers, aspirin and statins. Model 3 additionally adjusted for 24-h urine albumin excretion at baseline and estimated GFR. Unless otherwise noted or a variable that does not change over time (e.g. sex, race, clinic site and education), covariates were time-updated.
Sensitivity analyses
Subgroup analyses
When we excluded individuals with an abnormal ABI at baseline (ABI <0.9 or ≥1.4; Supplementary data, Table S1), results were similar. Similar patterns were observed when restricting to participants without a history of CVD at the first CRIC visit (72%) or with diabetes mellitus at the first CRIC visit (44%; Supplementary data, Table S1). However, when excluding those with CVD at the first visit, the HR for cumulative average ABI <0.9 was stronger [HR 3.06 (95% CI 1.97–4.77)] compared with an ABI of 1.0–<1.4.
Adjustment for ABI in the other leg
When the average annual change in ABI analyses were adjusted for baseline ABI and average annual change in ABI in the leg with the higher ABI at the baseline visit, there was a similar, though attenuated, pattern (Supplementary data, Table S2). A higher average annual change in ABI in the leg with the higher ABI at the baseline visit was associated with higher mortality. When cumulative average ABI analyses were adjusted for baseline ABI and cumulative average ABI in the opposite leg, cumulative average ABI <0.9 in the leg with the lowest ABI at baseline was associated with mortality and cumulative average ABI ≥1.4 in the leg with higher ABI at baseline was associated with higher mortality (Supplementary data, Table S2).
Alternative exposure definitions
The pattern of association was similar when we examined the association of quintiles of the average change in ABI with mortality (Supplementary data, Table S3). Results were similar when the average annual change in ABI analyses were restricted to individuals with five ABI measurements by the fifth CRIC visit (Supplementary data, Table S3). When the average annual change in ABI was calculated based on the first six CRIC visits, patterns were similar (Supplementary data, Table S3). In analyses attempting to reduce the influence of outliers, we excluded any ABI measurements <0.3 or >2.0 when deriving the slope of change in ABI per year and observed a similar pattern (Supplementary data, Table S3). When the average change in ABI per year was calculated as the average of change since the most recent ABI divided by the time since the most recent ABI measurement (Supplementary Methods), there was an association of average annual ABI change of <−0.04 with a higher risk of mortality [HR 1.36 (95% CI 1.01–1.82)] but an average annual ABI change ≥0.04 was no longer associated with mortality (Supplementary data, Table S3).
When we analyzed the cumulative average ABI exposure starting follow-up at the first CRIC visit, results were similar (Supplementary data, Table S4). There were similar patterns of association when the cumulative average ABI exposure was lagged for 2 and 3 years (Supplementary data, Table S4). Similar associations were also observed for alternative approaches to defining ABI exposure: 3-year cumulative average ABI and most recent ABI, although the strength of the association for ABI ≥1.4 was stronger for both of these exposures than for the overall cumulative average ABI exposure (Supplementary data, Table S4). Findings for the change in ABI and cumulative average ABI exposures were similar when these exposures were derived with ABI measurements taken prior to clinical PAD (Supplementary data, Tables S3 and S4).
DISCUSSION
In this study we found that after adjustment for baseline ABI, the average annual change (increase or decrease) in ABI was associated with mortality. After adjusting for baseline ABI and other covariates, compared with the average annual decrease in ABI of −0.02–0, an average annual decrease in ABI of <−0.04/year or an increase in ABI of ≥0.04/year was associated with a higher risk of mortality. If extrapolated, these cut points would correspond to average changes of <−0.2 or ≥0.2 over a 5-year period. Among individuals with PAD, an ABI decrease of >0.15 can detect significant PAD progression [23]. Moreover, if someone started with an ABI of 1.1, an ABI decrease of 0.2 would move that individual into the PAD category (ABI ≤0.90) [23]. The average annual change in ABI findings were robust; sensitivity analyses yielded similar patterns. To our knowledge, this is the first study to evaluate the change in ABI using ABI measured at two or more time points across multiple years as a predictor of mortality among a large cohort of patients with CKD. Therefore this study provides key initial results on the potential importance of the change in ABI over a multiyear period among individuals with CKD.
After adjustment for covariates and baseline ABI, we observed a nonlinear association of cumulative average ABI with mortality. This pattern was consistently observed for different definitions of ABI (3-year cumulative average ABI and most recent ABI) and for additional sensitivity analyses. This builds on our prior work that reported a significant association between baseline ABI and mortality [7]. Our results also align with meta-analyses that found a similar nonlinear pattern of association between baseline ABI and mortality among patients with CKD [6, 24]. Studies among the general population have also found a nonlinear association between baseline ABI and mortality [5].
We assessed average changes in ABI and ABI slope for ABI measurements taken at several time points over multiple years among individuals with CKD and found both a decrease and an increase in ABI over time were associated with a higher risk of mortality, although changes in the concordance statistic are small. Prior studies in different populations have shown similar results for a decrease in ABI. A hospital vascular laboratory–based cohort found that a decline in ABI >0.15 in the prior 10 years (mean 5 years) was associated with subsequent risk of mortality at 3 but not 6 years [10]. One small study of patients with diabetes and proteinuria found that a decrease in ABI over two time points was associated with a higher risk of mortality [13]. Other small studies have found that ABI decline (measured annually >7 years) predicts CVD mortality in hemodialysis patients [11] and a large decrease in ABI over 1 year predicts CVD events [25]. Prior research (not focused on patients with CKD) among participants with PAD or suspected PAD [12] has also reported a positive association between declining ABI over two time points and the risk of mortality. In contrast to prior work, in addition to finding that a decrease in ABI over time predicted mortality, we found an increase in ABI over time was associated with a higher risk of mortality.
ABI is a simple, minimal risk and noninvasive measure of subclinical PAD [14]. As individuals with CKD have a higher risk of PAD [3], it is important to better understand how repeated ABI measurements taken over a number of years may help improve risk prediction among patients with CKD. In clinical practice, ABI ≤0.90 is most commonly used to diagnose PAD [23]. In line with low ABIs being a marker of PAD, we observed that larger decreases in ABI were associated with a higher risk of mortality. High ABI is a marker of lower extremity arterial stiffness and may be a marker of medial arterial calcification [10]. This may explain why we observed that an increase in ABI over time was associated with a higher risk of mortality. Medial arterial calcification is highly prevalent among individuals with CKD [26] and is associated with a higher risk of CVD in ESRD [27]. Markers of arterial stiffness are also associated with progression of CKD [28]. In sum, our results suggest that in patients with CKD, repeated ABI measurements over time may provide clinically important information for understanding mortality risk beyond what is observed from ABI measured at a single time point. In particular, it is of interest to better understand the impact of increases in ABI over time among patients with CKD. The higher risk of mortality among individuals with larger increases in ABI could potentially be due to arterial stiffening (e.g. from medial arterial calcification) [10]; further work should explore potential reasons for this observation. Future research could also explore how joint changes in ABI and coronary artery calcium, a marker of atherosclerosis that strongly predicts mortality and risk of CVD [29], affect the risk of adverse outcomes.
This study has several limitations. Although we adjusted for many covariates, there is the potential for residual confounding. To address this limitation, models with sequentially added covariates were used. The main analysis calculated the average change in ABI during the first five visits (a period of 4 years) only, although results were similar when we calculated the average change in ABI over a longer period of time. By using the average change in ABI, we did not study the relationship between nonlinear changes in ABI and mortality risk. The clinical interpretation of the average change in ABI per year is currently unclear. However, this provides evidence for an association between the average annual change in ABI and all-cause mortality among patients with CKD and should be followed up with additional analyses in other prospective cohorts and for other adverse outcomes. Our study also has several strengths. We were able to adjust for many potential confounders, including demographic, lifestyle and other risk factors, some of which were measured repeatedly over time. Patterns were generally similar in sensitivity analyses when using different approaches to define exposures, when excluding individuals with high or low ABI, with CVD at baseline or restricting to those with diabetes at baseline.
In summary, we examined the change in ABI based on repeated ABI measurements over time and the risk of all-cause mortality in a large cohort of participants with CKD. We are the first to report that a larger increase in ABI per year is related to a higher risk of mortality among participants with CKD, a finding that should be explored in future research. If similar associations are observed in other populations, then this may potentially support the use of repeated ABI monitoring for risk stratification among high-risk populations.
SUPPLEMENTARY DATA
Supplementary data are available at ndt online.
Supplementary Material
ACKNOWLEDGEMENTS
The authors thank the participants, investigators and staff of the CRIC Study for their time and commitment.
FUNDING
Funding for the CRIC Study was obtained under a cooperative agreement from the National Institute of Diabetes and Digestive and Kidney Diseases (grants U01DK060990, U01DK060984, U01DK061022, U01DK061021, U01DK061028, U01DK060980, U01DK060963 and U01DK060902). In addition, this work was supported in part by Perelman School of Medicine at the University of Pennsylvania Clinical and Translational Science award National Institutes of Health (NIH)/National Center for Advancing Translational Sciences (NCATS) UL1TR000003, Johns Hopkins University grant UL1 TR-000424, the University of Maryland General Clinical Research Center grant M01 RR-16500, the Clinical and Translational Science Collaborative of Cleveland grant UL1TR000439 from the NCATS component of the NIH and NIH Roadmap for Medical Research, Michigan Institute for Clinical and Health Research grant UL1TR000433, the University of Illinois at Chicago Clinical and Translational Science Award grant UL1RR029879, Tulane Center of Biomedical Research Excellence for Clinical and Translational Research in Cardiometabolic Diseases grant P20GM109036 and Kaiser Permanente NIH/National Center for Research Resources University of California San Francisco Clinical and Translational Science Institute grant UL1 RR-024131. None of the funders of this study had any role in the current study design; collection, analysis and interpretation of data; writing the report or the decision to submit the report for publication.
AUTHORS’ CONTRIBUTIONS
K.S.D., H.H., J.C. and J.H. designed the study and interpreted the data. A.S.G., L.L.H., M.R. and J.H. collected the data. K.S.D. and H.H. conducted statistical analyses. K.S.D. made the figures. K.S.D., H.H., J.C., M.D., B.G.J., R.C.M., M.R., A.C.R., S.E.R., A.S. and J.H. drafted and/or revised the article. Each author contributed important intellectual content during manuscript drafting or revision.
CONFLICT OF INTEREST STATEMENT
M.D. reports consultant fees from Relypsa and Tricida. R.M. reports personal fees from Akebia/Otsuka and has interest in Abbot Laboratories, AbbVie and Teva Pharmaceuticals. M.R. reports grants from Bayer and the Duke Clinical Research Institute and personal fees from Relypsa and Reata. A.S. reports personal fees from CVS Caremark, AstraZeneca and Horizon Pharma. The results presented in this article have not been published previously in whole or part, except in abstract format.
DATA AVAILABILITY STATEMENT
The data underlying this article cannot be shared publicly to protect the privacy of the individuals who participated in the study.
REFERENCES
- 1.Gansevoort RT, Correa-Rotter R, Hemmelgarn BR et al. Chronic kidney disease and cardiovascular risk: epidemiology, mechanisms, and prevention. Lancet 2013; 382: 339–352 [DOI] [PubMed] [Google Scholar]
- 2. Go AS, Chertow GM, Fan D, et al. Chronic kidney disease and the risks of death, cardiovascular events, and hospitalization. N Engl J Med 2004; 351: 1296–1305 [DOI] [PubMed] [Google Scholar]
- 3. O’Hare AM, Glidden DV, Fox CS, et al. High prevalence of peripheral arterial disease in persons with renal insufficiency: results from the national health and nutrition examination survey 1999. Circulation 2004; 109: 320–323 [DOI] [PubMed] [Google Scholar]
- 4. Ix JH, Katz R, De Boer IHet al. Association of chronic kidney disease with the spectrum of ankle brachial index: the Cardiovascular Health Study . J Am Coll Cardiol 2009; 54: 1176–1184 [DOI] [PMC free article] [PubMed] [Google Scholar]
- 5. Ankle Brachial Index Collaboration, Fowkes FGR, Murray GD, et al. ; Ankle brachial index combined with framingham risk score to predict cardiovascular events and mortality. JAMA 2008; 300: 197–208 [DOI] [PMC free article] [PubMed] [Google Scholar]
- 6. Gu X, Man C, Zhang H, et al. High ankle-brachial index and risk of cardiovascular or all-cause mortality: a meta-analysis. Atherosclerosis 2019; 282: 29–36 [DOI] [PubMed] [Google Scholar]
- 7. Chen J, Mohler ER, Garimella PS, et al. Ankle brachial index and subsequent cardiovascular disease risk in patients with chronic kidney disease. J Am Heart Assoc 2016; 5: e003339 [DOI] [PMC free article] [PubMed] [Google Scholar]
- 8. Adragao T, Pires A, Branco P, et al. Ankle–brachial index, vascular calcifications and mortality in dialysis patients. Nephrol Dial Transplant 2012; 27: 318–325 [DOI] [PubMed] [Google Scholar]
- 9. Ono K, Tsuchida A, Kawai H, et al. Ankle-brachial blood pressure index predicts all-cause and cardiovascular mortality in hemodialysis patients. J Am Soc Nephrol 2003; 14: 1591–1598 [DOI] [PubMed] [Google Scholar]
- 10. Criqui MH, Ninomiya JK, Wingard DL, et al. Progression of peripheral arterial disease predicts cardiovascular disease morbidity and mortality. J Am Coll Cardiol 2008; 52: 1736–1742 [DOI] [PMC free article] [PubMed] [Google Scholar]
- 11. Kuwahara M, Hasumi S, Mandai S, et al. Rate of ankle-brachial index decline predicts cardiovascular mortality in hemodialysis patients. Ther Apher Dial 2014; 18: 9–18 [DOI] [PubMed] [Google Scholar]
- 12. Feringa HHH, Karagiannis SE, Schouten O, et al. Prognostic significance of declining ankle-brachial index values in patients with suspected or known peripheral arterial disease. Eur J Vasc Endovasc Surg 2007; 34: 206–213 [DOI] [PubMed] [Google Scholar]
- 13. Jiwakanon S, Adler S, Mehrotra R. Change in ankle-brachial index over time and mortality in diabetics with proteinuria. Clin Nephrol 2012; 78: 335–345 [DOI] [PMC free article] [PubMed] [Google Scholar]
- 14. Gerhard-Herman MD, Gornik HL, Barrett C, et al. 2016 AHA/ACC guideline on the management of patients with lower extremity peripheral artery disease: a report of the American College of Cardiology/American Heart Association Task Force on Clinical Practice Guidelines. Circulation 2017; 135: e726–e779 [DOI] [PMC free article] [PubMed]
- 15. Feldman HI. The Chronic Renal Insufficiency Cohort (CRIC) study: design and methods. J Am Soc Nephrol 2003; 14(7 Suppl 2): S148–S153 [DOI] [PubMed] [Google Scholar]
- 16. Lash JP, Go AS, Appel LJ, et al. Chronic Renal Insufficiency Cohort (CRIC) Study: baseline characteristics and associations with kidney function. Clin J Am Soc Nephrol 2009; 4: 1302–1311 [DOI] [PMC free article] [PubMed] [Google Scholar]
- 17. Hirsch AT, Haskal ZJ, Hertzer NR, et al. ACC/AHA 2005 guidelines for the management of patients with peripheral arterial disease (lower extremity, renal, mesenteric, and abdominal aortic): a collaborative report from the American Association for Vascular Surgery/Society for Vascular Surgery, Society for Cardiovascular Angiography and Interventions, Society for Vascular Medicine and Biology, Society of Interventional Radiology, and the ACC/AHA Task Force on Practice Guidelines (Writing Committee to Develop Guidelines for the Management of Patients With Peripheral Arterial Disease) endorsed by the American Association of Cardiovascular and Pulmonary Rehabilitation; National Heart, Lung, and Blood Institute; Society for Vascular Nursing; TransAtlantic Inter-Society Consensus; and Vascular Disease Foundation. J Am Coll Cardiol 2006; 47: 1239–1312 [DOI] [PubMed] [Google Scholar]
- 18. Coresh J, Turin TC, Matsushita K, et al. Decline in estimated glomerular filtration rate and subsequent risk of end-stage renal disease and mortality. JAMA 2014; 311: 2518–2531 [DOI] [PMC free article] [PubMed] [Google Scholar]
- 19. Kovesdy CP, Coresh J, Ballew SH, et al. Past decline versus current EGFR and subsequent ESRD risk. J Am Soc Nephrol 2016; 27: 2447–2455 [DOI] [PMC free article] [PubMed] [Google Scholar]
- 20. Durrleman S, Simon R. Flexible regression models with cubic splines. Stat Med 1989; 8: 551–561 [DOI] [PubMed] [Google Scholar]
- 21. Harrell FE. Regression Modeling Strategies : With Applications to Linear Models, Logistic Regression, and Survival Analysis. New York: Springer, 2001 [Google Scholar]
- 22. Hu FB, Stampfer MJ, Rimm E, et al. Dietary fat and coronary heart disease: a comparison of approaches for adjusting for total energy intake and modeling repeated dietary measurements. Am J Epidemiol 1999; 149: 531–540 [DOI] [PubMed] [Google Scholar]
- 23. Aboyans V, Criqui MH, Abraham P, et al. Measurement and interpretation of the ankle-brachial index: a scientific statement from the American Heart Association. Circulation 2012; 126: 2890–2909. [DOI] [PubMed] [Google Scholar]
- 24. Chen HY, Wei F, Wang LH, et al. Abnormal ankle-brachial index and risk of cardiovascular or all-cause mortality in patients with chronic kidney disease: a meta-analysis. J Nephrol 2017; 30: 493–501 [DOI] [PubMed] [Google Scholar]
- 25. Chen S-C, Chang J-M, Lu W-C, et al. Decrease in ankle-brachial index over time and cardiovascular outcomes in patients with hemodialysis. Am J Med Sci 2012; 344: 457–461 [DOI] [PubMed] [Google Scholar]
- 26. Demer LL, Tintut Y. Vascular calcification: pathobiology of a multifaceted disease. Circulation 2008; 117: 2938–2948 [DOI] [PMC free article] [PubMed] [Google Scholar]
- 27. Giachelli CM. The emerging role of phosphate in vascular calcification. Kidney Int 2009; 75: 890–897 [DOI] [PMC free article] [PubMed] [Google Scholar]
- 28. Mayer CC, Matschkal J, Sarafidis PA, et al. Association of ambulatory blood pressure with all-cause and cardiovascular mortality in hemodialysis patients: effects of heart failure and atrial fibrillation. J Am Soc Nephrol 2018; 29: 2409–2417 [DOI] [PMC free article] [PubMed] [Google Scholar]
- 29. Budoff MJ, Hokanson JE, Nasir K, et al. Progression of coronary artery calcium predicts all-cause mortality. JACC Cardiovasc Imaging 2010; 3: 1229–1236 [DOI] [PubMed] [Google Scholar]
Associated Data
This section collects any data citations, data availability statements, or supplementary materials included in this article.
Supplementary Materials
Data Availability Statement
The data underlying this article cannot be shared publicly to protect the privacy of the individuals who participated in the study.