

Abstract
Systemic acquired resistance (SAR) is a plant immune response established in uninfected leaves after colonization of local leaves with biotrophic or hemibiotrophic pathogens. The amino acid-derived metabolite N-hydroxypipecolic acid (NHP) travels from infected to systemic leaves, where it activates salicylic acid (SA) biosynthesis through the isochorismate pathway. The resulting increased SA levels are essential for induction of a large set of SAR marker genes and full SAR establishment. In this study, we show that pharmacological treatment of Arabidopsis thaliana with NHP induces a subset of SAR-related genes even in the SA induction-deficient2 (sid2/isochorismate synthase1) mutant, which is devoid of NHP-induced SA. NHP-mediated induction is abolished in sid2-1 NahG plants, in which basal SA levels are degraded. The SA receptor NON-EXPRESSOR OF PATHOGENESIS-RELATED GENES1 (NPR1) and its interacting TGACG SEQUENCE-SPECIFIC BINDING PROTEIN (TGA) transcription factors are required for the NHP-mediated induction of SAR genes at resting SA levels. Isothermal titration analysis determined a KD of 7.9 ± 0.5 µM for the SA/NPR1 complex, suggesting that basal levels of SA would not bind to NPR1 unless yet unknown potentially NHP-induced processes increase the affinity. Moreover, the nucleocytoplasmic protein PHYTOALEXIN DEFICIENT4 is required for a slight NHP-mediated increase in NPR1 protein levels and NHP-induced expression of SAR-related genes. Our experiments have unraveled that NHP requires basal SA and components of the SA signaling pathway to induce SAR genes. Still, the mechanism of NHP perception remains enigmatic.
The metabolite N-hydroxypipecolic acid (NHP) induces gene expression through a signaling cascade that requires only basal salicylic acid (SA) levels and the SA receptor NPR1.
Introduction
Plants have evolved cell surface and intracellular receptors that recognize invasion by pathogens and initiate signaling cascades resulting in the activation of defense responses (Dangl and Jones, 2001). Along with the establishment of local immunity, recognition of pathogens by plant cells results in the movement of mobile signals to the uninfected parts of the plant (Tian and Zhang, 2019; Kachroo and Kachroo, 2020). As shown in the model plant Arabidopsis thaliana, changes brought about by the mobile signals comprise transcriptional reprogramming (Bernsdorff et al., 2016), which leads to elevated levels of receptor kinases for pathogen recognition and downstream signaling components (Tateda et al., 2014), synthesis of latent signaling enzymes (Beckers et al., 2009), and opening of chromatin regions (Jaskiewicz et al., 2011; Baum et al., 2019). These and potentially other mechanisms lead to a heightened state of alertness against future attacks (Conrath et al., 2015). The state of being prepared for subsequent infections is termed priming, and the form of immunity is called systemic acquired resistance (SAR) (Durrant and Dong, 2004; Vlot et al., 2009; Spoel and Dong, 2012).
The phytohormone salicylic acid (SA) is a key player in the establishment of local as well as systemic resistance (Lawton et al., 1995). Pathogen infection results in the accumulation of SA (Delaney et al., 1995; Navarova et al., 2012), which binds to its receptor NON-EXPRESSOR OF PATHOGENESIS-RELATED GENES1 (NPR1) (Wu et al., 2012; Ding et al., 2018; Wang et al., 2020). NPR1 interacts with TGACG SEQUENCE-SPECIFIC BINDING PROTEIN (TGA) transcription factors (Zhang et al., 1999) and functions as a transcriptional co-activator leading to the induced expression of pathogenesis-related (PR) genes (Cao et al., 1997). SA also binds to other members of the NPR family—NPR3 and NPR4 (Fu et al., 2012; Ding et al., 2018; Wang et al., 2020). So far, two functions have been assigned to them: First, as parts of E3 ligase complexes, they serve as adaptor proteins mediating the degradation of NPR1 at basal or very high SA levels (Fu et al., 2012). Second, they act as SA-sensitive transcriptional repressors on the same promoters as NPR1 (Ding et al., 2018).
SA biosynthesis takes place via the phenylalanine ammonia-lyase (PAL) and the isochorismate (IC) pathways (Wildermuth et al., 2001). Analysis of the SA induction-deficient2 (sid2) mutant in A. thaliana has shown that the IC pathway is the prominent route leading to the accumulation of SA upon stress stimuli (Wildermuth et al., 2001; Bernsdorff et al., 2016). Conversion of chorismate to IC is catalyzed by ISOCHORISMATE SYNTHASE1 (ICS1), which is mutated in sid2. The IC formed in the chloroplast is transported to the cytosol where it is conjugated to glutamate by the enzyme AVRPPHB SUSCEPTIBLE3 (PBS3) resulting in the formation of isochorismate-9-glutamate, which is converted to SA spontaneously or via the enzyme ENHANCED PSEUDOMONAS SUSEPTIBILITY1 (Rekhter et al., 2019; Torrens-Spence et al., 2019).
The genes involved in the biosynthesis of SA are under the control of multiple transcription factors (Seyfferth and Tsuda, 2014). Of major importance are the calmodulin (CaM) binding transcription factor CaM BINDING PROTEIN 60g (CBP60g) and its homolog SAR DEFICIENT1 (SARD1), which bind to the promoters of ICS1 and PBS3 (Zhang et al., 2010; Wang et al., 2011; Sun et al., 2015). Transcript profiling placed the CBP60g/SARD1-regulated section of genes downstream of the ENHANCED DISEASE SUSCEPTIBILITY1 (EDS1)/PHYTOALEXIN DEFICIENT4 (PAD4) immune complex (Wang et al., 2011; Wagner et al., 2013), which is consistent with the importance of EDS1/PAD4 for SA biosynthesis (Zhou et al., 1998). Furthermore, the expression of SARD1/CBP60g is repressed by another set of CaM binding transcription factors, CaM BINDING TRANSCRIPTION ACTIVATOR1, 2, and 3 (CAMTA1, 2, and 3) (Kim et al., 2020). Depending on the inducing stimulus, transcription of SARD1 is positively regulated by different clades of TGA transcription factors and NPR1 (Sun et al., 2018; Budimir et al., 2020).
In addition to SA, N-hydroxypipecolic acid (NHP) is required for the activation of SAR (Chen et al., 2018; Hartmann et al., 2018). NHP biosynthesis starts with lysine, which is converted to pipecolic acid (Pip) by two sequential reactions catalyzed by AGD2-LIKE DEFENSE RESPONSE PROTEIN1 (ALD1) (Navarova et al., 2012) and SARD4 (Ding et al., 2016; Hartmann et al., 2017). Pip is further converted to NHP by FLAVIN-DEPENDENT MONOOXYGENASE1 (FMO1) (Hartmann and Zeier, 2018). NHP, which can be transported from local to systemic leaves (Mohnike et al., 2021), is essential for SA synthesis in systemic, but not in locally infected tissue (Bernsdorff et al., 2016). NHP is thus the prime candidate for serving as a direct mobile signal required for SAR in systemic leaves.
Several pieces of evidence suggest that NHP-dependent defense responses can be triggered in systemic leaves at basal SA levels. First, the sid2-1 mutant still shows a weak SAR, which is abolished in the sid2-1 ald1 double mutant (Bernsdorff et al., 2016). Second, exogenous treatment with either Pip or NHP partially rescued the susceptibility phenotype of sid2 (Navarova et al., 2012; Hartmann et al., 2018). NPR1 and PAD4 are candidate proteins to mediate this response since the respective mutants do not even show weak Pip-induced immunity (Navarova et al., 2012).
Here, we addressed the question, whether the SID2/ICS1-independent signaling cascade is directly activated by NHP and how candidate regulatory proteins are organized within the cascade. In order to exclude the amplifying effect of SA, we performed the analysis in appropriate combinations of the sid2 allele with mutants in other regulatory genes. Considering that only basal levels of SA are present in the sid2 mutant, it seems noteworthy that the SA receptor NPR1 and TGA transcription factors are still required for induction of marker genes after NHP treatment and in SAR experiments. Moreover, we show that EDS1 and PAD4 play distinct roles, with PAD4, but not EDS1, affecting NPR1 protein levels. Our study thus presents a working model which defines the pathway leading to NHP-regulated gene expression at basal SA levels.
Results
Induction of FMO1 during SAR requires NPR1 in the absence of pathogen-induced SA biosynthesis
To decipher the SID2/ICS1-independent signaling cascade that is primed in SAR leaves (Navarova et al., 2012; Hartmann et al., 2018), we monitored induction of the SAR-related marker genes FMO1 and PR1 in A. thaliana. Lower leaves (wild-type (Col-0), sid2-2, sid2-2 npr1-1, sid2-2 tga1 tga4, sid2-2 tga2 tga5 tga6) were treated with either 10 mM MgCl2 or inoculated with the hemibiotrophic pathogen Pseudomonas syringae pv. maculicola ES4326 (Psm) (Mishina and Zeier, 2006). Two days after the treatment, three upper leaves were infiltrated with Psm. These leaves were harvested at 8-h post-infection (hpi) for transcript analysis. In mock pre-treated plants (mock-Psm), Psm-induced expression of FMO1 and PR1 was reduced in sid2-2 as compared to wild-type (Figure 1A). In contrast, Psm pre-treatment led to even higher FMO1 expression in Psm-infected systemic sid2-2 leaves (Psm–Psm) as compared to Col-0, an observation that had been previously described with genetic evidence showing that the Pip biosynthesis pathway is responsible for this induction (Bernsdorff et al., 2016). In contrast, PR1 expression was severely compromised. Since full SAR establishment depends on the SA receptor NPR1 (Wang et al., 2006), we were interested whether NPR1 and its interacting TGA transcription factors might be involved in FMO1 induction in the absence of increased SA levels. Therefore, the npr1-1 and different tga alleles were crossed into the sid2-2 background. Strikingly, FMO1 induction was completely abolished in the sid2-2 npr1-1 double mutant. Likewise, NPR1-interacting TGAs were equally required for induction of FMO1 and PR1, independent of whether they belong to clade-I (TGA1, TGA4) or clade-II (TGA2, TGA5, TGA6) (Figure 1A). This regulatory pattern was also observed for ALD1, which is involved in the synthesis of the NHP precursor Pip (Supplemental Figure S1). Although differences were not as pronounced, other transcripts involved in NHP (SARD4) and SA (PBS3, EDS5) synthesis were induced in sid2-2 and this induction was abolished when NPR1 or TGAs were missing (Supplemental Figure S1). It is concluded that a mobile signal originating from the Psm-infected primary leaves renders the signaling cascade that activates ALD1 and FMO1 from SID2/ICS1-dependent to SID2/ICS1-independent. The priming effect, i.e. the higher responsiveness of ALD1 and FMO1 expression in Psm challenged SAR leaves (Psm–Psm) as compared, so Psm-infected naïve plants (mock-Psm), is more pronounced in sid2 than in Col-0 wild-type plants.
Figure 1.

Induction of FMO1 during SAR is SID2/ICS1-independent but NPR1-dependent. A, Real time quantitative polymerase chain reaction (RT-qPCR) analysis of FMO1 and PR1 transcript levels in wild-type (Col-0), sid2-2 (s), sid2-2 npr1-1 (sn), sid2-2 tga1 tga4 (s14), and sid2-2 tga2 tga5 tga6 (s256) plants. Three leaves of 4.5-week-old soil-grown plants were infiltrated with either 10 mM MgCl2 (mock) or P. syringae pv. maculicola ES4326 (Psm). Two days later, three systemic leaves were infiltrated with Psm and this tissue was harvested at 8 h after infiltration. The insert displays low PR1 expression levels of the various genotypes in the sid2 background. B, RT-qPCR analysis of NPR1 transcript levels (upper) and NPR1 protein abundance (lower) in Col-0 and sid2-2 plants. Immunoblotting analysis was performed using an αNPR1 antiserum. The membrane stained with Coomassie Brilliant Blue (CBB) is used as a loading control. Transcript levels were normalized to the levels of UBQ5. Bars represent the average ± sem (standard error of mean) of three biological replicates, each replicate comprising six leaves pooled from six different plants. Statistical analysis was performed using a two-way analysis of variance (ANOVA) followed by Bonferroni’s multiple comparison test. Lowercase letters indicate significant differences (P < 0.05) between the treatments for each individual genotype; uppercase letters indicate significant differences (P < 0.05) between the genotypes subjected to the same treatment. NS represents no significant difference between either the treatments or between the genotypes.
As mentioned above, expression of the classical SA marker gene PR1 was severely compromised in sid2-2. Notably, when disregarding the high level of PR1 transcription in wild-type plants, an inspection of residual PR1 transcript levels in sid2-2 revealed that the priming effect of Psm pre-treatment also affected PR1 and that it depended on NPR1 and TGAs (Figure 1A, insert). However, due to the strong amplifying effect of SA on the PR1 promoter, this SID2/ICS1-independent induction is easily overlooked.
It is well established that increasing SA levels lead to a stabilization of NPR1 (Fu et al., 2012). As expected, NPR1 accumulated upon Psm infections in wild-type plants (Figure 1B), with the highest protein levels observed in Psm-infected SAR leaves (Psm–Psm). NPR1 protein and—to a lesser extent—NPR1 transcript levels were lower in the sid2-2 mutant. Still, the stabilization of NPR1 upon Psm infections followed the same pattern as in Col-0 wild-type plants.
Induction of FMO1 upon NHP treatment requires NPR1 in the absence of NHP-induced SA biosynthesis
Since priming of FMO1 expression in Psm-infected SAR leaves is abolished in the NHP-deficient sid2-1 ald1 mutant (Bernsdorff et al., 2016), and since pharmacological treatment with either Pip or NHP was shown to induce defense responses including transcriptional activation of SAR marker genes (Chen et al., 2018; Hartmann et al., 2018), we questioned whether NHP is sufficient to induce the SID2/ICS1-independent pathway. NHP was synthesized according to Chen et al. (2018) with a modification of the Cope elimination step leading to a preparation with lower amounts of contaminants due to reduced NHP decomposition (Supplemental Figure S2). Wild-type and sid2-2 plants were infiltrated with 10 mM MgCl2 (mock) or 1 mM NHP dissolved in MgCl2 and leaves were collected after 48 h. Indeed, NHP treatment led to the induction of FMO1 expression sid2-2 and this expression was strongly compromised in sid2-2 npr1-1 (Figure 2A). In this and further independent experiments, FMO1 expression levels in sid2 were similar to those detected in wild-type plants. Still, other experiments showed differences between wild-type and sid2 (Supplemental Figure S3A). ICS1 transcript levels were induced upon NHP treatment (Supplemental Figure S3B), and PR1 expression was strongly reduced in sid2-2 (Supplemental Figure S3A), indicating that NHP-induced SA synthesis is required for maximal PR1 expression.
Figure 2.

Induction of SAR by NHP treatment coincides with increased gene expression and increased NPR1 protein amounts in local and distal leaves. A, C, and E, RT-qPCR analysis of FMO1 and NPR1 transcript levels in wild-type (Col-0), sid2-2, and sid2-2 npr1-1 plants. Three leaves of 4.5-week-old soil-grown plants were infiltrated with either 10 mM MgCl2 (mock) or 1 mM NHP in 10 mM MgCl2. Infiltrated local (A and E) and untreated systemic leaves (C and E) were harvested at 48 hpi. Transcript levels were normalized to the levels of UBQ5. Bars represent the average ± sem of three (A) or three to six (C and E) biological replicates, each replicate comprising three leaves from one plant. B, Assessment of bacterial growth in wild-type (Col-0), sid2-2, and sid2-2 npr1-1 plants after NHP treatment. Three leaves of 4.5-week-old soil-grown plants were infiltrated with either 10 mM MgCl2 (mock) or 1 mM NHP in 10 mM MgCl2. One day later, three systemic leaves were infiltrated with P. syringae pv. maculicola ES4326 (Psm) (optical density (OD)0.001). The bacterial titer was determined 2 d post-inoculation. Bars represent the average ± sem of the colony-forming units (CFU)/cm2 from three (Col-0) or four biological (sid2-2 and sid2-2 npr1) replicates, each replicate comprising nine leaf discs collected from the inoculated leaves of one plant. D, Immunoblot analysis of NPR1 protein abundance in wild-type (Col-0) and sid2-2 plants. NHP treatment was done as described for A, C, and E. Immunoblotting was performed using an αNPR1 antiserum. The PVDF membrane stained with Coomassie Brilliant Blue (CBB) is used as a loading control. All samples were loaded on the same gel. Statistical analysis was performed using a two-way ANOVA followed by Bonferroni’s multiple comparison test. Lowercase letters indicate significant differences (P < 0.05) between the treatments for each individual genotype; uppercase letters indicate significant differences (P < 0.05) between the genotypes subjected to the same treatment.
To relate NHP-mediated NPR1-dependent defense gene activation in sid2 plants to SAR, we performed Psm growth assays (Figure 2B). Three lower leaves of Col-0, sid2-2, and sid2-2 npr1 plants were infiltrated with either 10 mM MgCl2 (mock) or 1 mM NHP. After 24 h, systemic leaves were infiltrated with Psm and bacterial growth was assayed 2 d later. In line with previous studies (Chen et al., 2018; Hartmann et al., 2018), we observed that Col-0 plants pre-treated with NHP supported lower levels of Psm growth as compared to mock-treated plants (Figure 2B). Consistent with very recent results obtained with a bioluminescent Psm strain (Psm lux) (Yildiz et al., 2021), the sid2-2 mutant showed a moderate but still detectable SAR when pretreated with NHP. However, no effect of NHP was observed in sid2-2 npr1-1 plants. This pattern is consistent with FMO1 expression which was induced in systemic leaves of sid2-2 but not of sid2-2 npr1 (Figure 2C).
NPR1 protein levels in wild-type plants increased upon NHP infiltration both in local and systemic leaves (Figure 2D). This increase was not reflected at the transcript level (Figure 2E), suggesting stabilization of the protein in the presence of NHP-induced SA. NPR1 protein levels were lower in sid2-2, but a slight NHP-induced increase was detected, revealing the same tendency as observed above after Psm infections (Fig. 1B).
We next infiltrated sid2-2, sid2-2 npr1-1, sid2-2 tga1 tga4, and sid2-2 tga2 tga5 tga6 mutants with either 10 mM MgCl2 or NHP. The induction of FMO1, ALD1, and PBS3 seen in sid2-2 was decreased in the absence of NPR1, clade-I, or clade-II TGA transcription factors (Figure 3). Low-level PR1 induction was observed again. For PR1, induction required NPR1 and clade-I but not clade-II TGAs. In summary, NHP induces the expression of selected genes in a manner that requires the SA receptor NPR1 and its interacting TGA factors in the absence of NHP-mediated activation of the SA biosynthesis enzyme ICS1.
Figure 3.

Induction of SAR-related genes by NHP treatment is SID2/ICS1-independent but NPR1- and TGA-dependent. RT-qPCR analysis of FMO1, PR1, ALD1 and PBS3 transcript levels in sid2-2, sid2-2 npr1, sid2-2 tga1 tga4 and sid2-2 tga2 tga5 tga6 plants. Three leaves of 4.5-week-old soil-grown plants were infiltrated with either 10 mM MgCl2 (mock) or 1 mM NHP in 10 mM MgCl2 and the same tissue was harvested at 48 h after infiltration. Transcript levels were normalized to the levels of UBQ5. Bars represent the average ± sem of three to six biological replicates, each replicate comprising three leaves from one plant. Statistical analysis was performed using a two-way ANOVA followed by Bonferroni’s multiple comparison test. Lowercase letters indicate significant differences (P < 0.05) between mock and NHP treatments for each individual genotype; uppercase letters indicate significant differences (P < 0.05) between the genotypes subjected to the same treatment.
Induction of FMO1 during SAR and upon NHP treatment requires basal SA levels
To address the role of basal SA levels, which are generated by the PAL pathway, we employed sid2-1 NahG plants in which residual basal SA is enzymatically degraded to catechol (Bauer et al., 2021). In mock pretreated plants (mock-Psm) and in Psm-pre-treated plants (Psm–Psm), Psm-induced expression of FMO1 in sid1-2 NahG was severely reduced as compared to wild-type and sid2-1 (Figure 4A). Consistently, NHP-induced FMO1 expression was also compromised (Figure 4B). Hence, basal levels of SA are required for NHP-mediated induction.
Figure 4.
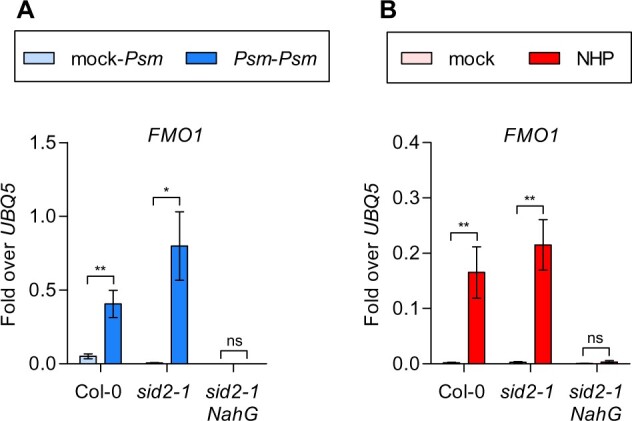
Basal levels of SA are required for NHP-mediated FMO1 induction. RT-qPCR analysis of FMO1 transcript levels in wild-type (Col-0), sid2-1 and sid2-1 NahG plants. A, Three leaves of 4.5-week-old soil-grown plants were infiltrated with either 10 mM MgCl2 (mock) or P. syringae pv. maculicola ES4326 (Psm). Two days later, three systemic leaves were infiltrated with Psm and this tissue was harvested 8 h after infiltration. B, Three leaves of 4.5-week-old soil-grown plants were infiltrated with either 10 mM MgCl2 (mock) or 1 mM NHP in 10 mM MgCl2 and this tissue was harvested at 48 h after infiltration. Transcript levels were normalized to the levels of UBQ5. Bars represent the average ± sem of four to six biological replicates, each replicate comprising three leaves from one plant. Statistical analysis was performed using an unpaired two-tailed t test, where each genotype was analyzed independently. Asterisks denote statistical significance (*P < 0.05; **P < 0.01; ***P < 0.001; ****P < 0.0001; NS, not significant).
Next, we analyzed the npr1-1 mutant complemented with NPR1 carrying an arginine to glutamine exchange at position 432 (R432Q) (Ding et al., 2018). With insights from the crystal structure of the NPR4–SA complex (Wang et al., 2020), R432 in NPR1 is predicted to form a hydrogen bond with the carboxyl group of SA which explains that NPR1 R432Q cannot bind SA. In both, SAR experiments as well as upon pharmacological treatments, we observed induction of FMO1 and PR1 in wild-type plants as well as in npr1-1 complemented with wild-type NPR1 (Supplemental Figure S4, A and B). However, plants complemented with the R432Q variant did not show FMO1 and PR1 induction, similar to npr1-1. Together with the results obtained with the sid2-1 NahG plants, this dataset supports the hypothesis that NPR1 most likely has to bind basal SA for in vivo functionality.
NPR1 binds to SA with a KD of 7.9 ± 0.5 µM
According to the current working models, NPR1 is activated when SA accumulates under stress conditions or upon pharmacological treatment. The requirement of basal SA levels for induction of FMO1 suggests that NPR1 might bind to SA even at basal levels, which are estimated to amount to 1.4 µM (Kong et al., 2016). To address whether NPR1 is likely to be bound constitutively to SA in vivo, we aimed to determine the dissociation constant using isothermal titration calorimetry (ITC) assays (Perozzo et al., 2004). Recombinant NPR1 protein was expressed in insect cells as a fusion with a Strep-tagged maltose-binding protein (MBP). Affinity purification of Strep-MBP-NPR1 was performed using a dextrin sepharose column. When SA was injected into cells containing Strep-MBP-NPR1, considerable heat changes were observed (Figure 5A). Assuming one SA binding site per NPR1 monomer, we calculated that 10%–14% of the protein (depending on the preparation) was able to bind SA under our experimental conditions. This is a higher fraction as compared to that obtained with NPR1 expressed in Escherichia coli. Here, only 0.02% of NPR1 could bind SA (Ding et al., 2018; Wang et al., 2020). The binding constant according to ITC analysis was calculated to be 7.9 ± 0.5 µM. It is concluded that NPR1 does not bind basal SA levels in vivo, unless its affinity towards SA is increased by potentially NHP-mediated processes. Given the structural similarity between SA and NHP (Supplemental Figure S5), we questioned whether NHP might bind to NPR1, but no interaction between NHP and NPR1 was detected (Figure 5B).
Figure 5.

NPR1 does not bind NHP under conditions that allow SA binding. ITC data were obtained after titration of (A) SA and (B) NHP with ∼36 μM Strep-MBP-NPR1. For SA binding, the NPR1 concentration was adjusted to 5 μM corresponding to an active fraction that was estimated by the initial fitting of the data assuming a stoichiometry of 1. The upper panels show the raw ITC thermograms. The bottom panels represent fitting curves obtained after subtraction of the heat changes from a titration experiment without Strep-MBP-NPR1. Molar ratios reflect the ratios of ligands over the active protein. Three independent replicates were used to calculate the dissociation constant (KD = 7.9 ± 0.5 μM) for the NPR1-SA interaction. No adjustments were done for NHP binding.
SARD1 is induced by NHP in sid2
One of the key proteins required for SAR is transcription factor SYSTEMIC ACQUIRED RESISTANCE1 (SARD1), which is required for FMO1 induction after pathogen infections (Sun et al., 2015; Sun et al., 2018). The SARD1 promoter contains a TGACGTCA palindrome at position −300 bp with respect to the translational start site, which can be bound in protoplasts by ectopically expressed clade-I TGAs (Sun et al., 2018) and in planta by clade-II TGAs (Ding et al., 2018). Indeed, SARD1 induction was observed as early as 8 h after infiltration of NHP into sid2-2 leaves and its expression decreased at the 48-h time point (Figure 6A). In contrast, FMO1 induction was not yet observed at 8 h. Induction of SARD1 was absent in the sid2-2 npr1-1 mutant at both time points (Figure 6A). Like FMO1, the expression of SARD1 in sid2-2 also depends on clades I and II TGA transcription factors (Figure 6B). Thus, SARD1 is a likely direct target gene of the NPR1/TGA complex even in the absence of SID2-derived SA.
Figure 6.

NHP leads to NPR1- and TGA-dependent induction of SARD1. A, RT-qPCR analysis of SARD1 and FMO1 in sid2-2 and sid2-2 npr1-1 plants. Three leaves of 4.5-week-old soil-grown plants were infiltrated with either 10 mM MgCl2 (mock) or 1 mM NHP and the same tissue was harvested at either 8 h or 48 h after infiltration. B and C, RT-qPCR analysis of SARD1 in (B) sid2-2, sid2-2 npr1-1, sid2-2 tga1 tga4 and sid2-2 tga2 tga5 tga6; and FMO1 in (C) wild-type (Col-0) and sard1-1 cbp60g-1 plants. Three leaves of 4.5-week-old soil-grown plants were infiltrated with either 10 mM MgCl2 (mock) or 1 mM NHP in 10 mM MgCl2 and the same tissue was harvested at 48 h after infiltration. Transcript levels were normalized to the levels of UBQ5. Bars represent the average ± sem of three to six (A), five to six (B) and seven to eight (C) biological replicates, each replicate comprising three leaves from one plant. Statistical analysis was performed independently for the two-time points using a two-way ANOVA followed by Bonferroni’s multiple comparison test for (A) and an overall two-way ANOVA followed by Bonferroni’s test was used for (B) and (C). Lowercase letters indicate significant differences (P < 0.05) between the treatments for each individual genotype; uppercase letters indicate significant differences (P < 0.05) between the genotypes subjected to the same treatment.
To test whether SARD1 is required for FMO1 induction after NHP treatment, we performed pharmacological experiments with the sard1-1 cbp60g-1 mutant, which—in addition to the sard1 allele—contains a mutation in the partially redundant CBP60g gene (Zhang et al., 2010; Wang et al., 2011). NHP-induced levels of FMO1 were lower in the sard1-1 cbp60g-1 mutant compared to wild-type plants (Figure 6C). This dataset suggests that SARD1/CBP60g amplifies the response to NHP. However, since ICS1 is slightly activated in sard1-1 cbp60g-1 (Supplemental Figure S6), we cannot exclude some amplifying effect of SA on the NHP-induced FMO1 promoter which is sometimes observed when comparing Col-0 with sid2-2 (Supplemental Figure S3). Since SARD1 and ICS1 are located close to each other on chromosome 1, the more conclusive sid2-2 sard1-1 cbp60g-1 triple mutant has not been obtained yet.
The FMO1 promoter contains a TGACG motif at position −1707-bp upstream of the translational start site (Supplemental Figure S7A). At least in untreated seedlings, TGA2 does not bind in vivo to this motif (Liu et al., 2020). To address the importance of the TGACG motif in the context of NHP-induced processes, the sequence was mutated to TGAACG after CRISPR–Cas-mediated genome editing. Induction of FMO1 in SAR experiments as well as upon pharmacological treatment with NHP was similar to that of wild-type plants (Supplemental Figure S7, B and C). Our data suggest that FMO1 is most likely not a direct target of the NPR1/TGA module, but that is rather activated by TGA/NPR1-regulated transcription factors, a candidate being SARD1.
NPR1 activity is not only regulated at the level of SA-mediated protein stabilization (Fu et al., 2012) and SA binding (Ding et al., 2018), but also by the reduction of critical cysteines after an SA-mediated redox shift of the cytosol (Mou et al., 2003). Upon 8 h after NHP treatment, no effect on glutathione levels and the glutathione redox state was detected in either Col-0 or sid2-2 plants (Supplemental Figure S8). It seems likely that NHP-mediated NPR1-dependent induction of SARD1 at 8 h does not involve a similar mechanism to the one described for SA-triggered activation of NPR1.
PAD4 but not EDS1 is required for maintaining NPR1 protein levels in sid2
Next, we addressed the role of the immune regulators EDS1 and PAD4 in NHP-mediated signaling. Previous studies have shown that EDS1 and PAD4 are essential for the regulation of FMO1 after pathogen infection (Bartsch et al., 2006). Indeed, induction of FMO1 in NHP-treated sid2 plants was hampered in the absence of EDS1 and PAD4, with the response looking similar to the one observed in sid2-2 npr1-1 (Figure 7A). Induction of SARD1 was also lost in the sid2-2 pad4-1 mutant, while the effect of the eds1-2 allele in sid2-1 was less pronounced. The expression pattern of the SA hydroxylase DOWNY MILDEW-RESISTANT 6-LIKE OXYGENASE1 (DLO1), which is a SARD1-regulated gene (Budimir et al., 2020), follows the expression pattern of SARD1. In contrast, PBS3 and ALD1 were—like FMO1—stringently regulated by EDS1 (Supplemental Figure S9). Moreover, induction of NPR1 by NHP was slightly more affected in sid2-2 pad4-1 than in sid2 or sid2-1 eds1-2 (Figure 7B). Western blot analysis revealed that NPR1 protein levels were lower in sid2-2 pad4-1 as compared to sid2-2. In contrast, sid2-1 and sid2-1 eds1-2 showed similar protein levels. Hence, with respect to maintaining a certain threshold of NPR1, PAD4 seems to be of major importance.
Figure 7.

PAD4 is required for the maintenance of NPR1 protein levels in sid2. A, RT-qPCR analysis of FMO1, SARD1 and DLO1 transcript levels in sid2-2, sid2-2 npr1-1, sid2-2 pad4-1, sid2-1 and sid2-1 eds1-2 plants. Three leaves of 4.5-week-old soil-grown plants were infiltrated with either 10 mM MgCl2 (mock) or 1 mM NHP in 10 mM MgCl2. This tissue was harvested 48 h after infiltration. B, RT-qPCR analysis of NPR1 transcript levels (upper) and NPR1 protein abundance (lower) in wild-type (Col-0), sid2-1, sid2-1 eds1-2, sid2-2, and sid2-2 pad4-1 plants. Transcript levels were normalized to the levels of UBQ5. Bars represent the average ± sem of three (A) or three to five (B) biological replicates, each replicate comprising (A) six leaves pooled from six individual plants, or (B) three leaves from one plant. Statistical analysis was performed using a two-way ANOVA followed by Bonferroni’s multiple comparison test. In A, samples with the sid2-2 genotype were tested separately from the plants with the sid2-1 genotype. Lowercase letters indicate significant differences (P < 0.05) between mock and NHP treatment for each individual genotype; uppercase letters indicate significant differences (P < 0.05) between the genotypes subjected to the same treatment. Immunoblotting analysis was performed using an aNPR1 antiserum. The membrane stained with Coomassie Brilliant Blue (CBB) is used as a loading control. Both mock- and NHP-treated samples are part of a single blot.
The positive effect of PAD4 on NPR1 protein levels in sid2-2 led us to investigate whether PAD4 and NPR1 might interact potentially in an NHP-dependent manner. Yeast two-hybrid analysis confirmed the previously published interactions between EDS1 and NPR1 or PAD4 (Feys et al., 2001; Zavaliev et al., 2020). However, no interaction between PAD4 and NPR1 was detected. This was not altered upon addition of either SA or NHP (Supplemental Fig. S10).
Our results place PAD4 upstream of NPR1. However, NPR1 and TGAs also act as positive regulators of EDS1 and PAD4 transcription as revealed by the analysis of sid2-2 npr1-1, sid2-2 tga1 tga4, and sid2-2 tga2 tga5 tga6. As shown in Figure 8A, EDS1 and PAD4 were induced by NHP in the absence of SID2/ICS1 and this induction was lost in the absence of NPR1. As previously reported for activation of FMO1 by the chemical Thaxtomin A (Joglekar et al., 2018), expression of EDS1 required PAD4, while activation of PAD4 was not as strongly impaired in eds1-2 (Figure 8B). This result puts PAD4 into a central position in NHP signaling. Still, the PAD4 promoter does not contain a TGA binding site. SARD1/CBP60g is unlikely to be the NPR1/TGA-dependent master regulator, as revealed by wild-type-like induction of EDS1 and PAD4 in the sard1-1 cbp60g-1 double mutant (Figure 8C). This is different from what has been observed after Psm infections (Sun et al., 2015).
Figure 8.

NHP-induced EDS1 and PAD4 expression is NPR1- and TGA-dependent but SARD1/CBP60g-independent. RT-qPCR analysis of EDS1 and PAD4 transcript levels in (A) sid2-2, sid2-2 npr1-1, sid2-2 tga1 tga4, sid2-2 tga2 tga5 tga6; (B) sid2-1, sid2-1 eds1-2, sid2-2, sid2-2 pad4-1; and (C) wild-type (Col-0) and sard1-1 cbp60g-1 plants. Three leaves of 4.5-week-old soil-grown plants were infiltrated with either 10 mM MgCl2 (mock) or 1 mM NHP in 10 mM MgCl2. This tissue was harvested 48 h after infiltration. Transcript levels were normalized to the levels of UBQ5. Bars represent the average ± sem of four to six (A), three to five (B), or seven to eight (C) biological replicates, each replicate comprising three leaves from one plant. Statistical analysis was performed using a two-way ANOVA followed by Bonferroni’s multiple comparison test. Lowercase letters indicate significant differences (P < 0.05) between mock and NHP treatment for each individual genotype; uppercase letters indicate significant differences (P < 0.05) between the genotypes subjected to the same treatment.
NHP primes FMO1 expression in response to Pseudomonas infections
Finally, we tested whether NHP can prime Psm-induced FMO1 expression at basal SA levels. In general, priming stimuli establish an alert state of the tissue making it more responsive to a second challenge stimulus (Mauch-Mani et al., 2017). As described before (Bernsdorff et al., 2016) and as displayed in Figure 1, Psm infections of local leaves prime Psm-induced FMO1 expression in distal leaves even in the absence of elevated SA levels. In order to test whether NHP can also prime for enhanced FMO1 expression after a Psm challenge inoculation, we infiltrated NHP or MgCl2 into sid2-1 and sid2-1 ald1 leaves, and the same leaves were infiltrated after 24 h with Psm. Leaves were collected after 8 h, id est at 32 h after the onset of the experiment. Upon mock pre-infiltration, Psm-induced FMO1 expression was low, but upon NHP pre-treatment, Psm-induced FMO1 expression increased by a factor of 100 (Figure 9). In contrast, exposure of plants to NHP for 32 h did not lead to any significant induction of FMO1. The same pattern was observed in sid2-1 ald1, indicating that exogenously applied NHP is effective even in the absence of its endogenous synthesis. PR1 transcript levels remained low in the absence of the SA amplification loop and the influence of the NHP-treatment on Psm-induced gene expression was much less pronounced as in the case of FMO1.
Figure 9.
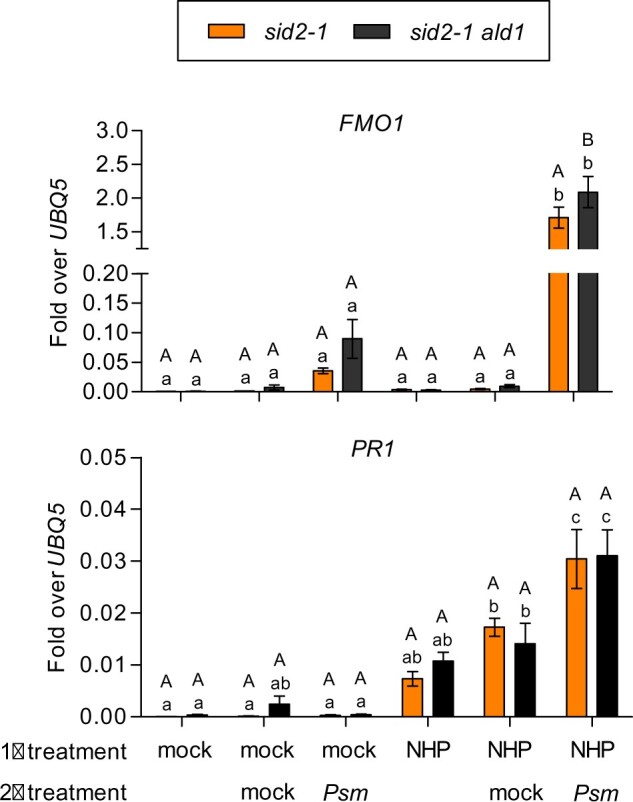
FMO1 but not PR1 is primed by NHP at basal SA levels. RT-qPCR analysis of FMO1 and PR1 transcript levels in sid2-1 and sid2-1 ald1 plants. Three leaves of 4.5-week-old soil-grown plants were infiltrated with either 10 mM MgCl2 (mock) or 1 mM NHP in 10 mM MgCl2 (1° treatment). After 24 h, the same leaves were infiltrated with either 10 mM MgCl2 (mock) or P. syringae pv. maculicola ES4326 (Psm) (2° treatment). This tissue was harvested 8 h after infiltration. Transcript levels were normalized to the levels of UBQ5. Bars represent the average ± sem of five to six biological replicates, each replicate comprising three leaves from one plant. Statistical analysis was performed using a two-way ANOVA followed by Bonferroni’s multiple comparison test. Lowercase letters indicate significant differences (P < 0.05) between the treatments for respective genotypes; uppercase letters indicate significant differences (P < 0.05) between sid2-1 and sid2-1 ald1.
Discussion
The two plant signaling molecules SA and NHP are required for SAR establishment (Lawton et al., 1995; Hartmann et al., 2018). Here we report that the SA receptor NPR1 and interacting TGA transcription factors are required for NHP-mediated activation of gene expression at basal SA levels. Moreover, we show that PAD4 but not EDS1 is instrumental for maintaining sufficient NPR1 protein levels in sid2. This analysis establishes a core signaling pathway that puts NPR1 and PAD4 close to the NHP perception mechanism.
SID2/ICS1-independent but NPR1-dependent gene expression has been observed before in camta123 plants
Our gene expression data, i.e. induction of selected SAR genes in sid2, are in good agreement with results obtained with plants mutated in the three partially redundant transcription factors CAMTA1, 2, and 3 (Kim et al., 2020). In the camta123 mutant, levels of SA, Pip, and most likely NHP are highly elevated and 1,113 genes are more strongly expressed than in wild-type plants. In camta123 sid2-1 plants, SA levels were reverted to background, while Pip and presumably NHP and 45 transcripts (e.g. FMO1, ALD1, SARD1, CBP60g, PAD4, and EDS1) remained elevated. Expression of these genes was severely reduced in the camta123 sid2-1 fmo1 mutant, supporting the idea that NHP is important for gene induction at basal SA levels. Similar to our results obtained with NHP-treated sid2-2 and sid2-2 npr1-1 plants, expression of selected genes was reduced in camta123 sid2-1 npr1-1. Thus, permanent activation of NHP synthesis, as well as chemical treatment with NHP, induces genes like FMO1, ALD1, SARD1, PAD4, and EDS1 in an NPR1-dependent manner at basal SA levels. Moreover, the authors demonstrated that camta123 sid2-1 but not camta123 sid2-1 fmo1 plants were more responsive to treatment with suboptimal amounts of SA (200 µM) than wild-type plants. This experiment shows that NHP primes plants to become more responsive to SA.
Albeit transcript analysis of FMO1, ALD1, SARD1, PAD4, and EDS1 after NHP treatment corresponded well with those using camta123 plants, we obtained slightly different results with respect to NPR1 protein amounts. Notably, camta123 and camta123 sid2-1 plants were similar with respect to their elevated NPR1 protein levels as compared to wild-type plants (Kim et al., 2020). Therefore, it was postulated that higher amounts of Pip/NHP lead to higher amounts of NPR1, which would explain Pip/NHP-induced and SA-hyper-induced transcript levels of FMO1 and other genes in both genotypes. Since elevated NPR1 protein levels were only detected in the cytosol but not in the nucleus, it was speculated that cytosolic NPR1 might be involved in NHP perception.
In our hands, NPR1 protein levels were lower in sid2 than in wild-type plants, but a slight increase was observed upon NHP treatment (Figures 2, D and 7, B). It is known that NPR1 is degraded in a process that is facilitated by its interacting homolog NPR4 (Fu et al., 2012). Upon increased SA levels, SA-bound NPR4 does not bind any more to NPR1 allowing its stabilization. Lower NPR1 amounts in the sid2 mutant are thus likely due to the constant NPR4-mediated turn-over of NPR1. How NPR1 is stabilized in NHP-treated sid2 leaves, remains to be elucidated. Interestingly, this stabilization depends on PAD4 (Figure 7). Lower NPR1 levels in sid2 as compared to wild-type plants are sufficient for induction of a subset of SAR genes. Since sid2-2 tga mutants were equally compromised in target gene expression as sid2-2 npr1-1 (Figure 3), we conclude that nuclear NPR1 acts in combination with TGA factors at TGACG containing target promoters.
NHP might prime NPR1 to respond to low SA levels in sid2
When quantitatively analyzing SA binding by ITC (Figure 5A), we calculated a KD of 7.9 ± 0.5 µM, which is about 40× higher than the previously published values. When using equilibrium dialysis, Wu et al. identified a binding constant of 137 nM and postulated a binding mode in which SA is sequestered by a copper ion bound to Cys521/529 (Wu et al., 2012). When separating free SA from the NPR1–SA complex by gel filtration, Fu et al. (2012) did not detect any significant binding, while Ding et al. (2018) and Wang et al. (2020) determined the KD to be 223 and 181 nM, respectively. The lower KD in previous studies might be explained by locally increased concentrations of SA and NPR1 during the gel filtration process.
In the absence of pathogen infection, the basal level of SA in A. thaliana leaf tissue is estimated to be around 1.4 µM (Kong et al., 2016). Consequently, a KD in the nanomolar range as determined in previous studies suggests that NPR1 binding to SA would be already saturated at basal SA levels when defense genes are not strongly expressed. Our KD is consistent with binding of only low amounts of SA to NPR1 in naïve plants, while binding and activation of NPR1 would occur when SA levels rise. We, therefore, suggest that SA binding to NPR1 is likely not saturated in the sid2 background. Still, basal SA levels and a critical SA-contacting residue in the SA binding pocket are required for NPR1 function in the NHP-induced signaling cascade (Figure 4;Supplemental Figure S4). Hence, it may be speculated that NHP sensitizes NPR1 to respond to residual SA levels in sid2. As discussed above, this idea has already been put forward by Kim et al. (2020), who reported that sid2-1 plants with constitutively elevated Pip/NHP levels (camta123 sid2-1) were responsive to low SA concentrations that do not elicit gene expression in control plants lacking NHP (camta123 sid2-1 fmo1).
How this postulated sensitizing mechanism occurs and how or whether the PAD4-dependent stabilization is involved remains to be elucidated. SA and NHP both have a hydroxyl and a carboxyl group in an ortho position on a six-membered ring implicating NHP as a potential ligand (Supplemental Figure S5). Theoretically, sensitization might occur through a cooperative effect due to NHP binding to one subunit of an NPR1 multimeter (Fu et al., 2012; Wu et al., 2012) resulting in increased SA binding affinity of the other subunits. However, we have not observed any binding of NHP to NPR1 using ITC (Figure 5). This can be explained by the difference of the ring system, which is planar in SA. SA, therefore, requires less physical space than NHP, where the ring adapts a chair conformation. Negative data with respect to NHP binding that has been obtained before in a competitive binding assay based on size exclusion (Liu et al., 2020). Unknown plant regulatory mechanisms have to be postulated to explain the binding of NPR1 to basal levels of SA.
In addition to its function as an SA binding protein, NPR1 has been claimed to be indirectly regulated by an SA-mediated cellular redox shift (Mou et al., 2003). This redox shift is established by an increase in total glutathione levels and an increase in the ratio of reduced over oxidized glutathione. When we examined these parameters in NHP-treated sid2-2 plants at the 8-h time point, when NHP-induced SARD1 expression was already detected, no change in glutathione levels or a change in the redox state of the glutathione pool was measured (Figure 6A;Supplemental Figure S8). Hence, NHP and SA have different physiological effects. Still, NHP-mediated redox regulation of NPR1 would have to be directly addressed using appropriate protocols that capture the redox state of proteins in vivo.
PAD4 and EDS1 play different roles in NHP signaling
In addition to NPR1, PAD4 was essential for induction of all NHP-regulated transcripts analyzed in sid2 (ALD1, FMO1, PBS3, SARD1, DLO1) (Figure 7; Supplemental Figure S9). These data are consistent with the lack of Pip-induced immunity in npr1 and pad4 (Navarova et al., 2012). In this respect, PAD4 differs from its interacting partner protein EDS1, which was required for induction of FMO1, ALD1, and PBS3, but not for induction of SARD1 and DLO1. Importantly, PAD4 is essential for the accumulation of NPR1 after NHP treatment (Figure 7B). Since only subtle PAD4-dependent positive effects of NHP on NPR1 transcript levels were occasionally detected, we assume that PAD4 affects NPR1 protein stability. At least in the yeast two-hybrid system, NPR1 and PAD4 failed to interact, irrespective of added NHP (Supplemental Figure S10). Thus, the mechanism of PAD4-mediated stabilization of NPR1 has remained an open question. NPR1 and TGAs were essential for NHP-induced PAD4 transcript levels, which establishe a feed-forward loop with PAD4-mediated enhanced NPR1 protein levels leading to enhanced PAD4 expression. How NHP starts this cycle is not known.
NHP signaling at basal SA levels involves known components of the SA pathway
Our working model depicting NHP-mediated signaling is displayed in Figure 10. We envision that it operates at early time points during SAR when NHP arrives in the systemic leaves to induce SA and NHP biosynthesis. At this time point, NHP is suggested to be perceived by a yet unknown mechanism and activates an NPR1-dependent mechanism that requires basal SA levels. Under these conditions, PAD4 affects NPR1 protein levels in a positive manner. Since TGA transcription factors are required for NHP-mediated signaling, we suggest that SA-bound NPR1 acts as a transcriptional co-activator at promoters with TGACG motifs, as described before. One of the direct targets is the SARD1 promoter, which has a TGACGTCA motif and is induced as early as 8 h after NHP infiltration. Activation of SARD1 requires PAD4 but not EDS1, which can be explained by the importance of PAD4 for maintaining sufficient NPR1 protein levels. Furthermore, enhanced transcription of EDS1 and PAD4, which are required for the expression of final target genes of the pathway, requires NPR1 and TGAs. Since the PAD4 promoter does not contain a TGACG motif, we postulate that other regulatory proteins (e.g. WRKYs, TCPs, or NACs) with TGACG motifs in their promoters serve as secondary transcription factors. Together with EDS1 and PAD4, for which the mechanism of action is not known, these secondary transcription factors are postulated to activate NHP-induced target genes leading to SA and NHP biosynthesis.
Figure 10.
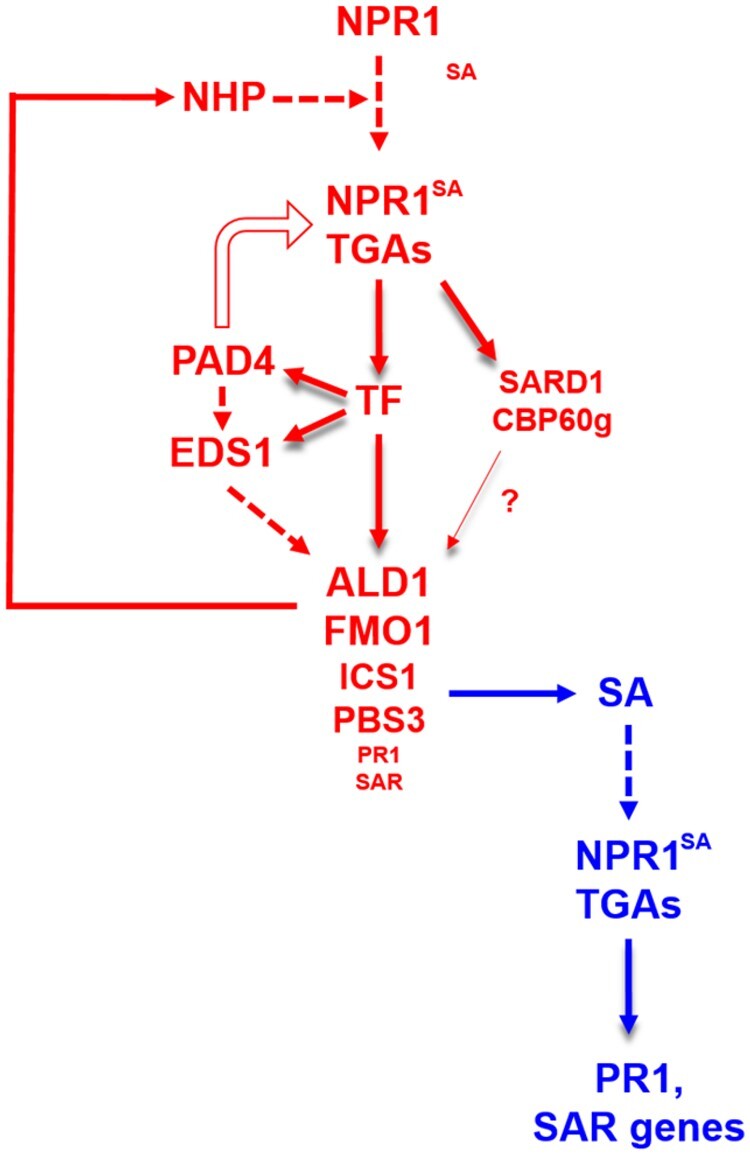
Graphical summary of NHP-induced gene expression at basal SA levels. NHP-induced expression of selected SAR genes (shown in red) requires NPR1 and resting SA levels. It is currently unknown, whether SA is constitutively bound to NPR1 or whether NHP sensitizes NPR1 for SA binding. The NPR1/SA/TGA complex directly activates transcription of genes encoding unidentified secondary transcription factor(s) (TF) and SARD1/CBP60g. The TF(s) activate transcription of PAD4 and EDS1, with PAD4 being required for NPR1 protein accumulation. EDS1 and PAD4 are essential for the induction of a subset of SAR genes, including those involved in NHP and SA synthesis (ALD1, FMO1, ICS1, PBS3). SARD1/CBP60g amplifies transcription. Most SAR genes (e.g. PR1) are induced at a very low expression level which is amplified by SA through the established NPR1/TGA signaling module (blue). Red: NHP pathway. Blue: SA pathway. White arrow: effect on NPR1 protein level. Shaded arrows: activation of transcription. Dashed arrows: unknown mechanism. The question mark refers to the fact that the contribution of SARD1/CBP60g to the pathway was not analyzed in the sid2 background.
Methods
Plant material
All plant genotypes used in this study are in A. thaliana Col-0 background. Col-0 (N1902) and npr1-1 (N3726; Cao et al., 1997) seeds were obtained from the Nottingham Stock Centre (NASC), Nottingham University, Nottingham, UK. sid2-2 mutant seeds (Dewdney et al., 2000; Wildermuth et al., 2001) were obtained from F. M. Ausubel, Harvard University, Boston, USA; sid2-1 (Nawrath and Metraux, 1999), sid2-1 eds1-2 (Cui et al., 2017), and sid2-2 pad4-1 seeds (Tsuda et al., 2009) were provided by J. E. Parker, Max-Planck Institute for Plant Breeding Research, Cologne, Germany; sid2-1 ald1 (Bernsdorff et al. 2016) seeds were obtained from J. Zeier, Heinrich Heine University, Düsseldorf, Germany; tga1 tga4 (Kesarwani et al., 2007), tga2 tga5 tga6 (Zhang et al., 2003), sard1-1 cbp60g-1 (Zhang et al., 2010), npr1-1/pNPR1::NPR1-HA, and npr1-1/pNPR1::NPR1R432Q-HA (Ding et al., 2018) seeds were shared by Y. Zhang, University of British Columbia, Vancouver, Canada; sid2-1 NahG (Bauer et al., 2021) seeds were made available by A. Schäffner, Helmholtz Zentrum München, München, Germany. For the generation of sid2-2 npr1-1, sid2-2 tga1 tga4, and sid2-2 tga2 tga5 tga6 mutants and a line containing a mutation in the TGACG motif of the FMO1 promoter, see Supplemental Methods.
Plant growth conditions and treatments
Arabidopsis thaliana seeds were cultivated on individual pots containing soil (Fruhstorpfer Topferde Typ T Struktur 1 Fein) which was soaked once with 0.2% v/v Wuxal Super (Manna, Ammerbuch-Pfäffingen, Germany). The seeds were stratified at 4°C for 2 d after which the plants were grown in 12-h photoperiod in controlled climate chambers at 22°C with a photon flux intensity of 100–120 µmol m−2 s−1 during the day and 60% relative humidity. For SAR experiments, P. syringae pv. maculicola ES4326 (Psm) was grown overnight at 28°C in Kings B media supplemented with 50 mg L−1 rifampicin. Bacteria were washed twice with 10 mM MgCl2 and diluted to a final OD of 0.005. Three leaves of 4.5-week-old plants were infiltrated with either 10 mM MgCl2 (mock) or Psm. Two days after the primary infiltration, three upper leaves were inoculated with Psm (OD0.005). Samples were collected 8 hpi for gene expression analysis. NHP treatment was performed by infiltrating three leaves of 4.5-week-old plants with either 10 mM MgCl2 (mock) or 1 mM NHP solution in 10 mM MgCl2. The infiltrated leaves were collected for transcript and NPR1 protein level analysis at 8 h, 24 h, or 48 h after infiltration. The sampling modes are described in the legends. For pathogen growth assays, three leaves of 4.5-week-old plants were infiltrated with either 10 mM MgCl2 (mock) or NHP. After 24 h, three upper leaves were inoculated with Psm (OD0.001). Three leaf discs per inoculated leaf were collected at 48 hpi and used to assess bacterial growth (Glazebrook and Ausubel, 1994). For priming experiments, the leaves infiltrated with either 10 mM MgCl2 (mock) or NHP 24 h after primary infiltration the leaves were inoculated with Psm (OD0.005). Samples were collected at 8 h after infiltration for gene expression analysis.
Synthesis of NHP
(S)-NHP was prepared from L-pipecolic acid as described before (Chen et al., 2018). A key step is the Cope-type elimination of acrylonitrile from N-cyanoethyl-pipecolic acid N-oxide. Acrylonitrile (boiling point 77°C) is removed by long-term co-distillation with acetone, a method usually causing significant contamination of the resulting NHP by thermal decomposition products. Instead of low boiling acetone (56°C), we used methyl ethyl ketone (boiling point 80°C) which led to a shorter reaction time and a much cleaner NHP product as confirmed by nuclear magnetic resonance (NMR) spectroscopy (Supplemental Figure S2). Further details are given in Supplemental Methods.
ITC
The interaction between NPR1 and potential binders (SA, NHP) was studied by ITC. Recombinant NPR1 was expressed in insect cells using a baculovirus vector that provided an N-terminal tandem Strep-MBP-tag fused NPR1 (see Supplemental Methods for cloning, expression, and purification of Strep-MBP-NPR1). All experiments were carried out with a MicroCal PEAQ-ITC instrument (Malvern Panalytical) at 25°C with constant stirring of 750 rpm. The injection syringe was first loaded with either SA (500–875 µM) or NHP (500–700 µM) in an automated manner. The ligand solution was then serially injected into the sample cell pre-filled with Strep-MBP-NPR1 (36–66 µM). In total, 19 injections were made with a speed of 2 s µL−1 (first injection: 0.4 µL, injections 2–19: 2 µL) and a spacing of 120 s. As a control, ligands were titrated into the buffer. Data analysis was done using the manufacturer’s software. In brief, the baseline of the raw ITC thermogram was corrected for each dataset, and the heat signals observed for the buffer–ligand titration were subtracted from the protein–ligand titration experiment. Thus, obtained signal peaks were integrated to obtain a plot between the molar enthalpy change and the [ligand]/[NPR1] ratio according to the ‘one set of sites’ model (MicroCal Analysis) to derive thermodynamic binding parameters.
Statistical analyses
Statistical analyses were performed with GraphPad Prism 5.0 (GraphPad Software, Inc., San Diego, CA, USA). In order to not distort the statistical analysis for gene expression in Figure 7 by disregarding values that fell below the detection threshold especially in mock-treated plants, we corrected the values to ones orientated around the lowest value measured for that genotype and treatment.
Other methods
Generation of mutants in the sid2-2 background and a plant line with a mutation in the FMO1 promoter, a detailed protocol of NHP synthesis, expression, and purification of Strep-MBP-NPR1, total protein extraction and immunoblotting, RNA extraction, and RT-qPCR analysis, yeast two- hybrid analysis, glutathione measurements and primer sequences (Supplemental Tables S1 and S2) are described in Supplemental methods.
Accession numbers
Sequence data for the genes studied in this article can be found in the Arabidopsis Genome Initiative database under the following accession numbers: ALD1 (At2g13810), DLO1 (At4g10500), EDS1 (At3g48090), EDS5 (At4g39030), FMO1 (At1g19250), NPR1 (At1g64280), PAD4 (At3g52430), PBS3 (At5g13320), PR1 (At2g14610), SARD1 (At1g73805), SARD4 (At5g52810), SID2/ICS1 (At1g74710), UBQ5 (At3G62250).
Supplemental data
The following materials are available in the online version of this article.
Supplemental Figure S1. Induction of SA and NHP biosynthesis genes during SAR occurs at basal SA levels but depends on NPR1.
Supplemental Figure S2. 1H-NMR spectrum of NHP.
Supplemental Figure S3. Induction of FMO1 by NHP at basal SA levels.
Supplemental Figure S4. NHP-mediated induction of FMO1 is impaired in the NPR1R432Q complemented line.
Supplemental Figure S5. Structural formulas of SA and NHP.
Supplemental Figure S6. NHP-induced ICS1 expression is SARD1/CBP60g-dependent.
Supplemental Figure S7. The TGACG motif in the FMO1 promoter is not essential for the regulation of FMO1.
Supplemental Figure S8. NHP treatment does not influence cellular glutathione levels.
Supplemental Figure S9. Induction of PBS3 and ALD1 depends on both EDS1 and PAD4.
Supplemental Figure S10. The addition of either SA or NHP does not influence the NPR1-EDS1 or NPR1-PAD4 interaction in the yeast two-hybrid system.
Supplemental Table S1. Primers for genotyping and cloning.
Supplemental Table S2. List of primers used for RT-qPCR analysis.
Supplemental Note S1: Map and sequence of the CRISPR/Cas9 binary vector pBCsGFPEE.
Supplemental Note S2: NMR analysis of NHP hydrochloride and NHP potassium salt.
Supplemental Note S3: Sequence of p438C_strep-NPR1.
Supplementary Material
Acknowledgments
We are thankful to Prof. Dr Jürgen Zeier (Institute of Plant Molecular Ecophysiology Heinrich Heine University Düsseldorf, Germany) for providing the sid2-1 ald1 seeds, Prof. Dr Jane E. Parker (Max-Planck Institute for Plant Breeding Research, Cologne, Germany) for sharing the sid2-1 eds1 and sid2-2 pad4 seeds; Dr Yuelin Zhang (University of British Columbia, Vancouver, Canada) for tga2 tga5 tga6, sard1 cbp60g, npr1-1/pNPR1::NPR1-HA, and npr1-1/pNPR1::NPR1R432Q-HA seeds; and Dr A. Schäffner (Helmholtz Zentrum München, München, Germany) for sending sid2-2 NahG seeds. We thank Dr Patrick Cramer and his staff (Max Planck Institute for Biophysical Chemistry, Göttingen) for their support to establish the baculovirus expression system in our laboratory and Dr Guido Kriete for setting up the system. We also thank Dr Joachim Uhrig for cloning the NPR1 coding region into the expression vector and Ronald Scholz, Anna Hermann and Katharina Dworak for technical assistance.
Funding
A.N. and I.G. were funded by the Deutsche Forschungsgemeinschaft (DFG, IRTG 2172 “PRoTECT”).
Conflict of interest statement. The authors declare no conflict of interest.
A.N. and I.G. designed the experiments, acquired and analyzed most of the data, E.V. and L.T. were involved in the chemical synthesis of NHP, P.M. expressed recombinant protein in insect cells, S.P. and K.T. performed ITC experiments and analyzed the data. C.T generated the sid2-2 npr1-1 double mutant, FMO1 CRISPR lines, and contributed to the design and analysis of experiments. C.G participated in the design and interpretation of the experiments and wrote the manuscript.
The author responsible for distribution of materials integral to the findings presented in this article in accordance with the policy described in the Instructions for Authors (https://academic.oup.com/plphys/pages/General-Instructions) is Christiane Gatz (cgatz@gwdg.de).
References
- Bartsch M, Gobbato E, Bednarek P, Debey S, Schultze JL, Bautor J, Parker JE (2006) Salicylic acid-independent ENHANCED DISEASE SUSCEPTIBILITY1 signaling in Arabidopsis immunity and cell death is regulated by the monooxygenase FMO1 and the Nudix hydrolase NUDT7. Plant Cell 18:1038–1051 [DOI] [PMC free article] [PubMed] [Google Scholar]
- Bauer S, Mekonnen DW, Hartmann M, Yildiz I, Janowski R, Lange B, Geist B, Zeier J, Schaeffner AR (2021) UGT76B1, a promiscuous hub of small molecule-based immune signaling, glucosylates N-hydroxypipecolic acid and balances plant immunity. Plant Cell 33:714–734 [DOI] [PMC free article] [PubMed] [Google Scholar]
- Baum S, Reimer-Michalski EM, Bolger A, Mantai AJ, Benes V, Usadel B, Conrath U (2019) Isolation of open chromatin identifies regulators of systemic acquired resistance. Plant Physiol 181:817–833 [DOI] [PMC free article] [PubMed] [Google Scholar]
- Beckers GJ, Jaskiewicz M, Liu Y, Underwood WR, He SY, Zhang S, Conrath U (2009) Mitogen-activated protein kinases 3 and 6 are required for full priming of stress responses in Arabidopsis thaliana. Plant Cell 21:944–953 [DOI] [PMC free article] [PubMed] [Google Scholar]
- Bernsdorff F, Doring AC, Gruner K, Schuck S, Brautigam A, Zeier J (2016) Pipecolic acid orchestrates plant systemic acquired resistance and defense priming via salicylic acid-dependent and -independent pathways. Plant Cell 28:102–129 [DOI] [PMC free article] [PubMed] [Google Scholar]
- Budimir J, Treffon K, Nair A, Thurow C, Gatz C (2020) Redox-active cysteines in TGACG-BINDING FACTOR 1 (TGA1) do not play a role in salicylic acid or pathogen-induced expression of TGA1-regulated target genes in Arabidopsis thaliana. New Phytol 230:2420–2432 [DOI] [PubMed] [Google Scholar]
- Cao H, Glazebrook J, Clarke JD, Volko S, Dong X (1997) The Arabidopsis NPR1 gene that controls systemic acquired resistance encodes a novel protein containing ankyrin repeats. Cell 88:57–63 [DOI] [PubMed] [Google Scholar]
- Chen YC, Holmes EC, Rajniak J, Kim JG, Tang S, Fischer CR, Mudgett MB, Sattely ES (2018) N-hydroxy-pipecolic acid is a mobile metabolite that induces systemic disease resistance in Arabidopsis. Proc Natl Acad Sci U S A 115:E4920–E4929 [DOI] [PMC free article] [PubMed] [Google Scholar]
- Conrath U, Beckers GJ, Langenbach CJ, Jaskiewicz MR (2015) Priming for enhanced defense. Annu Rev Phytopathol 53:97–119 [DOI] [PubMed] [Google Scholar]
- Cui H, Gobbato E, Kracher B, Qiu J, Bautor J, Parker JE (2017) A core function of EDS1 with PAD4 is to protect the salicylic acid defense sector in Arabidopsis immunity. New Phytol 213:1802–1817 [DOI] [PubMed] [Google Scholar]
- Dangl JL, Jones JD (2001) Plant pathogens and integrated defence responses to infection. Nature 411:826–833 [DOI] [PubMed] [Google Scholar]
- Delaney TP, Friedrich L, Ryals JA (1995) Arabidopsis signal transduction mutant defective in chemically and biologically induced disease resistance. Proc Natl Acad Sci U S A 92:6602–6606 [DOI] [PMC free article] [PubMed] [Google Scholar]
- Dewdney J, Reuber TL, Wildermuth MC, Devoto A, Cui J, Stutius LM, Drummond EP, Ausubel FM (2000) Three unique mutants of Arabidopsis identify eds loci required for limiting growth of a biotrophic fungal pathogen. Plant J 24:205–218 [DOI] [PubMed] [Google Scholar]
- Ding P, Rekhter D, Ding Y, Feussner K, Busta L, Haroth S, Xu S, Li X, Jetter R, Feussner I, Zhang Y (2016) Characterization of a pipecolic acid biosynthesis pathway required for systemic acquired resistance. Plant Cell 28:2603–2615 [DOI] [PMC free article] [PubMed] [Google Scholar]
- Ding Y, Sun T, Ao K, Peng Y, Zhang Y, Li X, Zhang Y (2018) Opposite roles of salicylic acid receptors NPR1 and NPR3/NPR4 in transcriptional regulation of plant immunity. Cell 173:1454–1467 e1415 [DOI] [PubMed] [Google Scholar]
- Durrant WE, Dong X (2004) Systemic acquired resistance. Annu Rev Phytopathol 42:185–209 [DOI] [PubMed] [Google Scholar]
- Feys BJ, Moisan LJ, Newman MA, Parker JE (2001) Direct interaction between the Arabidopsis disease resistance signaling proteins, EDS1 and PAD4. EMBO J 20:5400–5411 [DOI] [PMC free article] [PubMed] [Google Scholar]
- Fu ZQ, Yan S, Saleh A, Wang W, Ruble J, Oka N, Mohan R, Spoel SH, Tada Y, Zheng N, Dong X (2012) NPR3 and NPR4 are receptors for the immune signal salicylic acid in plants. Nature 486:228–232 [DOI] [PMC free article] [PubMed] [Google Scholar]
- Glazebrook J, Ausubel FM (1994) Isolation of phytoalexin-deficient mutants of Arabidopsis thaliana and characterization of their interactions with bacterial pathogens. Proc Natl Acad Sci U S A 91:8955–8959 [DOI] [PMC free article] [PubMed] [Google Scholar]
- Hartmann M, Kim D, Bernsdorff F, Ajami-Rashidi Z, Scholten N, Schreiber S, Zeier T, Schuck S, Reichel-Deland V, Zeier J (2017) Biochemical principles and functional aspects of pipecolic acid biosynthesis in plant immunity. Plant Physiol 174:124–153 [DOI] [PMC free article] [PubMed] [Google Scholar]
- Hartmann M, Zeier J (2018) l-lysine metabolism to N-hydroxypipecolic acid: an integral immune-activating pathway in plants. Plant J 96:5–21 [DOI] [PubMed] [Google Scholar]
- Hartmann M, Zeier T, Bernsdorff F, Reichel-Deland V, Kim D, Hohmann M, Scholten N, Schuck S, Brautigam A, Holzel T, et al. (2018) Flavin monooxygenase-generated N-hydroxypipecolic acid is a critical element of plant systemic immunity. Cell 173:456–469 e416 [DOI] [PubMed] [Google Scholar]
- Jaskiewicz M, Conrath U, Peterhansel C (2011) Chromatin modification acts as a memory for systemic acquired resistance in the plant stress response. EMBO Rep 12:50–55 [DOI] [PMC free article] [PubMed] [Google Scholar]
- Joglekar S, Suliman M, Bartsch M, Halder V, Maintz J, Bautor J, Zeier J, Parker JE, Kombrink E (2018) Chemical activation of EDS1/PAD4 signaling leading to pathogen resistance in Arabidopsis. Plant Cell Physiol 59:1592–1607 [DOI] [PubMed] [Google Scholar]
- Kachroo A, Kachroo P (2020) Mobile signals in systemic acquired resistance. Curr Opin Plant Biol 58:41–47 [DOI] [PubMed] [Google Scholar]
- Kesarwani M, Yoo J, Dong X (2007) Genetic interactions of TGA transcription factors in the regulation of pathogenesis-related genes and disease resistance in Arabidopsis. Plant Physiol 144:336–346 [DOI] [PMC free article] [PubMed] [Google Scholar]
- Kim Y, Gilmour SJ, Chao L, Park S, Thomashow MF (2020) Arabidopsis CAMTA transcription factors regulate pipecolic acid biosynthesis and priming of immunity genes. Mol Plant 13:157–168 [DOI] [PubMed] [Google Scholar]
- Kong Q, Sun T, Qu N, Ma J, Li M, Cheng YT, Zhang Q, Wu D, Zhang Z, Zhang Y (2016) Two redundant receptor-like cytoplasmic kinases function downstream of pattern recognition receptors to regulate activation of SA biosynthesis. Plant Physiol 171:1344–1354 [DOI] [PMC free article] [PubMed] [Google Scholar]
- Lawton K, Weymann K, Friedrich L, Vernooij B, Uknes S, Ryals J (1995) Systemic acquired resistance in Arabidopsis requires salicylic acid but not ethylene. Mol Plant Microbe Interact 8:863–870 [DOI] [PubMed] [Google Scholar]
- Liu Y, Sun T, Sun Y, Zhang Y, Radojicic A, Ding Y, Tian H, Huang X, Lan J, Chen S, et al. (2020) Diverse roles of the salicylic acid receptors NPR1 and NPR3/NPR4 in plant immunity. Plant Cell 32:4002–4016 [DOI] [PMC free article] [PubMed] [Google Scholar]
- Mauch-Mani B, Baccelli I, Luna E, Flors V (2017) Defense priming: an adaptive part of induced resistance. Annu Rev Plant Biol 68:485–512 [DOI] [PubMed] [Google Scholar]
- Mishina TE, Zeier J (2006) The Arabidopsis flavin-dependent monooxygenase FMO1 is an essential component of biologically induced systemic acquired resistance. Plant Physiol 141:1666–1675 [DOI] [PMC free article] [PubMed] [Google Scholar]
- Mohnike L, Rekhter D, Huang W, Feussner K, Tian H, Herrfurth C, Zhang Y, Feussner I (2021) The glycosyltransferase UGT76B1 is critical for plant immunity as it governs the homeostasis of N-hydroxy-pipecolic acid. Plant Cell 33:735–749 [DOI] [PMC free article] [PubMed] [Google Scholar]
- Mou Z, Fan W, Dong X (2003) Inducers of plant systemic acquired resistance regulate NPR1 function through redox changes. Cell 113:935–944 [DOI] [PubMed] [Google Scholar]
- Navarova H, Bernsdorff F, Doring AC, Zeier J (2012) Pipecolic acid, an endogenous mediator of defense amplification and priming, is a critical regulator of inducible plant immunity. Plant Cell 24:5123–5141 [DOI] [PMC free article] [PubMed] [Google Scholar]
- Nawrath C, Metraux JP (1999) Salicylic acid induction-deficient mutants of Arabidopsis express PR-2 and PR-5 and accumulate high levels of camalexin after pathogen inoculation. Plant Cell 11:1393–1404 [DOI] [PMC free article] [PubMed] [Google Scholar]
- Perozzo R, Folkers G, Scapozza L (2004) Thermodynamics of protein-ligand interactions: history, presence, and future aspects. J Recept Signal Transduct Res 24:1–52 [DOI] [PubMed] [Google Scholar]
- Rekhter D, Ludke D, Ding Y, Feussner K, Zienkiewicz K, Lipka V, Wiermer M, Zhang Y, Feussner I (2019) Isochorismate-derived biosynthesis of the plant stress hormone salicylic acid. Science 365:498–502 [DOI] [PubMed] [Google Scholar]
- Seyfferth C, Tsuda K (2014) Salicylic acid signal transduction: the initiation of biosynthesis, perception and transcriptional reprogramming. Front Plant Sci 5:697. [DOI] [PMC free article] [PubMed] [Google Scholar]
- Spoel SH, Dong X (2012) How do plants achieve immunity? Defence without specialized immune cells. Nat Rev Immunol 12:89–100 [DOI] [PubMed] [Google Scholar]
- Sun T, Busta L, Zhang Q, Ding P, Jetter R, Zhang Y (2018) TGACG-BINDING FACTOR 1 (TGA1) and TGA4 regulate salicylic acid and pipecolic acid biosynthesis by modulating the expression of SYSTEMIC ACQUIRED RESISTANCE DEFICIENT 1 (SARD1) and CALMODULIN-BINDING PROTEIN 60g (CBP60g). New Phytol 217:344–354 [DOI] [PubMed] [Google Scholar]
- Sun T, Zhang Y, Li Y, Zhang Q, Ding Y, Zhang Y (2015) ChIP-seq reveals broad roles of SARD1 and CBP60g in regulating plant immunity. Nat Commun 6:10159. [DOI] [PMC free article] [PubMed] [Google Scholar]
- Tateda C, Zhang Z, Shrestha J, Jelenska J, Chinchilla D, Greenberg JT (2014) Salicylic acid regulates Arabidopsis microbial pattern receptor kinase levels and signaling. Plant Cell 26:4171–4187 [DOI] [PMC free article] [PubMed] [Google Scholar]
- Tian H, Zhang Y (2019) The emergence of a mobile signal for systemic acquired resistance. Plant Cell 31:1414–1415 [DOI] [PMC free article] [PubMed] [Google Scholar]
- Torrens-Spence MP, Bobokalonova A, Carballo V, Glinkerman CM, Pluskal T, Shen A, Weng JK (2019) PBS3 and EPS1 complete salicylic acid biosynthesis from isochorismate in Arabidopsis. Mol Plant 12:1577–1586 [DOI] [PubMed] [Google Scholar]
- Tsuda K, Sato M, Stoddard T, Glazebrook J, Katagiri F (2009) Network properties of robust immunity in plants. PLoS Genet 5:e1000772. [DOI] [PMC free article] [PubMed] [Google Scholar]
- Vlot AC, Dempsey DA, Klessig DF (2009) Salicylic acid, a multifaceted hormone to combat disease. Annu Rev Phytopathol 47:177–206 [DOI] [PubMed] [Google Scholar]
- Wagner S, Stuttmann J, Rietz S, Guerois R, Brunstein E, Bautor J, Niefind K, Parker JE (2013) Structural basis for signaling by exclusive EDS1 heteromeric complexes with SAG101 or PAD4 in plant innate immunity. Cell Host Microbe 14:619–630 [DOI] [PubMed] [Google Scholar]
- Wang D, Amornsiripanitch N, Dong X (2006) A genomic approach to identify regulatory nodes in the transcriptional network of systemic acquired resistance in plants. PLoS Pathog 2:e123. [DOI] [PMC free article] [PubMed] [Google Scholar]
- Wang L, Tsuda K, Truman W, Sato M, Nguyen le V, Katagiri F, Glazebrook J (2011) CBP60g and SARD1 play partially redundant critical roles in salicylic acid signaling. Plant J 67:1029–1041 [DOI] [PubMed] [Google Scholar]
- Wang W, Withers J, Li H, Zwack PJ, Rusnac DV, Shi H, Liu L, Yan S, Hinds TR, Guttman M, et al. (2020) Structural basis of salicylic acid perception by Arabidopsis NPR proteins. Nature 586:311–316 [DOI] [PMC free article] [PubMed] [Google Scholar]
- Wildermuth MC, Dewdney J, Wu G, Ausubel FM (2001) Isochorismate synthase is required to synthesize salicylic acid for plant defence. Nature 414:562–565 [DOI] [PubMed] [Google Scholar]
- Wu Y, Zhang D, Chu JY, Boyle P, Wang Y, Brindle ID, De Luca V, Despres C (2012) The Arabidopsis NPR1 protein is a receptor for the plant defense hormone salicylic acid. Cell Rep 1:639–647 [DOI] [PubMed] [Google Scholar]
- Yildiz I, Mantz M, Hartmann M, Zeier T, Kessel J, Thurow C, Gatz C, Petzsch P, Kohrer K, Zeier J (2021) Mobile SAR signal N-hydroxypipecolic acid induces NPR1-dependent transcriptional reprogramming and immune priming. Plant Physiol 186:1679–1705 [DOI] [PMC free article] [PubMed] [Google Scholar]
- Zavaliev R, Mohan R, Chen T, Dong X (2020) Formation of NPR1 condensates promotes cell survival during the plant immune response. Cell 182:1093–1108 e1018 [DOI] [PMC free article] [PubMed] [Google Scholar]
- Zhang Y, Fan W, Kinkema M, Li X, Dong X (1999) Interaction of NPR1 with basic leucine zipper protein transcription factors that bind sequences required for salicylic acid induction of the PR-1 gene. Proc Natl Acad Sci U S A 96:6523–6528 [DOI] [PMC free article] [PubMed] [Google Scholar]
- Zhang Y, Tessaro MJ, Lassner M, Li X (2003) Knockout analysis of Arabidopsis transcription factors TGA2, TGA5, and TGA6 reveals their redundant and essential roles in systemic acquired resistance. Plant Cell 15:2647–2653 [DOI] [PMC free article] [PubMed] [Google Scholar]
- Zhang Y, Xu S, Ding P, Wang D, Cheng YT, He J, Gao M, Xu F, Li Y, Zhu Z, et al. (2010) Control of salicylic acid synthesis and systemic acquired resistance by two members of a plant-specific family of transcription factors. Proc Natl Acad Sci U S A 107:18220–18225 [DOI] [PMC free article] [PubMed] [Google Scholar]
- Zhou N, Tootle TL, Tsui F, Klessig DF, Glazebrook J (1998) PAD4 functions upstream from salicylic acid to control defense responses in Arabidopsis. Plant Cell 10:1021–1030 [DOI] [PMC free article] [PubMed] [Google Scholar]
Associated Data
This section collects any data citations, data availability statements, or supplementary materials included in this article.