

Abstract
Ovarian carcinoma immunoreactive antigen domain 2 (OCIAD2) has been reported to show significantly higher expression in invasive lung adenocarcinoma than in lung adenocarcinoma in situ, and its abnormal expression is associated with poorer prognosis of the patients. However, the cellular function of OCIAD2 in this tumor remains poorly understood. In the present study, we first validated that OCIAD2 showed higher expression in human lung adenocarcinoma tissues or cell lines than in normal lung tissue or immortalized normal bronchial epithelial cells. OCIAD2 was localized predominantly at the mitochondrial membrane in lung adenocarcinoma cells. Interestingly, suppression of OCIAD2 led to loss of mitochondrial structure and a reduction in the number of mitochondria. Moreover, OCIAD2 suppression led to downregulation of cellular growth, proliferation, migration, and invasion, and upregulation of mitochondria‐related apoptosis. We also showed that OCIAD2 suppression induced a decrease in mitochondrial membrane potential and release of cytochrome c. Transcriptional profiling using RNA sequencing revealed a total of 137 genes whose expression was commonly altered after OCIAD2 knockdown in three lung adenocarcinoma cell lines (A549, HCC827, and PC9). Pathway enrichment analysis of those genes demonstrated significant enrichment in apoptotic signaling or endoplasmic reticulum (ER) stress pathways. Our data suggest that OCIAD2 inhibits the mitochondria‐initiated apoptosis and thus promotes the survival of lung cancer cells. Therefore, OCIAD2 may be an effective target for treatment of lung adenocarcinoma.
Keywords: apoptosis, electron microscopy, lung adenocarcinoma, mitochondria, OCIAD2
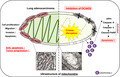
In lung adenocarcinoma, OCIAD2 maintains the mitochondria integrity and promotes tumor progression by acting as an antiapoptotic factor. However, inhibition of OCIAD2 causes fatal defects in the mitochondria and also induces mitochondrial apoptosis by depolarizing the mitochondrial membrane potential, releasing cytochrome c, and activating caspase cascades in lung adenocarcinoma cells.
1. INTRODUCTION
Lung cancer is one of the leading causes of cancer‐related death worldwide, 1 , 2 and adenocarcinoma is the most common histologic subtype. Previously, Noguchi et al have demonstrated that adenocarcinoma in situ (AIS, types A and B of the Noguchi classification) has an extremely favorable prognosis with a 5‐year survival rate of 100% and shows stepwise progression to early but invasive adenocarcinoma (eIA, type C of the Noguchi classification), which has a poorer outcome with a 5‐year survival rate of 75%. 3 In order to clarify the mechanism of early malignant progression from AIS to eIA, Ishiyama et al 4 had conducted suppression subtractive hybridization (SSH) analysis and identified ovarian carcinoma immunoreactive antigen domain 2 (OCIAD2) had significantly higher expression in eIA than in AIS.
OCIAD2 was originally identified by Strausberg et al in 2002 through its sequence similarity to ovarian carcinoma immunoreactive antigen domain 1 (OCIAD1) as part of the National Institutes of Health Mammalian Gene Collection project. OCIAD2 is known to localize at endosomes, mitochondria, and the mitochondria‐associated endoplasmic reticulum (ER) membrane (MAM) in several types of cells. 5 , 6 , 7 On the other hand, there is limited information on the subcellular localization of OCIAD2 in lung adenocarcinoma (LUAD).
We have previously reported that high expression of OCIAD2 in invasive adenocarcinoma of the lung can be a promising biomarker for cytological and histological diagnosis. 8 Also, its high expression was significantly associated with poorer patient outcome, and Epidermal Growth Factor Receptor (EGFR) mutation, 9 suggesting that OCIAD2 appears to be a potential prognostic indicator of early invasive adenocarcinoma. Similarly, several reports have highlighted high OCIAD2 expression in malignant tumors such as those of the ovary and brain. 10 , 11 , 12 On the other hand, it has also been suggested that OCIAD2 is less likely to be expressed in patients with hepatoblastoma or chronic lymphocytic leukemia. 13 , 14 Therefore, the function of OCIAD2 in tumor cells is still controversial, and its specific molecular role in early invasive adenocarcinoma has never been reported.
In the present study, we describe the subcellular localization of OCIAD2 and its involvement in mitochondrial integrity and mitochondria‐initiated apoptosis. These results provide new insights into the function of OCIAD2 and the molecular mechanism of early progression of LUAD.
2. MATERIALS AND METHODS
2.1. Cell lines and culture conditions
The cell lines A549 and PC9 were purchased from RIKEN Cell Bank, HCC827 was obtained from the American Type Culture Collection (ATCC), and PL16T and PL16B were established in our laboratory from human lung AIS and human bronchial epithelium, respectively. 15 A549 cells were maintained in D‐MEM/F12 (Thermo Fisher Scientific) supplemented with 10% fetal bovine serum (FBS) (Sigma‐Aldrich). HCC827 cells were cultured in RPMI1640 (Thermo Fisher Scientific) with 10% FBS. PL16B and PL16T cells were maintained in MCDB153HAA (Wako) supplemented with 2% FBS (Sigma‐Aldrich), 0.5 ng/mL human‐Epidermal Growth Factor (EGF, Toyobo), 5 μg/mL human‐insulin (Wako), 72 ng/mL hydrocortisone (Wako), 40 μg/mL human‐transferrin (Sigma‐Aldrich), and 20 ng/mL sodium selenite (Sigma‐Aldrich). All cell lines were cultured in a 5% CO2 incubator at 37°C.
2.2. Patients and tissue specimens
To examine the levels of OCIAD2 expression in human tissues, twelve paired fresh‐frozen specimens of tumor and adjacent normal lung tissues that had been obtained by surgical resection from patients at Tsukuba University Hospital and preserved at Tsukuba Human Tissue Biobank Center (Ibaraki, Japan) were used. Informed consent for this study had been obtained from all of the patients concerned.
2.3. siRNA transfection
Three specific siRNA against OCIAD2 or scrambled siRNA (siCON) were transfected using lipofectamine RNAiMAX (Thermo Fisher Scientific) as described previously 16 , 17 and detailed in the Supporting Information.
2.4. Cell proliferation assay
HCC827 and A549 cells were transfected with three kinds of siOCIAD2 in 96‐well plates and incubated for 72 hours. WST‐8 assay was performed using a Cell Counting Kit‐8 (DOJINDO) in accordance with the manufacturer's protocol, and absorbance was measured using a Microplate Reader (Bio‐Rad Laboratories).
2.5. Antibodies
The primary antibodies used for protein analysis were obtained from various commercial sources as follows: OCIAD2 (1:500) from Thermo Fisher Scientific, sodium potassium ATPase (1:100,000) and OCIAD1 (1:1000) from Abcam, Tom20 (1:500) and cytochrome c (1:500) from Santa Cruz Biotechnology, β‐actin (1:5000) from Sigma‐Aldrich, α‐tubulin (1:500) from Wako, and caspase‐3 (1:1000), cleaved caspase‐3 (1:500), caspase‐9 (1:500), cleaved caspase‐9 (1:500), caspase‐8 (1:500), cleaved caspase‐8 (1:500), Poly (ADP‐ribose) polymerases (PARP) (1:500), and cleaved PARP (1:500) from Cell Signaling Technology.
2.6. Western blotting
Western blotting was carried out using the protocol described previously with modification. 16 , 17 Total proteins were extracted using mammalian protein extraction reagent (M‐PER, Thermo Fisher Scientific) or tissue protein extraction reagent (T‐PER, Thermo Fisher Scientific) containing a Halt protease and phosphatase inhibitor cocktail (Thermo Fisher Scientific). The extracted proteins were measured using a Bicinchoninic acid (BCA) protein assay kit (Thermo Fisher Scientific). Total proteins were used for electrophoresis on 12%, 4%‐15%, or 4%‐20% Mini‐PROTEAN TGX precast gels (Bio‐Rad Laboratories) and transferred to polyvinylidene difluoride membranes using an iBlot gel transfer system (Thermo Fisher Scientific). The membranes were incubated using the blocking buffer with Tween‐20 and probed with each primary antibody overnight at 4°C, and the membranes were incubated with secondary antibodies for 1 hour at room temperature or overnight at 4°C. Then, the proteins were visualized using Super Signal West Femto Maximum sensitivity substrate (Thermo Fisher Scientific) and the ChemiDoc Touch Imaging System (Bio‐Rad Laboratories).
2.7. Immunofluorescence (IF)
HCC827 and A549 cells were plated on 12‐well collagen‐coated plates with coated cover slips (Iwaki Biosciences). The cells were fixed with 10% neutral buffered formalin and permeabilized with 0.5% Triton™ X‐100 (Thermo Fisher Scientific) for 15 minutes at room temperature. After a thorough wash with PBS, the cells were blocked with blocking buffer. They were then incubated with appropriate primary antibodies for 1 hour at room temperature. After a thorough wash with PBS, the cells were incubated with anti‐rabbit IgG–conjugated Alexa Fluor 568 secondary antibody and anti‐mouse antibody IgG–conjugated Alexa Fluor 488 secondary antibody (Thermo Fisher Scientific) for 1 hour at room temperature, and the slides were analyzed using a confocal microscope (Leica TCS SP8; Leica Microsystems).
2.8. Transmission electron microscopy (TEM)
HCC827 and A549 cells transfected with siOCIAD2 were prepared in a cell block containing 1 × 10⁶ cells/mL 72 hours after siRNA transfection. The cells were fixed with 2.5% glutaraldehyde in 0.1 mol/L phosphate buffer (pH 7.4). After three washes with PBS, they were post‐fixed with 1% osmium tetroxide for 1 hour, dehydrated in an ethanol series, and embedded in Epon resin. Ultrathin sections were cut and stained with 5% uranyl acetate and Reynolds’ lead citrate, 18 and observed with a transmission electron microscope (JEM‐1400, JEOL). The numbers of mitochondria were counted in 19 or 22 different cells and the numbers of cristae were counted in 6 or 9 mitochondria in different cells.
2.9. Annexin V‐FITC apoptosis assay
The Annexin V‐FITC apoptosis assay kit (immunochemistry) was used to detect apoptotic cells. The assay was performed according to the manufacturer's protocol. In brief, the cells were trypsinized and collected after siOCIAD2 transfection for 72 hours. Collected cells were washed by ice‐cold PBS, resuspended in 1× binding buffer, and incubated with Annexin V‐FITC and propidium iodide (PI). The cells were measured by flow cytometry (BD FACSVerse™ flow cytometer).
2.10. Measurement of mitochondrial membrane potential (MMP)
After siOCIAD2 transfection for 72 hours, the cells were trypsinized and collected into 2‐mL tubes containing complete medium. The cells were then incubated in a 5% CO2 incubator at 37°C with 200 nmol/L tetramethylrhodamine methyl ester (TMRM, MitoPT TMRM assay) in cell medium for 30 minutes. The samples were washed and analyzed by flow cytometry (BD FACSVerse™ flow cytometer). Carbonyl cyanide 3‐chlorophenylhydrazone (CCCP) was used as a depolarization control.
2.11. RNA sequencing (RNA‐seq)
A549, HCC827, and PC9 cells were cultured and transfected with siCON or siOCIAD2 for 72 hours. The total RNA was isolated from each cell using TRIZOL (Thermo Fisher Scientific) employing the manufacturer's protocol. RNA quality was evaluated using an Agilent Bioanalyzer RNA 6000 Pico Kit (Agilent). Five hundred nanogram of total RNA was used for rRNA depletion with a NEBNext rRNA depletion kit (New England Biolabs), and a directional library was synthesized using a NEBNext Ultra Directional RNA Library Prep Kit (New England Biolabs). The library was validated with a bioanalyzer (Agilent Technologies) to determine the size distribution and concentration, and 2 × 36‐base paired‐end sequencing was performed with a NextSeq 500 (Illumina) at Tsukuba i‐Laboratory LLP. Reads were mapped on the hg19 human genome and quantified using CLC Genomics Workbench (QIAGEN) as described previously. 19 The level of gene expression was calculated using reads per kilobase per million reads (RPKM) and then normalized using the CLC Genomic Workbench software. In order to identify the genes differentially expressed as a result of OCIAD2 knockdown, the data were filtered according to absolute fold change of >2.0
As functional enrichment analysis, we performed reactome pathway and the Gene Ontology (GO) enrichment analysis using the Database for Annotation, Visualization, and Integrated Discovery (DAVID) (https://david.ncifcrf.gov) with P < .05. for differentially expressed genes.
2.12. Co‐expression analysis of OCIAD2
LinkedOmics (http://www.linkedomics.org/login.php) is a public database containing multiomics data and clinical data for 32 cancer types and a total of 11,158 patients from The Cancer Genome Atlas (TCGA). 20 Among the three analytic modules (LinkFinder, LinkInterpreter, and LinkCompare), the differentially expressed genes related to OCIAD2 were screened from the TCGA LUAD cohort (n = 515) on the Hi‐seq RNA platform by the LinkFinder module. Co‐expression of OCIAD2 was analyzed statistically using the Spearman's correlation coefficient and the results were visualized by volcano and scatter plot. To obtain the biological insights of OCIAD2, we used the LinkInterpreter to perform GO enrichment analysis by the gene set enrichment analysis (GSEA). The rank criterion was Falase Discovery Rate (FDR) < 0.05, P < .01, and the number of simulations was 5000.
3. RESULTS
3.1. GO enrichment analysis of mitochondria‐related genes co‐expressed with OCIAD2 in LUAD
As our former study suggests that OCIAD2 coexist with mitochondrial markers in LUAD cells, 9 we further investigated the association of OCIAD2 with mitochondria in a larger human cohort using public database. Initially, we used LinkedOmics database to analyze the co‐expressed genes of OCIAD2 in 515 LUAD cases. As presented in the volcano plot, 5064 genes (green dots) showed significant negative correlations with OCAID2, whereas 3436 genes (red dots) had significant positive correlations (Figure 1A). OCIAD2 was positively correlated with NDUFA1, SDHB, UQCRQ, and ATP5l (related to mitochondria electron chains) and MRPL54 and c19orf70 (related to mitochondrial translation and homeostasis), whereas negatively correlated with APAF‐1, FOXO3, BCL2L11, and TP53INP1 (related to proapoptotic initiators) and ATF6 and ERN1 (related to ER stress response) (Figure 1B). GO enrichment analysis by GSEA showed that the genes co‐expressed with OCIAD2 primarily participate in mitochondrial respiratory chain complex assembly (normalized enrichment score [NES]: 2.52, P < .001), protein localization to ER (NES: 2.40, P < .001), translational elongation (NES: 2.38, P < .001), and mitochondrial transport (NES: 1.79, P < .001) (Figure 1C,D). These data imply the importance of OCAID2 in mitochondrial function and support our previous findings.
FIGURE 1.
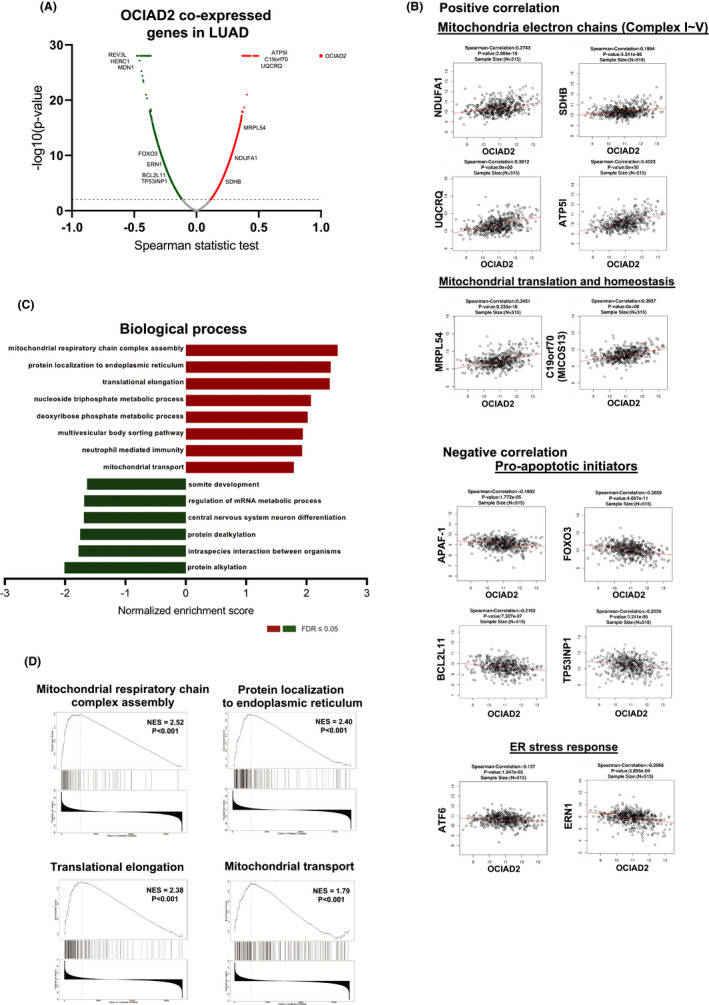
Gene ontology (GO) pathway enrichment analysis of OCIAD2 co‐expression genes in lung adenocarcinoma (LUAD). A, Co‐expressed genes of OCAID2 in LUAD obtained from the LinkedOmics database are shown as a volcano plot. Red indicates positively correlated genes and green indicates negatively correlated genes with OCIAD2. B, The Spearman‐correlation test for the correlation between OCIAD2 and the genes involved in the mitochondrial electron chain, mitochondrial translation and homeostasis, proapoptotic initiators, and endoplasmic reticulum (ER) stress response. C and D, The significantly enriched GO annotations (biological process) for OCIAD2 co‐expression genes in LUAD were analyzed by gene set enrichment analysis (GSEA). The x‐axis indicates the normalized enrichment score (NES) (FDR < 0.05, and P < .001)
3.2. Expression and subcellular localization of OCIAD2 in LUAD cells
We next examined OCIAD2 expression in vitro using PL16B (immortalized normal bronchial epithelium), PL16T (immortalized AIS), and three LUAD cell lines (A549, HCC827, and PC9). mRNA and protein expression of OCIAD2 was examined by quantitative RT‐PCR and Western blotting. As shown in Figure S1A,B the OCAID2 mRNA level was higher in PL16T and HCC827 than in PL16B. Consistently, OCIAD2 protein level was more highly expressed in PL16T and HCC827 than in PL16B. However, protein expression of OCIAD2 in A549 and PC9 was considerably high despite its low mRNA expression, implying that post‐translational modification might be involved. We also investigated the expression of OCIAD2 in fresh‐frozen tumor tissues and paired samples of noncancerous lung tissue from 12 patients. At least 10 of the 12 patients showed higher expression of OCIAD2 in tumor tissue than in noncancerous lung tissue, while OCIAD1 did not show tumor‐specific expression (Figure S1C).
Our previous study had shown that OCIAD2 is co‐localized with the mitochondrial marker, VDAC1, in A549 cells. 9 Here, we investigated the subcellular location of OCIAD2 by cell fractionation using HCC827 and A549 cells. This revealed that endogenous OCIAD2 was localized in the mitochondrial fraction and/or membrane fraction along with the mitochondrial marker Tom20 or sodium potassium ATPase (Figure 2A,B). Moreover, IF staining consistently indicated that endogenous OCIAD2 was localized mostly at mitochondria along with Tom20 in the cells (Figure 2C).
FIGURE 2.
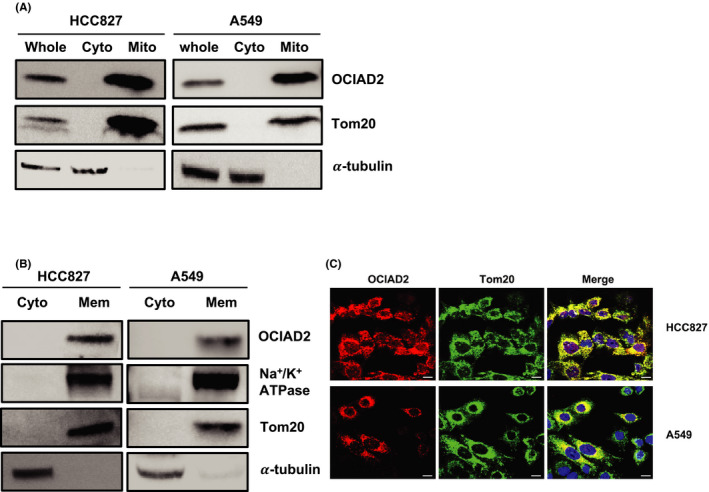
OCIAD2 is localized mainly at the mitochondrial membrane in lung adenocarcinoma cells. A and B, Subcellular location of OCIAD2 in HCC827 and A549 cells was examined by Western blotting (WB) using the mitochondria and cytoplasmic fractionation (A). Cytoplasmic and membrane fraction were subjected to WB. B, Na+/K+ ATPase, Tom20, and α‐tubulin were used as markers for membrane, mitochondria, cytoplasm, and internal control, respectively. Cyto, cytoplasm; Mito, mitochondria; Mem, membrane. C, Immunofluorescence for OCIAD2. Endogenous OCIAD2 (red) and Tom20 (green) were colocalized at mitochondria in HCC827 and A549 cells. DAPI (blue); scale bar: 10 μm
3.3. Suppression of OCIAD2 in LUAD cells leads to a decrease in the number of mitochondria and disruption of cristae formation
As OCIAD2 was localized at the mitochondrial membrane in LUAD cells, we hypothesized that OCIAD2 might relate to the morphology of mitochondria. Therefore, we next studied morphological changes in mitochondria by TEM 72 hours after transfection with siOCIAD2 into HCC827 and A549 cells. All of the three siOCIAD2 successfully suppressed the expression of OCIAD2 mRNA and protein in both cell lines (Figure S2). As siOCIAD2‐I showed the most effective suppression of cellular proliferation, we used it for further analysis.
As shown in Figure 3 and Figure S3A, although mitochondria were localized perinuclearly and their cristae were morphologically intact in the control cells, the mitochondria were evenly distributed in the cytoplasm, and the cristae were disrupted in the cells transfected with siOCIAD2 (Figure 3A,B and Figure S3A). Both the number of mitochondria per cell and the number of cristae per mitochondrion were significantly decreased after OCIAD2 knockdown in both HCC827 and A549 cells (Figure 3C‐F). Additionally, similar changes in mitochondrial morphology were also observed in immortalized AIS cells, PL16T (Figure S3). These results imply that OCIAD2 might be involved in mitochondria‐associated events from early‐stage tumors.
FIGURE 3.
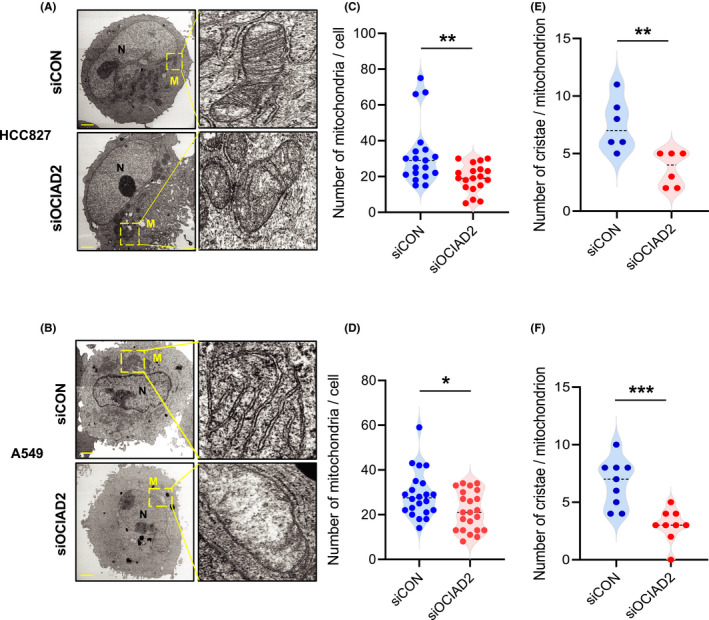
Impacts of OCIAD2 suppression on mitochondrial morphology in lung adenocarcinoma cells. A and B, Representative images of transmission electron microscopy (TEM) analysis showing mitochondria in HCC827 (A) and A549 (B) cells after siOCIAD2 transfection for 72 h. Scale bar: 2.0 μm. Yellow boxes indicate the mitochondria. N, nucleus; M, mitochondria. C‐F, The number of mitochondria in a cell after siOCIAD2 transfection for 72 h (HCC827, n = 19; A549, n = 22; t‐test **P < .01, *P < .05), and the number of cristae in a mitochondrion (HCC827, n = 6; A549, n = 9; t‐test ***P < .001) were quantified (C, E: HCC827; D, F: A549)
3.4. Suppression of OCIAD2 induces apoptosis in LUAD cells
The facts that OCIAD2 is significantly overexpressed in mitochondria of LUAD cells and that it affects mitochondrial morphology motivated us to investigate whether OCIAD2 regulates cellular phenotype including cell viability and apoptosis pathway. To clarify the impacts of OCIAD2 suppression on cell growth, proliferation, and apoptosis, we transfected siOCIAD2 or siCON into HCC827 and A549 cells. Knockdown of OCIAD2 significantly reduced the cell growth and proliferation of four LUAD cells (Figure 4A,B and Figures S4A,B, S5A, and S6A). Subsequently, we examined the expression of representative proteins related to apoptosis, such as cleaved caspase ‐3, ‐9, and PARP using Western blotting. Although the total amounts of PARP, caspase‐3, and caspase‐9 showed no significant change, the cleaved (activated) form of PARP, caspase‐3, and caspase‐9 increased after siOCIAD2 transfection. On the other hand, no significant change was detected in the amount of either total or cleaved caspase‐8 (a major component of the extrinsic apoptosis pathway) (Figure 4C and Figures S4C, S5B, and S6B).
FIGURE 4.
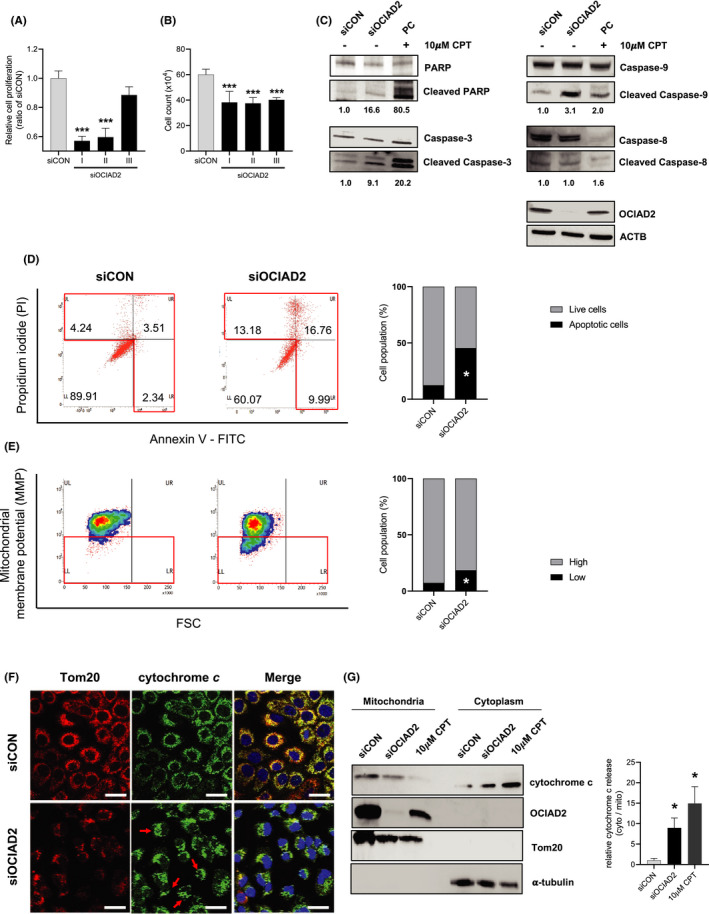
Knockdown of OCIAD2 induces mitochondrial apoptosis through impairment of the mitochondrial membrane potential and cytochrome c release in lung adenocarcinoma cells. A, HCC827 cells were transfected with three kinds of siOCIAD2 for 72 h, and cellular proliferation was examined using a WST‐8 assay (n = 8, one‐way ANOVA ***P <.001). B, Cell growth was examined after siOCIAD2 transfection into the cells for 72 h. Cells were counted with a hematocytometer (n = 4, one‐way ANOVA ***P < .001). C, Expression of PARP, cleaved PARP, caspase‐3, cleaved caspase‐3, caspase‐9, and cleaved caspase‐9 as representative apoptosis‐related proteins were analyzed using total protein extracted from the cells after siOCIAD2 transfection for 72 h. The cells treated with apoptosis inducer, camptothecin (CPT, 10 μmol/L) for 24 h were used as positive control (PC). Each of the cleaved targets was quantified and normalized by total protein band with Image J software. D, After the cells had been transfected with siOCIAD2 or siCON for 72 h and treated with 10 μmol/L CPT, apoptosis levels were detected by staining with annexin V and PI. The cells with high PI and/or high annexin V were considered to be apoptotic. The proportional graph indicates the average percentage of the live and apoptotic cells population (n = 4, t‐test *P < .05). E, Mitochondrial membrane potential was measured using tetramethylrhodamine methyl ester (TMRM) assay in HCC827 cells. Positive control was stained after 50 μmol/L carbonyl cyanide 3‐chlorophenylhydrazone (CCCP) treatment. The cells were transfected with siOCIAD2 or siCON, stained with TMRM and measured by flow cytometry. The representative density plot and quantified graph showed the mean percentage of cells with high or low mitochondrial membrane potential (n = 3, t‐test *P < .05). F, Release of cytochrome c induced by knockdown of OCIAD2 in HCC827 cells. Immunofluorescence staining for cytochrome c using the cells transfected with siOCIAD2 for 72 h. Tom20 (red), cytochrome c (green), and DAPI (blue). Red arrow: release of cytochrome c, diffused staining pattern. Scale bar: 25 μm. G, After the cells had been transfected with siOCIAD2 or siCON and treated with 10 μmol/L camptothecin (CPT), mitochondrial and cytoplasmic fractionation was performed. The distribution of cytochrome c was analyzed with Western blotting (WB). Three independent experiments were carried out, and each band size was quantified with Image J software (t‐test *P < .05, **P < .01, ***P < .001). Error bars represent mean ± SE
Along with the activation of caspase cascades, we further examined apoptosis using the Annexin V‐FITC and PI assay in both HCC827 and A549 cells after siOCIAD2 transfection. As shown in Figure 4D and Figure S4D, suppression of OCIAD2 increased apoptotic cell population (29.93%) in comparison with the control (10.09%). Our results suggested that knockdown of OCIAD2 in HCC827 can suppress cell proliferation and viability via apoptosis induction.
Furthermore, as Sinha et al 5 have reported that OCIAD2 is associated with cell migration in HEK293 cells, we evaluated the effect of OCIAD2 suppression on cell migration and invasion ability using the wound healing and transwell invasion assays. The wound healing assay showed that the migration of the cells with OCIAD2 suppression was reduced by 80% (HCC827) and 30% (A549), respectively, relative to control cells (P < .05, P < .001) (Figure S7A,C). In the transwell invasion assay, the invasiveness of the cells transfected with siOCIAD2 was significantly lower than that of the control in both cases (P < .05, P < .01) (Figure S7B,D). These results showed that OCIAD2 contributes to tumor progression such as cell migration and invasion.
3.5. Knockdown of OCIAD2 in LUAD cells leads to impairment of MMP and release of cytochrome c
MMP is an essential factor for mitochondrial homeostasis and mitochondria‐related intrinsic apoptosis. It has been demonstrated that opening of the mitochondrial permeability transition pore (MPTP) induces the depolarization of MMP and subsequent release of cytochrome c into the cytoplasm. 21
To measure the level of MMP, HCC827 and A549 cells were transfected with siOCIAD2 for 72 hours and stained with TMRM, which distinguish healthy, non‐apoptotic cell populations from non‐healthy cell populations that are transitioning into an apoptotic state. TMRM selectively enters the healthy mitochondria of the cells where it accumulates and fluoresces orange upon excitation. However, when the MMP collapses in apoptotic cells, TMRM no longer accumulates inside the mitochondria. Flow cytometry analysis revealed that the cells with OCIAD2 suppression showed significantly lower TMRM expression than the control (11%, HCC827 or 30%, A549 decreased in average cell population) indicating that OCIAD2 suppression induced the depolarization of MMP (P < .05) (Figure 4E and Figure S4E).
Cytochrome c is a key component of the mitochondrial electron transport chain (ETC). 22 In healthy cells, cytochrome c is localized in the mitochondrial intermembrane space, but it is often released into the cytoplasm by several apoptotic stimuli during the early stage of apoptosis caused by collapse of the MMP. 21
In order to investigate the release of cytochrome c in OCIAD2‐depleted cells, we examined the subcellular localization of cytochrome c by IF. As shown in Figure 4F and Figures S4F and S5, the staining pattern in HCC827 and A549 cells with OCIAD2 knockdown was more diffuse, consistent with translocalization of cytochrome c into the cytoplasm. In control cells, however, cytochrome c was localized at mitochondria, showing a dot‐like pattern. In addition, we performed cell fractionation–based Western blotting to compare the amount of released cytochrome c between cells with and without OCIAD2 knockdown. Although cytochrome c was abundant in the mitochondrial fraction in the control cells, the amount of cytoplasmic cytochrome c was elevated due to release from mitochondria in OCIAD2‐suppressed cells (Figure 4G and Figure S4G).
3.6. Association of OCIAD2 with mitochondrial apoptosis signaling in LUAD cells
In order to investigate the molecular network of OCIAD2 and mitochondrial apoptosis in detail, we performed RNA sequencing analysis using A549, HCC827, and PC9 cells transfected with siOCIAD2. We identified 773, 378, and 703 differentially expressed genes (absolute fold change of >2.0) between the cells transfected with siOCIAD2 and siCON in A549, HCC827, and PC9 cells, respectively. Reactome pathway analysis showed that the differentially expressed genes could be categorized into 15 functional pathways. Among them, of particular interest were the pathways related to FOXO‐mediated transcription, cytochrome c release regulated by TP53, and ER stress, which are known to play important roles in the cellular apoptosis pathway. These results indicate that OCIAD2 is closely related to apoptosis in LUAD cells (Figure 5A).
FIGURE 5.
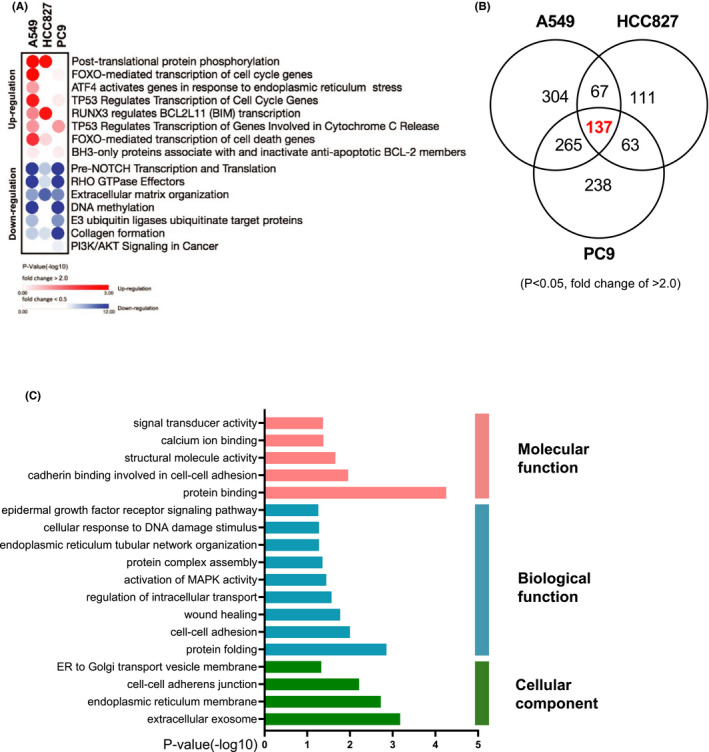
Transcriptional profiling of OCIAD2 silencing in lung adenocarcinoma cells. A, Bubble plot illustrating the 15 functional pathways in the enriched reactome pathway analysis of the differentially expressed genes in A549, HCC827, and PC9 (red: upregulated, blue: downregulated) (P < .05 and a fold change difference of >2.0). B, Venn diagram indicating the differentially expressed genes in A549, HCC827, and PC9 cells; 137 genes were common in three cells (P < .05 and a fold change of >2.0). C, Gene Ontology (GO) enrichment analysis of those common genes showing a significantly enriched pathway (P < .05)
Venn diagram showed 137 genes whose expression was commonly altered in A549, HCC827, and PC9 (Figure 5B). Those commonly altered genes were subjected to the GO enrichment analysis. The most enriched GO terms were related to protein binding and calcium ion binding (molecular function); protein folding, cell‐cell adhesion, protein complex assembly, and cellular response to the DNA damage signaling pathway (biological function); and extracellular exosome, cell‐cell adherens junction, and ER to Golgi transport vesicle membrane (cellular component) (Figure 5C).
4. DISCUSSION
Previous reports have shown that OCIAD2 is a prognostic biomarker in LUAD and ovarian malignant tumors. 4 , 9 , 10 In this study, we first confirmed the tumor‐specific expression of OCIAD2 in human LUAD tissues and cell lines (Figure S1). Although earlier studies had suggested that OCIAD1 and OCIAD2 are highly expressed in ovarian cancer, 5 our present data suggest that only OCIAD2 shows distinct tumor‐specific expression in LUAD (Figure S1).
The expression of some tumor‐related genes is epigenetically regulated, such as that of stratifin (SFN), which facilitates early progression of LUAD. 23 Although it is still a debatable issue, we have recently demonstrated that aberrant overexpression of OCIAD2 is also caused by CpG hypomethylation, and that its methylation status is significantly associated with poorer outcome in LUAD patients (personal communication).
Here, we showed that OCIAD2 is localized at the mitochondrial membrane using subcellular fractionation, Western blotting, and IF staining (Figure 2). Furthermore, we also found suppression of OCIAD2 led to a marked morphological change of mitochondria (Figure 3 and Figure S3). Although no previous reports have indicated the role of OCIAD2 in mitochondrial morphology, there is evidence to suggest that OCIAD1 might indeed have such a role, as well as maintaining the stemness of human embryonic stem cells through interaction with mitochondrial proteins such as ETC. 23 Accordingly, we speculated that OCIAD2, like OCIAD1, might help to stabilize or maintain mitochondrial ETC in LUAD cells. However, further investigation is required to clarify whether OCIAD2 is directly or indirectly involved in maintaining the morphological stability of mitochondria.
We also found that cell proliferation, migration, and invasion were significantly suppressed in the absence of OCIAD2 in the A549 and HCC827 cells (Figure 4 and Figures S4, S7), consistent with a former publication. 5 Considering the cleavage of only intrinsic apoptotic factors but not extrinsic factors, OCIAD2 might contribute to tumor progression through inhibiting mitochondria‐initiated intrinsic apoptosis. Our results demonstrated that inhibition of OCIAD2 depolarizes the MMP in LUAD cells, leading to the release of cytochrome c from mitochondria into the cytoplasm (Figure 4 and Figures S4, S5). As mitochondrially mediated processes such as transmembrane depolarization, release of cytochrome c, and activation of other apoptosis‐related factors are involved in the intrinsic apoptosis pathway, 21 induction of cancer cell death by stimulating these factors might be therapeutically applicable. Several previous reports have indicated that photodynamic therapy (PDT) disrupts the MMP, causing damage to cancer cells and inducing the release of cytochrome c, which in turn activates caspase, leading to apoptosis. 24 , 25 , 26 As inhibition of OCIAD2 is expected to induce similar events, we believe that the cancer‐specific protein OCIAD2 might be useful as not only a diagnostic marker but also a therapeutic target.
We also investigated the molecular network of OCIAD2 in LUAD cells through RNA‐seq analysis. We revealed that the genes upregulated by inhibition of OCIAD2 were significantly associated with unique pathways such as FOXO‐mediated transcription, pro‐apoptotic initiator, cell cycle, ER stress, and TP53. On the other hand, downregulated genes were primarily enriched in NOTCH, DNA damage, PI3K/AKT, and migration signaling pathway. Among the upregulated genes, BCL2L11 (BIM), BBC3 (PUMA), and BMF are BCL‐2 family proteins which make up a surveillance network that regulates mitochondria or intrinsic apoptosis. Induction of apoptosis by OCIAD2 inhibition upregulated these pro‐apoptotic genes, presumably promoting serial apoptosis‐related events such as the depolarization of MMP and activation of cytochrome c–releasing caspase 27 (Figure 5 and Figure S8).
Moreover, our RNA‐seq results show suppression of OCIAD2 increased tumor protein 53–derived nuclear protein 1 (TP53INP1) and decreased mouse double‐minute 2 (MDM2). TP53INP1 is one of the target genes of the tumor suppressor p53, which regulates stress response by p53 and appears to be a key factor in p53‐mediated cell cycle arrest and apoptosis in other various cell types. 28 On the other hand, MDM2 can deregulate the stability of p53 via the ubiquitin‐proteasome pathway. 29 It is speculated that inhibition of OCIAD2 in LUAD cells affects the level of these genes, thereby upregulating the activation of p53 and its target genes such as pro‐apoptotic initiators (BIM, PUMA, and BMF) and cell cycle (CDKN1A) genes. In addition, although OCIAD2 exhibits the opposite phenomenon to OCIAD1 and p53‐MDM2, which are proteins of the same OCIAD family, it is highly likely that OCIAD2 is involved in the regulation of P53‐MDM2. 30
In neuronal tumor cells, Forkhead Box O3 (FOXO3) induces mitochondrial membrane permeabilization via induction of the pro‐apoptosis genes such as BBC3 (PUMA), which is necessary for FOXO3‐induced apoptosis. 31 , 32 As FOXO3 was also upregulated in the OCIAD2‐suppressed cells in our results, FOXO3‐induced apoptosis might be closely related to the change in MMP and release of cytochrome c triggered by OCIAD2 inhibition in LUAD.
Furthermore, we also found that OCIAD2 is related to the ER stress pathway (Figure 5A,C and Figure S8). ER is one of the key organelles involved in correct protein folding, calcium homeostasis, and lipid metabolism, 33 and several types of internal or external stimuli, which trigger ER stress, could lead to impairment of homeostasis. 34 It has been reported that several anticancer drugs induce apoptosis through accumulation of intracellular reactive oxygen species (ROS) associated with the unfolded protein response (UPR) which is caused by ER stress. 35 It is possible that OCIAD2 protects the cell from ER stress and thus inhibits apoptosis. This idea might be supported by a former report showing the presence of OCIAD2 in the MAM. 6
Analysis of the database using a larger human cohort showed that most genes coexpressed with OCIAD2 in LUAD were clearly associated with mitochondria or apoptosis. Besides, among the genes significantly upregulated by OCIAD2 inhibition in RNA‐seq results, BCL2L11 (pro‐apoptotic initiator) and TP53INP1 (related to p53) consistently showed negative correlations with the LinkedOmics data (Figure 1 and Figure S8).
The results of LinkedOmics analysis and our RNA‐seq were verified using human LUAD tissues from 8 patients (4 cases with high OCIAD2 expression, and 4 cases with low OCIAD2 expression) by Western blotting. We selected ATP5L, UQCRQ, and BCL2L11 from the LinkedOmics results and MDM2 and AKT from our RNA‐seq analysis as genes which had close association with OCIAD2 and analyzed their protein expression and correlation with OCIAD2 expression.
As shown in Figure S9, ATP5L and UQCRQ, representative mitochondrial electron chains, showed a positive correlation with OCIAD2 expression, consistent with the LinkedOmics results, although the correlation was not significant in UQCRQ. On the other hand, proapoptotic initiator BCL2L11 (BIM) showed positive but not significant correlation with OCIAD2, which is the opposite tendency to the LinkedOmics results.
To validate the RNA‐seq results, we examined AKT and MDM2, genes downregulated after inhibition of OCIAD2 in LUAD cells. Although AKT showed a tendency of positive association consistent with the RNA‐seq results, MDM2 did not show any clear correlation with OCAID2 (Figure S9). We consider we could partially reproduce the LinkedOmics results and our RNA‐seq results.
Taken together, our results suggest that OCIAD2 might play a role in maintaining the structure and function of mitochondria in LUAD cells, and that this in turn might underlie the antiapoptotic activity of OCIAD2. Although further investigation will be needed to clarify the molecular mechanism in detail, OCIAD2 might regulate the mitochondria‐mediated intrinsic apoptosis pathway in LUAD (Figure 6). Given the association between aberrantly high OCIAD2 expression and poorer outcome in LUAD, our present findings suggest that OCIAD2 inhibition may be a promising therapeutic strategy which can specifically target cancer cells and induce apoptosis in LUAD.
FIGURE 6.
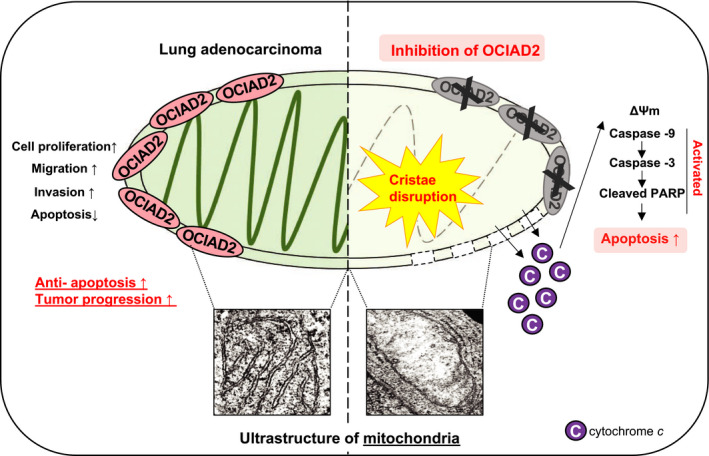
Hypothetical model of the OCIAD2 function in lung adenocarcinoma. In lung adenocarcinoma, OCIAD2 maintains the mitochondria integrity and promotes tumor progression by acting as an anti‐apoptotic factor. However, inhibition of OCIAD2 causes fatal defects in the mitochondria and also induces mitochondrial apoptosis by depolarizing the mitochondrial membrane potential, releasing the cytochrome c, and activating the caspase cascades in lung adenocarcinoma cells
CONFLICTS OF INTEREST
The authors declare that they have no conflicts of interest in relation to this study.
AUTHOR CONTRIBUTION
J. Hong and A. Shiba‐Ishii performed the study concept and design. J. Hong, Y. Kim, A. Shiba‐Ishii, M. Noguchi, and N. Sakamoto participated in acquisition of data (acquired and managed patients, provided facilities, etc.). J. Hong, Y. Kim, A. Shiba‐Ishii, and M. Noguchi conducted the analysis and interpretation of data (eg, statistical analysis). All authors read and approved the final manuscript.
Supporting information
Fig S1‐9
Supplementary Material
ACKNOWLEDGEMENTS
We are grateful to Prof. Masafumi Muratani for his support with RNA sequencing analysis using NextSeq 500 (Illumina) at Tsukuba Transborder Medical Research Center and Tsukuba i‐laboratory LLP (Tsukuba, Ibaraki, Japan).
Hong J, Shiba‐Ishii A, Kim Y, Noguchi M, Sakamoto N. Ovarian carcinoma immunoreactive antigen domain 2 controls mitochondrial apoptosis in lung adenocarcinoma. Cancer Sci. 2021;112:5114–5126. 10.1111/cas.15160
REFERENCES
- 1. Siegel RL, Miller KD, Jemal A. Cancer statistics, 2020. CA Cancer J Clin. 2020;70(1):7‐30. [DOI] [PubMed] [Google Scholar]
- 2. Siegel RL, Miller KD, Fuchs HE, Jemal A. Cancer statistics, 2021. CA Cancer J Clin. 2021;71(1):7‐33. [DOI] [PubMed] [Google Scholar]
- 3. Noguchi M, Morikawa A, Kawasaki M, et al. Small adenocarcinoma of the lung. Histologic characteristics and prognosis. Cancer. 1995;75(12):2844‐2852. [DOI] [PubMed] [Google Scholar]
- 4. Ishiyama T, Kano J, Anami Y, et al. OCIA domain containing 2 is highly expressed in adenocarcinoma mixed subtype with bronchioloalveolar carcinoma component and is associated with better prognosis. Cancer Sci. 2007;98(1):50‐57. [DOI] [PMC free article] [PubMed] [Google Scholar]
- 5. Sinha S, Bheemsetty VA, Inamdar MS. A double helical motif in OCIAD2 is essential for its localization, interactions and STAT3 activation. Sci Rep. 2018;8(1):7362. [DOI] [PMC free article] [PubMed] [Google Scholar]
- 6. Han J, Jung S, Jang J, et al. OCIAD2 activates gamma‐secretase to enhance amyloid beta production by interacting with nicastrin. Cell Mol Life Sci. 2014;71(13):2561‐2576. [DOI] [PMC free article] [PubMed] [Google Scholar]
- 7. Luo LY, Soosaipillai A, Diamandis EP. Molecular cloning of a novel human gene on chromosome 4p11 by immunoscreening of an ovarian carcinoma cDNA library. Biochem Biophys Res Commun. 2001;280(1):401‐406. [DOI] [PubMed] [Google Scholar]
- 8. Itoguchi N, Nakagawa T, Murata Y, et al. Immunocytochemical staining for stratifin and OCIAD2 in bronchial washing specimens increases sensitivity for diagnosis of lung cancer. Cytopathology. 2015;26(6):354‐361. [DOI] [PubMed] [Google Scholar]
- 9. Sakashita M, Sakashita S, Murata Y, et al. High expression of ovarian cancer immunoreactive antigen domain containing 2 (OCIAD2) is associated with poor prognosis in lung adenocarcinoma. Pathol Int. 2018;68(11):596‐604. [DOI] [PubMed] [Google Scholar]
- 10. Nagata C, Kobayashi H, Sakata A, et al. Increased expression of OCIA domain containing 2 during stepwise progression of ovarian mucinous tumor. Pathol Int. 2012;62(7):471‐476. [DOI] [PubMed] [Google Scholar]
- 11. Nikas JB. A mathematical model for short‐term vs. long‐term survival in patients with glioma. Am J Cancer Res. 2014;4(6):862‐873. [PMC free article] [PubMed] [Google Scholar]
- 12. Nikas JB. Independent validation of a mathematical genomic model for survival of glioma patients. Am J Cancer Res. 2016;6(6):1408‐1419. [PMC free article] [PubMed] [Google Scholar]
- 13. Kulis M, Heath S, Bibikova M, et al. Epigenomic analysis detects widespread gene‐body DNA hypomethylation in chronic lymphocytic leukemia. Nat Genet. 2012;44(11):1236‐1242. [DOI] [PubMed] [Google Scholar]
- 14. Wu D, Yang X, Peng H, et al. OCIAD2 suppressed tumor growth and invasion via AKT pathway in hepatocelluar carcinoma. Carcinogenesis. 2017;38(9):910‐919. [DOI] [PMC free article] [PubMed] [Google Scholar]
- 15. Shimada A, Kano J, Ishiyama T, et al. Establishment of an immortalized cell line from a precancerous lesion of lung adenocarcinoma, and genes highly expressed in the early stages of lung adenocarcinoma development. Cancer Sci. 2005;96(10):668‐675. [DOI] [PMC free article] [PubMed] [Google Scholar]
- 16. Kim Y, Shiba‐Ishii A, Nakagawa T, et al. Stratifin regulates stabilization of receptor tyrosine kinases via interaction with ubiquitin‐specific protease 8 in lung adenocarcinoma. Oncogene. 2018;37(40):5387‐5402. [DOI] [PubMed] [Google Scholar]
- 17. Shiba‐Ishii A, Hong J, Hirokawa T, et al. Stratifin inhibits SCF(FBW7) formation and blocks ubiquitination of oncoproteins during the course of lung adenocarcinogenesis. Clin Cancer Res. 2019;25(9):2809‐2820. [DOI] [PubMed] [Google Scholar]
- 18. Reynolds ES. The use of lead citrate at high pH as an electron‐opaque stain in electron microscopy. J Cell Biol. 1963;17:208‐212. [DOI] [PMC free article] [PubMed] [Google Scholar]
- 19. Kosibaty Z, Murata Y, Minami Y, Noguchi M, Sakamoto N. ECT2 promotes lung adenocarcinoma progression through extracellular matrix dynamics and focal adhesion signaling. Cancer Sci. 2021;112(2):703‐714. [DOI] [PMC free article] [PubMed] [Google Scholar]
- 20. Vasaikar SV, Straub P, Wang J, Zhang B. LinkedOmics: analyzing multi‐omics data within and across 32 cancer types. Nucleic Acids Res. 2018;46(D1):D956‐D963. [DOI] [PMC free article] [PubMed] [Google Scholar]
- 21. Wang C, Youle RJ. The role of mitochondria in apoptosis*. Annu Rev Genet. 2009;43:95‐118. [DOI] [PMC free article] [PubMed] [Google Scholar]
- 22. Ott M, Robertson JD, Gogvadze V, Zhivotovsky B, Orrenius S. Cytochrome c release from mitochondria proceeds by a two‐step process. Proc Natl Acad Sci USA. 2002;99(3):1259‐1263. [DOI] [PMC free article] [PubMed] [Google Scholar]
- 23. Shetty DK, Kalamkar KP, Inamdar MS. OCIAD1 controls electron transport chain Complex I activity to regulate energy metabolism in human pluripotent stem cells. Stem Cell Rep. 2018;11(1):128‐141. [DOI] [PMC free article] [PubMed] [Google Scholar]
- 24. Grasso D, Zampieri LX, Capeloa T, Van de Velde JA, Sonveaux P. Mitochondria in cancer. Cell Stress. 2020;4(6):114‐146. [DOI] [PMC free article] [PubMed] [Google Scholar]
- 25. Chiu SM, Oleinick NL. Dissociation of mitochondrial depolarization from cytochrome c release during apoptosis induced by photodynamic therapy. Br J Cancer. 2001;84(8):1099‐1106. [DOI] [PMC free article] [PubMed] [Google Scholar]
- 26. Vantieghem A, Xu Y, Declercq W, et al. Different pathways mediate cytochrome c release after photodynamic therapy with hypericin. Photochem Photobiol. 2001;74(2):133‐142. [DOI] [PubMed] [Google Scholar]
- 27. Hata AN, Engelman JA, Faber AC. The BCL2 family: key mediators of the apoptotic response to targeted anticancer therapeutics. Cancer Discov. 2015;5(5):475‐487. [DOI] [PMC free article] [PubMed] [Google Scholar]
- 28. Tomasini R, Samir AA, Carrier A, et al. TP53INP1s and homeodomain‐interacting protein kinase‐2 (HIPK2) are partners in regulating p53 activity. J Biol Chem. 2003;278(39):37722‐37729. [DOI] [PubMed] [Google Scholar]
- 29. Iwakuma T, Lozano G. MDM2, an introduction. Mol Cancer Res. 2003;1(14):993‐1000. [PubMed] [Google Scholar]
- 30. Sinha S, Dwivedi TR, Yengkhom R, et al. Asrij/OCIAD1 suppresses CSN5‐mediated p53 degradation and maintains mouse hematopoietic stem cell quiescence. Blood. 2019;133(22):2385‐2400. [DOI] [PubMed] [Google Scholar]
- 31. Hagenbuchner J, Ausserlechner MJ. Mitochondria and FOXO3: breath or die. Front Physiol. 2013;4:147. [DOI] [PMC free article] [PubMed] [Google Scholar]
- 32. Obexer P, Hagenbuchner J, Unterkircher T, et al. Repression of BIRC5/survivin by FOXO3/FKHRL1 sensitizes human neuroblastoma cells to DNA damage‐induced apoptosis. Mol Biol Cell. 2009;20(7):2041‐2048. [DOI] [PMC free article] [PubMed] [Google Scholar]
- 33. Wang G, Yang ZQ, Zhang K. Endoplasmic reticulum stress response in cancer: molecular mechanism and therapeutic potential. Am J Transl Res. 2010;2(1):65‐74. [PMC free article] [PubMed] [Google Scholar]
- 34. Wang WA, Groenendyk J, Michalak M. Endoplasmic reticulum stress associated responses in cancer. Biochim Biophys Acta. 2014;1843(10):2143‐2149. [DOI] [PubMed] [Google Scholar]
- 35. Lu JJ, Chen SM, Zhang XW, Ding J, Meng LH. The anti‐cancer activity of dihydroartemisinin is associated with induction of iron‐dependent endoplasmic reticulum stress in colorectal carcinoma HCT116 cells. Invest New Drugs. 2011;29(6):1276‐1283. [DOI] [PubMed] [Google Scholar]
Associated Data
This section collects any data citations, data availability statements, or supplementary materials included in this article.
Supplementary Materials
Fig S1‐9
Supplementary Material