Abstract
Extracellular vesicles (EV) have been emerging as potential biomarkers for disease monitoring. In particular, tumor‐derived EV (TDE) are known to carry oncogenic miRNA, so they can be used for diagnosis of early cancer by analyzing the expression levels of EV‐miRNA circulating in the blood. Here, using our novel microfluidic device, we rapidly and selectively isolate cancerous EV expressing breast cancer‐derived surface markers CD49f and EpCAM within 2 minutes. Based on seven candidates of miRNA nominated from The Cancer Genome Atlas (TCGA) database, the expression levels of miRNA in TDE were validated in a total of 82 individuals, including 62 breast cancer patients and 20 healthy controls. Among seven candidates, four miRNAs (miR‐9, miR‐16, miR‐21, and miR‐429) from the EV were highly elevated in early‐stage breast cancer patients compared with healthy donors. The combination of significant miRNAs from specific EV has high sensitivities of 0.90, 0.86, 0.88, and 0.84 of the area under the receiver operating characteristic curve (AUC) in each subtype (luminal A, luminal B, HER‐2, and triple‐negative) of early‐stage breast cancer. Our results suggest that the combination of four miRNA signatures of specific EV could serve as a sensitive and specific biomarker and enable early diagnosis of breast cancer using liquid biopsy.
Keywords: biomarker, early‐stage breast cancer, extracellular vesicles, liquid biopsy, microRNA
A new combination of miRNA from cancer‐specific extracellular vesicles was proposed for the highly sensitive and specific diagnosis of early‐stage breast cancer in association with a microfluidic‐based immuno‐isolation technique. These findings suggest that miRNA in EV could be used as important biomarkers for the early detection of breast cancer and identification of cancer subtype.
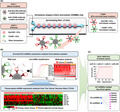
1. INTRODUCTION
MicroRNA (miRNA) is a small non–coding RNA that can control the expression of its target mRNA and is involved in various physiological and developmental processes of cells. 1 The miRNA expression levels are frequently altered in cancer, thereby contributing to tumor growth, invasion, angiogenesis, and immune evasion. 2 Accumulating evidence over the past decade has suggested that primary tumors inevitably release miRNA into the body fluids during their growth and death phases. 3 Interestingly, a similar pattern of miRNA expression between the primary tumor and plasma has been observed in the same patient. Accordingly, liquid biopsies for detecting miRNA in plasma, which are widely accepted in the clinic, have potential in cancer diagnostics. 4 , 5 Circulating miRNAs exist in plasma in various forms, such as free miRNA, lipoproteins‐miRNA complexes, and miRNA contained in extracellular vesicles (EV). 6 The EV, nanometer‐sized lipid bilayer vesicles released by all the cells, are not only well known as the key player of cell‐cell communications but also carry various biomarkers, such as protein, mRNA, and miRNA. 7 The miRNAs contained in EV have a longer half‐life in the plasma compared to the other two types of miRNA because the lipid membrane of EV protects miRNA from ribonuclease degradation. 8 Moreover, tumor‐derived EV (TDE) and their cargoes have high specificity to cancer cells because they reflect the characteristics of the origin. Therefore, EV containing miRNA have been proposed as an ideal source for cancer diagnosis based on miRNA expression pattern analysis.
Because the EV containing miRNA are surrounded by abundant miRNA in the plasma, an essential step to analyze EV‐derived miRNA for cancer diagnosis as a liquid biopsy is to purify and enrich the cancer‐associated EV from the plasma. 9 , 10 The most widely used method for isolation of EV, ultracentrifugation (UC), is time‐consuming and has low isolation efficiency and a lack of selectivity from cancer‐associated EV. 11 Although the purification methods for EV based on affinity capture with the surface epitopes of cancer cells have been exploited to overcome the limitation of the selectivity, it remains a tedious process, including binding, washing, and enrichment. 12 Microfluidics can be a satisfactory solution for the isolation of TDE because they result in high throughput, high efficiency, and high selectivity by providing continuous flow and engineered environments for molecular reactions. 13 Previously, we introduced a novel microfluidic chip for rapid and selective isolation of tumor‐associated EV and demonstrated its clinical applicability in breast cancer patients. 14 Using breast tumor‐derived proteins (EpCAM and CD49f), this microfluidic chip enables the selection of two types of EV within 2 minutes.
Herein, we have isolated cancer‐specific EV via a novel microfluidic chip and profiled EV‐miRNA based on seven candidate miRNA biomarkers, which were found in The Cancer Genome Atlas (TCGA) database (miR‐9, miR‐16, miR‐155, miR‐21, miR‐429, miR‐96, and miR‐128). Among them, the combination of four miRNAs (miR‐16, miR‐21, miR‐429, and miR‐96) demonstrated a significant increase in diagnostic sensitivity in early‐stage breast cancer and successfully discriminated breast cancer subtypes (Figure 1). Taken together, our results are expected to help researchers seeking new biomarkers for EV‐based cancer diagnostics.
FIGURE 1.
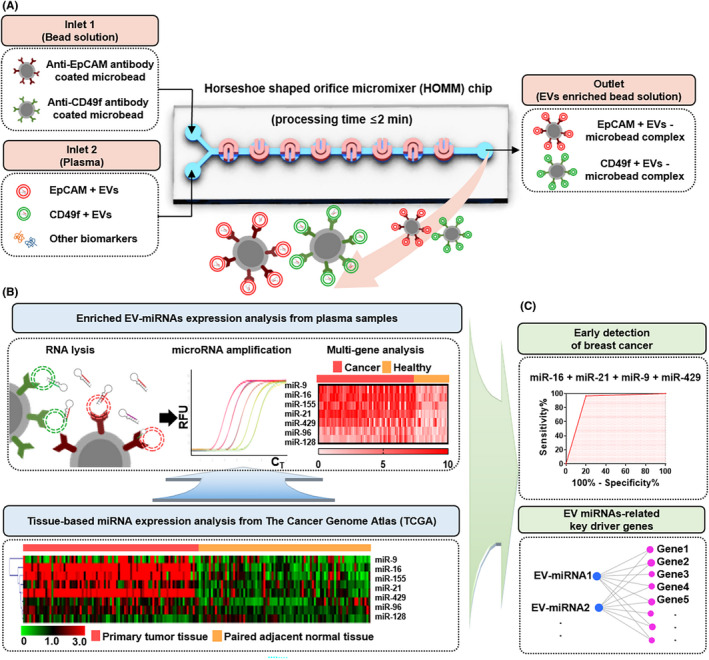
A, Schematic illustration of EpCAM and CD49f expressing extracellular vesicles (EV) isolation from prepared plasma sample using HOMM microfluidic chip. B, Profiling of miRNA extracted from enriched EV using real‐time PCR. Identification of dysregulated miRNA in paired breast cancer and adjacent normal tissues from the TCGA database. Hierarchical clustering using Euclidean distance was performed to graphically show differences in miRNA expression between primary tumor and adjacent normal tissues. C, Evaluation of diagnostic potential of multi‐miRNA panel in EV from breast cancer patients’ plasma. Key driver genes of EV‐miRNA and their carcinogenic function
2. MATERIALS AND METHODS
2.1. Preparation of cells and clinical samples
Four breast cancer cell lines (MCF‐7, BT‐474, SK‐BR‐3, and MDA‐MB‐231) were obtained from the ATCC. These cells are well characterized as reflecting heterogeneous subtypes: luminal A for MCF‐7, luminal B for BT‐474, HER‐2 for SK‐BR‐3, and triple‐negative breast cancer (TNBC) for MDA‐MB‐231. Breast cancer cells were grown to 70‐80% confluency in RPMI medium with 10% FBS. Media were removed, and cells were rinsed three times with PBS and then grown in serum‐depleted media. After 48 hours of incubation at 37°C with 5% CO2, conditioned media were harvested and centrifuged once at 600 g for 30 minutes to eliminate cells. EV were further concentrated from cell‐free supernatants using a 30 K Macrosep Advance Centrifugal Device (Pall Life Science).
A total of 82 plasma samples were collected in accordance with the guidelines of the independent ethics committee at the College of Medicine Yonsei University (IRB No. 4‐2020‐0350). Informed consent for the use of blood samples for research purposes was obtained from patients. To evaluate plasma sample quality, hemolysis was assessed before the isolation of EV. Details of the 82 individuals, including 62 patients with breast cancer and 20 healthy controls, are shown in Table 1.
TABLE 1.
Clinical information for breast cancer patients and healthy controls
| Breast cancer patients (n = 62) | Healthy control (n = 20) | |
|---|---|---|
| Age (y) | ||
| <50 | 31 (50.0) | 10 (50.0) |
| ≥50 | 31 (50.0) | 10 (50.0) |
| Stage | ||
| Early stage | 55 (88.7) | |
| Locally advanced stage | 7 (11.3) | |
| Tumor size | ||
| <2 cm | 42 (67.7) | |
| ≥2 cm | 20 (32.3) | |
| Lymph node metastasis | ||
| No | 51 (82.3) | |
| Yes | 11 (17.7) | |
| Subtypes | ||
| Luminal A | 17 (31.8) | |
| Luminal B | 14 (18.2) | |
| HER‐2 | 16 (27.3) | |
| Triple negative | 15 (22.7) | |
2.2. Design of microfluidic chip and isolation of extracellular vesicles
This microfluidic chip consists of 150 continuous horseshoe‐shaped channels to enhance the collision between EV and tumor‐specific antibody‐coated microbeads, thereby increasing the chances for binding interactions. Inside the microfluidic chip, tumor‐specific EV from culture medium or plasma were captured and isolated with both the tumor‐specific surface marker CD49f and epithelial cell‐specific marker (EpCAM) within 2 minutes (Figure 1A). After running the microfluidic chip, the microbeads carrying tumor‐specific EV were centrifuged and the supernatant was removed. Then, the suspension buffer (Invitrogen, Pleasanton, CA, USA) was added to the enriched microbeads to store tumor‐specific EV while reducing the degradation of RNA (Figure 1B).
2.3. Characterization of the isolated extracellular vesicles
Specimens were fixed for 24 hours in Karnovsky’s fixative (2% glutaraldehyde, 2% paraformaldehyde in 0.1 M phosphate buffer, pH 7.4) and washed twice for 30 minutes in 0.1 M PB. They were post–fixed with 1% OsO4 for 2 hours and dehydrated in ascending gradual series (50 – 100%) of ethanol using a Critical Point Dryer (CPD300, LEICA,). They were coated with platinum using an ion sputter (ACE600, LEICA) and observed with a field emission scanning electron microscope (SEM; MERLIN, Carl Zeiss).
The protein concentration was measured at 280 nm for comparison with the isolated EV from immunoprecipitation (IP) and the microfluidic chip. The bound EV on the microbeads in breast cancer cells (MCF‐7, SK‐BR‐3, BT‐474, Hs578T, and MDA‐MB‐231) media were measured via flow cytometry. The cells were washed in ice‐cold FACS buffer (PBS including 1% BSA and 0.1% NaN3 sodium azide), and 5 µL of the conjugated fluorescent primary antibody anti‐CD63‐PE‐Cy7 was incubated for 30 minutes at 4°C in the dark. The cells were rinsed with FACS buffer three times to remove unspecific binding, and then a FACS LSR II flow cytometer (BD, NJ, USA) was used for the measurement and analyzed by Flowing software v2.5.1.
2.4. Bioinformatic analysis of extracellular vesicle‐miRNA
The candidate diagnostic EV‐miRNA were profiled from miRNA expression of tissues in TCGA, which is a public database that provides comprehensive cancer genomic profiles with important implications for biomarker discovery. 15 To analyze differential expression of miRNA in breast cancer, the eight candidate miRNAs were analyzed with the 85 samples of paired cancer tissues and adjacent normal tissues of breast cancer patients enrolled in the TCGA database (Figure 1B). The adjacent normal tissues were collected under the judgment of an experienced surgeon during surgical removal of breast cancer tissue from breast cancer patients. Both cancer and adjacent tissue samples were collected before chemotherapy and treatment. The expression of TCGA data associated with the breast cancer samples used in the present study is summarized in Table S1.
We further predicted candidate target RNA of EV‐miRNA through integrated analysis of RNA‐seq and miRNA‐seq datasets for breast cancer from the TCGA database. Gene Ontology (GO) enrichment analysis of target genes of differentially expressed miRNA was implemented using the Database for Annotation, Visualization and Integrated Discovery (DAVID) tool. GO‐based pathway and functional annotation analysis showed that “miRNA in cancer‐related pathways” were commonly enriched in the significantly upregulated cancer‐specific EV‐miRNA in breast cancer tissues. GO terms were displayed with P < 0.05 (Figure 1C).
2.5. Expression of microRNA and multi‐panel analysis of the extracellular vesicles
The EV‐miRNA isolated from the microfluidic chip were extracted with the Total Exosome RNA and Protein Kit (Invitrogen) according to the manufacturer’s protocol. The concentration of RNA was determined with a NanoDrop 3000 spectrophotometer (Thermo Fisher Scientific, Waltham, MA, USA). RT‐qPCR was performed with TaqMan miRNA assays (Applied Biosystems). Briefly, 5 ng of total miRNA was used to perform reverse transcription in a CFX96 Real‐Time PCR system (Bio‐Rad), with 2 μL of cDNA in a final volume of 10 μL. Each point was assessed in triplicate.
2.6. Statistical analysis
To identify an effective reference gene for the expression of circulating miRNA, we profiled miR‐484, miR‐let‐7a, and miR‐16 in EV from breast cancer cell lines. Delta CT, GeNorm (https://genorm.cmgg.be), NormFinder (https://moma.dk/normfinder‐software), and BestKeeper (https://www.gene‐quantification.de/best keeper.html) software were used and a P value of <0.05 was considered statistically significant. The miRNA expressions in paired tumor and adjacent normal tissues from TCGA data and those in breast cancer patients and healthy controls from the EV were analyzed using two‐tailed Student t‐tests. An area under the receiver operating characteristic (ROC) curve (AUC) of over 0.65 of each miRNA and P value <0.05 was considered as the candidate biomarker for the diagnosis of breast cancer. Logistic regression analysis was applied to build models consisting of a group of candidate diagnostic miRNA.
3. RESULTS
3.1. Identification and characterization of breast cancer cell‐derived extracellular vesicles
To identify the characteristics of breast cancer‐derived EV, the concentrations of total EV from the cells were measured using a nanoparticle tracking analyzer, and the protein expression levels of CD49f and EpCAM of EV, including EV‐specific markers (CD9, CD81, and Alix), were determined (Figure S1). Our previous report confirmed that general EV markers (Flotillin‐1, CD63, and CD54) were expressed according to the western blot assay of the isolated EV. 14 Each identical concentration (109 particles/mL in PBS) was used to isolate the tumor‐specific EV using our microfluidic chip (Figure 2A). The isolated tumor‐specific EV on the microbeads were identified by SEM and the size of the EV ranged from 30 to 150 nm (Figure 2B). The microfluidic chip can separate the breast cancer‐specific EV within 2 minutes, which is 20 times faster than the conventional IP method (Figure 2C). The intensities of TDE separated from the conditioned media of the four breast cancer cell lines were as follows: 88.8% for MCF‐7, 45.0% for BT‐474, 53.4% for SK‐BR‐3, and 40.1% for MDA‐MB‐231 (Figure 2D).
FIGURE 2.
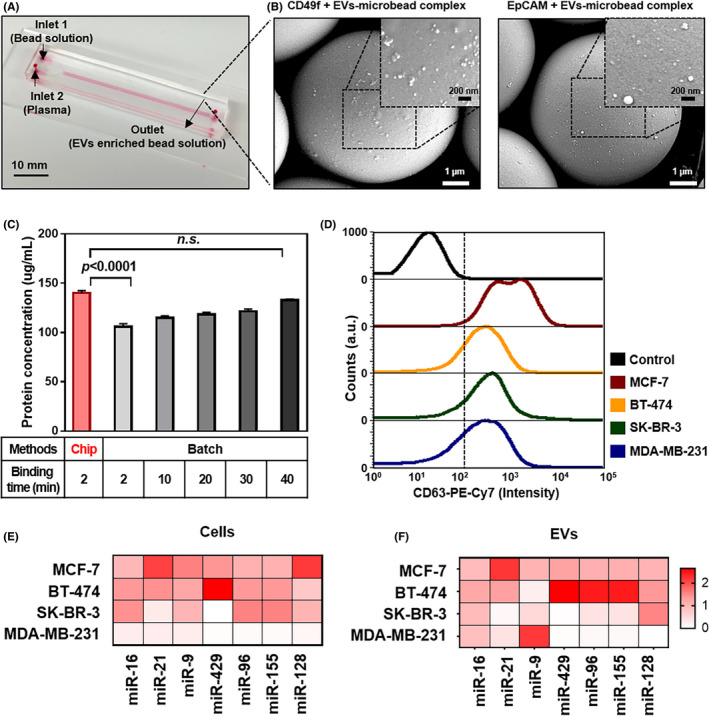
Enrichment of EV‐miRNA by microfluidic chip. A, Image of HOMM microfluidic chip. B, Scanning electron microscope (SEM) image of MDA‐MB‐231 tumor‐derived EV (TDE) after hydrodynamic separation using the microfluidic chip. The magnified SEM image shows TDE bound to the surface of 7‐μm beads coated with EpCAM and CD49f‐specific antibodies. C, Time‐dependent TDE isolation efficiency using the microfluidic chip compared to the batch method of IP. D, Flow cytometry of EpCAM and CD49f‐specific TDE after immunostaining with CD63 fluorescently labeled antibodies. E, Heat map of miRNA expressions for breast cancer cell lines. F, The specific EV enriched by the microfluidic chip
3.2. Validation of miRNA expression from the tumor‐specific extracellular vesicles
Next, candidate miRNA for breast cancer were investigated using the TCGA database, which enrolled 85 samples of invasive breast carcinoma and the paired normal tissue lesion (Table S1). The seven miRNAs (miR‐16, miR‐21, miR‐9, miR‐429, miR‐96, miR‐155, and miR‐128), which were known for cancer progression, such as cell proliferation and angiogenesis, were overexpressed in the cancer tissues compared with normal tissues. To verify whether the nominated seven miRNAs were derived from cells, the correlation between cancer cells and the specific EV was assessed by Pearson correlation. The miR‐16, miR‐21, and miR‐429 were the most highly significant correlations between each cell and the EV (Pearson r > 0.9 and P < 0.05). It was assumed that these EV‐miRNA were major regulators affecting cancer progression (Figure 2E‐F and Figure S2). Moreover, the miR‐9, miR‐96, miR‐155, and miR‐128 in the specific EV were more overexpressed than those in the cells, which may increase the sensitivity of detection of the EV.
To identify potential liquid biopsy‐based biomarkers for breast cancer, nominated target miRNA (miR‐16, miR‐21, miR‐9, miR‐429, miR‐96, miR‐155, and miR‐128) were validated with 82 plasma samples, including 62 breast cancers and 20 healthy controls. The miR‐let7a and miR‐16 are commonly used as endogenous controls for circulating biomarkers, 16 and miR‐484 was recently described as an EV endogenous control. 17 We assessed each miRNA expression normalized by these three candidates. The mean CT of miR‐484, miR‐16, and miR‐let‐7a from the EV were 24.7, 21.8, and 26.0, which indicated fairly reliable and abundant amounts of miRNA as the endogenous control (Figure 3A). In our experimental setting, miR‐484 among these candidates was selected as the most highly stable endogenous control using four types of gene stability analysis tools (Delta Ct, Best keeper, Norm finder, and Genome) (Figure 3B and Table S2).
FIGURE 3.

Evaluation of endogenous controls of specific extracellular vesicle (EV)‐miRNA. A, Comparison between Ct values of candidate endogenous genes of enriched EpCAM+and CD49f+ EV from plasma samples. B, The least and most stable miRNA candidates are analyzed by gene stability analysis
3.3. Characteristics of miRNA in extracellular vesicles associated with breast cancer subtypes
As expected, each miRNA in EV was associated with different tumor subtypes, and we compared the EV‐miRNA expressions between healthy controls and patients with different subtypes of breast cancer. Among the four statistically significant miRNAs (miR‐16, miR‐21, miR‐9, and miR‐429), the miR‐16 was closely related to luminal A, HER‐2, and triple negative subtypes. The miR‐21 and miR‐9 were closely associated with luminal A and luminal B. The miR‐429 was highly expressed in luminal B subtype (Figure 4A‐D).
FIGURE 4.
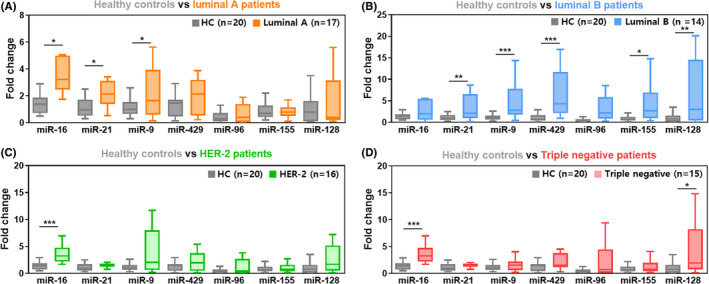
miRNA expression according to breast cancer subtype. Each box plot represents relative miRNA expression in four subtypes of breast cancer: A, Luminal A (estrogen receptor [ER]+, progesterone receptor [PR]+ and human epidermal growth receptor [HER‐2]‐). B, Luminal B (ER+, PR+, and HER‐2+). C, HER‐2 (ER‐, PR‐, and HER‐2+). D, Triple negative breast cancer (ER‐, PR‐, and HER‐2‐)
3.4. Diagnostic potential of extracellular vesicle miRNA in breast cancer
To investigate whether candidate miRNA in the EV enriched by microfluidic chip can serve as potential diagnostic biomarkers, miRNA expression was validated in 62 breast cancer patients and 20 healthy controls by quantitative RT‐PCR (qRT‐PCR; Figure 5). Before using plasma samples, we verified that no samples showed hemolysis, which is known to substantially affect the measurement of miRNA (Figure S3). We next assessed the diagnostic value of each miRNA by computing its ROC curve, with >0.65 interpreted as a good diagnostic biomarker. Among the seven candidates, four miRNAs (miR‐16, miR‐21, miR‐9, and miR‐429) were considered to be potential diagnostic biomarkers for breast cancer (Figure 5A‐G). The miR‐16 possessed the highest diagnostic power for discriminating between breast cancer patients and healthy controls, with an AUC of 0.85 (95% confidence interval [CI], 0.77‐0.94), followed by miR‐21 (AUC, 0.70; 95% CI, 0.56‐0.82), miR‐9 (AUC, 0.71; 95% CI, 0.59‐0.82), and miR‐429 (AUC, 0.71; 95% CI, 0.60‐0.83). The combination of these four miRNAs had a high sensitivity (96.8%) and a specificity (80%) with an AUC of 0.88 (95% CI, 0.78‐0.99) (Figure 5H). The combination of the significant four miRNAs (miR‐16, miR‐21, miR‐9, and miR‐429) enabled discrimination between each subtype of breast cancer patients and healthy controls with an AUC at 0.90 in luminal A subtype (95% confidence interval [CI], 0.78‐1.00), followed by luminal B (AUC, 0.86; 95% CI, 0.73‐1.00), HER‐2 (AUC, 0.88; 95% CI, 0.75‐1.00), and triple‐negative subtype (AUC, 0.84; 95% CI, 0.69‐0.99) (Figure 5I). Likewise, a previous study reports a significant correlation between miRNA profiles and intrinsic subtypes of breast cancer tumors. 18 Thus, as each cargo in EV regulates the cancer microenvironment, the most significant miRNA in breast cancer‐specific EV have the potential to predict cancer progression.
FIGURE 5.
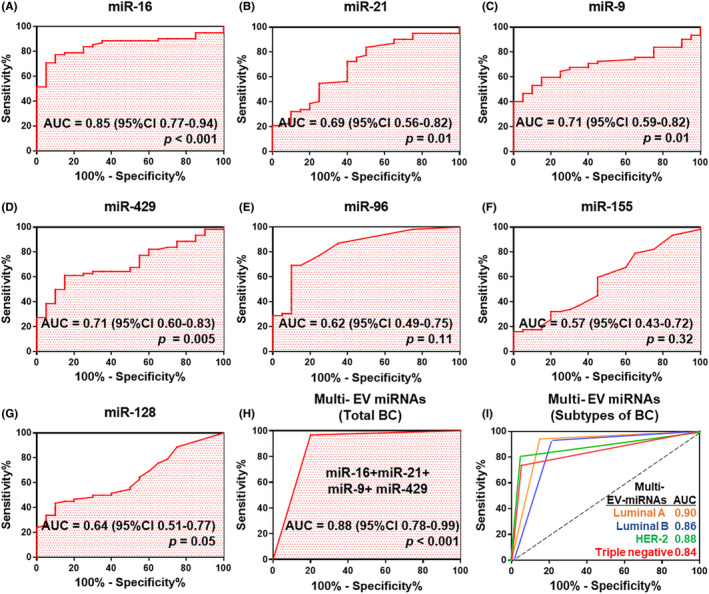
Receiver operating characteristic (ROC) curve analysis of seven candidate miRNAs used to discriminate breast cancer patients from healthy controls. A, Description of Area Under the ROC curve (AUC) value for diagnostic biomarker. B‐G, Potential diagnostic value of miRNA in the extracellular vesicles (EV) from plasma were analyzed by AUC. H, Construction and validation of optimal combination of the top four miRNAs (miR‐16, miR‐21, miR‐429, and miR‐9). I, ROC curve analysis according to the breast cancer subtypes (luminal A, luminal B, HER‐2, and triple negative) using a combination of the top four significant miRNA. miRNA expression was normalized to the average miR‐484 expression in healthy controls using the ΔΔCt method
3.5. Functional analysis for the prediction of mRNA targeted by top four miRNAs
The mRNA targets that showed significant characteristics in EV‐miRNA were portrayed by the miRNA‐gene interaction analysis. These four miRNAs showed that the significant categories of biological procedures were “pathways in cancer”, “apoptosis,” and “cell cycle” (Figure 6A). The significant mRNA targets were then analyzed by GO analysis. GO biological processes include regulation of the cell cycle (GO:0051726), negative regulation of the apoptotic process and cell proliferation (GO: 0043066 and GO:0008285), and G1/S transition of the mitotic cell cycle (GO: 0000082). Moreover, the molecular functions of the targeted mRNA were applied to protein binding (GO: 0005515), transcription factor binding (GO: 0008134), identical protein binding (GO:0042802), transcription coactivator activity (GO: 0003713), and protein kinase binding (GO:0019901) (Figure 6B).
FIGURE 6.
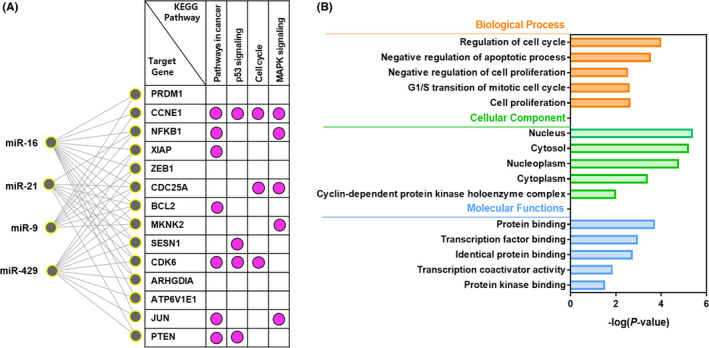
The miRNA‐mRNA interaction network analysis and enriched Gene Ontology (GO) analysis for target genes. A, A significant miRNA target gene network was constructed using the candidate four miRNA. The network represents KEGG pathways for target genes of the most significant miRNA. B, Representations of GO were generated by the DAVID tool for functionally annotated biological processes, cellular components, and molecular function. All GO terms were statistically significant (P < 0.05)
4. DISCUSSION
Only a small piece of tumor tissue obtained from a single point in spatio‐temporal events provides limited information and, thus, fails to identify complex tumor heterogeneity. TDE containing miRNA have tremendous potential as biomarkers for the early detection of cancer. Although TDE have proportionally less miRNA than the whole pool of EV, TDE have informative tumor heterogeneity that reflects reversible genetic changes in tumor cell populations during the course of disease. 19 However, the clinical implementation of TDE remains unexplored due to the absence of efficient and reliable tools for their isolation.
We previously described a microfluidic device for isolating TDE from plasma samples in a simple and fast manner. This microfluidic platform enables the harvesting of more than 90% of TDE from a 100 μL plasma sample within 2 minutes. Using this microfluidic device, we isolated TDE from 62 breast cancer patients and 20 healthy controls and found that cancer cell‐derived EV preserve miRNA in their cargo. This technique overcomes limitations of previous methods challenged by a low specificity of circulating miRNA, which may have affected the experimental results and contributed to discrepancies among studies. 20
We investigated the appropriate endogenous controls for specific EV and profiled seven candidate miRNA biomarkers (miR‐9, miR‐16, miR‐155, miR‐21, miR‐429, miR‐96, and miR‐128) from breast cancer cell‐derived EV. Dysregulated miRNAs are well documented in breast cancer patients. 21 , 22 For example, oncogenic miRNA promoting cancer initiation, progression, and even relapse are generally upregulated in breast cancer patients. 23 , 24 , 25 However, the same oncogenic miRNA exhibited no significance or downregulation in breast cancer in other studies. 18 , 26 , 27 (Table S3). As none of these studies were performed in a biased manner, we hypothesized that cancer stage in the miRNA analysis as well as the selection of an appropriate endogenous control are the most important factors for reliable results. Indeed, EV play an important role in cancer progression and tumor microenvironment regulation by influencing the activity of multiple gene targets, and the secretion of EV increases as the disease stage progresses. 28 Therefore, it is essential to select TDE with high specificity for the early detection of cancer. TDE containing miRNA can circulate stably in the bloodstream for a long time and can be collected repeatedly, making it possible to capture dynamic changes in cancer depending on the disease stage, except in a few cases where blood samples cannot be obtained. 29 As proposed in a consensus detailing the recommendations on the studies of EV, a suitable normalization strategy is important for performing miRNA expression analyses. 30 RNU6B is widely accepted as an endogenous control for cellular miRNA but is not recommended for circulating miRNA. 31 However, miR‐16 is generally used as an endogenous control to evaluate serum miRNA profiles in breast cancer studies. By comparing miRNA signatures between TDE and breast cancer cell lines, we demonstrated that miR‐484 can serve as an endogenous control for data normalization. In addition, miR‐484 was more stable than miR‐16 and let‐7a in our experimental setting. Most patients in our cohort showed similar miRNA concordance as in TCGA data, and better concordance was achieved by using miR‐484 as an endogenous control. These results suggest that miRNA in TDE should be assessed separately from vesicle‐free miRNA (ie, miRNA with ambiguous origin), and reference gene candidates should be validated depending on the specific experimental design.
To date, carcinoembryonic antigen (CEA) and cancer antigen 15‐3 (CA 15‐3) have been employed as tumor markers playing important roles in predicting therapy responsiveness. 32 The limitation of CEA and CA15‐3 is that their level in serum is rarely elevated for patients with early‐stage breast cancer, but some oncologists still use them as tumor markers for predicting breast cancer. When we profiled miRNA expression in EV from breast cancer patients and healthy controls, we found that a combination of the top four miRNAs (miR‐9, miR‐16, miR‐21, and miR‐429) was optimal for predicting breast cancer. The value of these four miRNAs as a potential breast cancer biomarker was confirmed by ROC curve analysis, sensitivity of 96.8%, and specificity of 80.0%, which are superior to those of current diagnostic methods.
Some researchers also suggested that the combination of miRNA in the blood can be useful to detect early‐stage breast cancer by examining the dysregulated miRNA expression patterns from serum or plasma. 33 , 34 As revealed in most studies, the diagnostic value of miRNA in liquid biopsy has become very clear, but the investigations of the specific EV‐miRNA for early‐stage breast cancer have been limited due to the lack of a reliable isolation method of the EV. We believe that our analytical tool in association with the precise isolation of TDE has the potential to overcome some diagnostic limitations, such as sensitivity and selectivity in the field of EV‐based in vitro diagnostics.
Several studies have attempted to investigate miRNA in specific EV to engineer EV for new therapeutic targets and understand the heterogeneity of tumors. 35 , 36 We discovered that miRNA expression patterns showed differences in breast cancer‐derived EV according to breast cancer subtype. The dysregulated miRNA expression often leads to distortion of the whole regulatory network constituted with miRNA and target mRNA. It reflects a wide range of biological functions of cancer, ensuring a promising clinical approach to the diagnosis and treatment of cancer. The top four EV‐miRNA signatures identified in this study might fulfill unmet needs for the diagnosis of early breast cancer, as well as companion diagnosis in breast cancer.
5. CONCLUSION
Our investigation of miRNA profiles in EV reveals that breast cancer patients show a higher expression of certain miRNA (miR‐9, miR‐16, miR‐21, and miR‐429) than healthy controls. These findings suggest that miRNA in EV could be used as important biomarkers for the early detection of breast cancer and identification of cancer subtype. In the future, we will expand our cohort to develop a clinical‐grade blood test for breast cancer screening with higher specificity and sensitivity.
CONFLICTS OF INTEREST
The authors declare no conflicts of interest.
CLINICAL TRIAL REGISTRATION INFORMATION
Informed consent for the use of blood samples for research purposes was obtained from patients. This study was conducted according to guidelines of the Institutional Review Board of Yonsei University Health System (IRB No. 4‐2020‐0350).
Supporting information
Fig S1‐S3
Table S1‐S3
ACKNOWLEDGMENTS
This research was supported by the Technology Innovation Program (20008829) funded by the Ministry of Trade, Industry and Energy. This work was supported by the National Research Foundation of Korea grant (2020M3A9I4039045, 2020R1A5A1018052, 2020R1I1A1A01067448, and 2021R1I1A1A01051594), and a Faculty Research Grant from the Yonsei University College of Medicine (6‐2019‐0067). The funders had no role in the study design, data collection, and analysis, the decision to publish, or the preparation of the manuscript. Professional editing assistance was provided by BioScience Writers, LLC.
Kim MW, Park S, Lee H, et al. Multi‐miRNA panel of tumor‐derived extracellular vesicles as promising diagnostic biomarkers of early‐stage breast cancer. Cancer Sci. 2021;112:5078–5087. 10.1111/cas.15155
Min Woo Kim and Sunyoung Park contributed equally to this work.
Contributor Information
Hyo‐Il Jung, Email: URIDLE7@yonsei.ac.kr.
Seung Il Kim, Email: SKIM@yuhs.ac.
REFERENCES
- 1. Gebert LFR, MacRae IJ. Regulation of microRNA function in animals. Nat Rev Mol Cell Bio. 2019;20:21‐37. [DOI] [PMC free article] [PubMed] [Google Scholar]
- 2. Mulrane L, McGee SF, Gallagher WM, O’Connor DP. miRNA dysregulation in breast cancer. Cancer Res. 2013;73:6554‐6562. [DOI] [PubMed] [Google Scholar]
- 3. Mitchell PS, Parkin RK, Kroh EM, et al. Circulating microRNAs as stable blood‐based markers for cancer detection. P Natl Acad Sci USA. 2008;105:10513‐10518. [DOI] [PMC free article] [PubMed] [Google Scholar]
- 4. De Rubis G, Rajeev Krishnan S, Bebawy M. Liquid biopsies in cancer diagnosis, monitoring, and prognosis. Trends Pharmacol Sci. 2019;40:172‐186. [DOI] [PubMed] [Google Scholar]
- 5. Marrugo‐Ramirez J, Mir M, Samitier J. Blood‐based cancer biomarkers in liquid biopsy: a promising non–invasive alternative to tissue biopsy. Int J Mol Sci. 2018;19:2877. [DOI] [PMC free article] [PubMed] [Google Scholar]
- 6. Endzelins E, Berger A, Melne V, et al. Detection of circulating miRNAs: comparative analysis of extracellular vesicle‐incorporated miRNAs and cell‐free miRNAs in whole plasma of prostate cancer patients. BMC Cancer. 2017;17:730. [DOI] [PMC free article] [PubMed] [Google Scholar]
- 7. Jurj A, Zanoaga O, Braicu C, et al. A comprehensive picture of extracellular vesicles and their contents. Molecular Transfer to Cancer Cells. Cancers. 2020;12:298. [DOI] [PMC free article] [PubMed] [Google Scholar]
- 8. Coenen‐Stass AML, Pauwels MJ, Hanson B, et al. Extracellular microRNAs exhibit sequence‐dependent stability and cellular release kinetics. RNA Biol. 2019;16:696‐706. [DOI] [PMC free article] [PubMed] [Google Scholar]
- 9. Valadi H, Ekstrom K, Bossios A, Sjostrand M, Lee JJ, Lotvall JO. Exosome‐mediated transfer of mRNAs and microRNAs is a novel mechanism of genetic exchange between cells. Nat Cell Biol. 2007;9:654‐659. [DOI] [PubMed] [Google Scholar]
- 10. Chen X, Ba Y, Ma LJ, et al. Characterization of microRNAs in serum: a novel class of biomarkers for diagnosis of cancer and other diseases. Cell Res. 2008;18:997‐1006. [DOI] [PubMed] [Google Scholar]
- 11. Momen‐Heravi F, Balaj L, Alian S, et al. Current methods for the isolation of extracellular vesicles. Biol Chem. 2013;394:1253‐1262. [DOI] [PMC free article] [PubMed] [Google Scholar]
- 12. Shtam T, Evtushenko V, Samsonov R, et al. Evaluation of immune and chemical precipitation methods for plasma exosome isolation. PLoS ONE. 2020;15:e0242732. [DOI] [PMC free article] [PubMed] [Google Scholar]
- 13. Delamarche E, Juncker D, Schmid H. Microfluidics for processing surfaces and miniaturizing biological assays. Adv Mater. 2005;17:2911‐2933. [Google Scholar]
- 14. Gwak H, Park S, Kim J, et al. Microfluidic chip for rapid and selective isolation of tumor‐derived extracellular vesicles for early diagnosis and metastatic risk evaluation of breast cancer. Biosens Bioelectron. 2021;192:113495. [DOI] [PubMed] [Google Scholar]
- 15. Chu A, Robertson G, Brooks D, et al. Large‐scale profiling of microRNAs for The Cancer Genome Atlas. Nucleic Acids Res. 2016;44:e3. [DOI] [PMC free article] [PubMed] [Google Scholar]
- 16. Donati S, Ciuffi S, Brandi ML. Human circulating miRNAs real‐time qRT‐PCR‐based analysis: an overview of endogenous reference genes used for data normalization. Int J Mol Sci. 2019;20:4353. [DOI] [PMC free article] [PubMed] [Google Scholar]
- 17. McDermott AM, Kerin MJ, Miller N. Identification and validation of miRNAs as endogenous controls for RQ‐PCR in blood specimens for breast cancer studies. PLoS ONE. 2013;8:e83718. [DOI] [PMC free article] [PubMed] [Google Scholar]
- 18. Jurkovicova D, Smolkova B, Magyerkova M, et al. Down‐regulation of traditional oncomiRs in plasma of breast cancer patients. Oncotarget. 2017;8:77369‐77384. [DOI] [PMC free article] [PubMed] [Google Scholar]
- 19. Eslami‐S Z, Cortes‐Hernandez LE. Eslami‐S Zahra, Cortés‐Hernández Luis Enrique, Alix‐Panabières Catherine. Epithelial cell adhesion molecule: an anchor to isolate clinically relevant circulating tumor cells. Cells. 2020;9:1836. [DOI] [PMC free article] [PubMed] [Google Scholar]
- 20. Kamal NNSBNM, Shahidan WNS. Non–exosomal and exosomal circulatory microRNAs: which are more valid as biomarkers? Front Pharmacol. 2020;10:1500. [DOI] [PMC free article] [PubMed] [Google Scholar]
- 21. Paszek S, Gablo N, Barnas E, et al. Dysregulation of microRNAs in triple‐negative breast cancer. Ginekol Pol. 2017;88:530‐536. [DOI] [PubMed] [Google Scholar]
- 22. van Schooneveld E, Wildiers H, Vergote I, Vermeulen PB, Dirix LY, Van Laere SJ. Dysregulation of microRNAs in breast cancer and their potential role as prognostic and predictive biomarkers in patient management. Breast Cancer Res. 2015;17. [DOI] [PMC free article] [PubMed] [Google Scholar]
- 23. Ni QT, Stevic I, Pan C, et al. Different signatures of miR‐16, miR‐30b and miR‐93 in exosomes from breast cancer and DCIS patients. Sci Rep‐Uk. 2018;8:12974. [DOI] [PMC free article] [PubMed] [Google Scholar]
- 24. Li XM, Zeng Z, Wang JE, et al. MicroRNA‐9 and breast cancer. Biomed Pharmacother. 2020;122:109687. [DOI] [PubMed] [Google Scholar]
- 25. Khalighfard S, Alizadeh AM, Irani S, Omranipour R. Plasma miR‐21, miR‐155, miR‐10b, and Let‐7a as the potential biomarkers for the monitoring of breast cancer patients. Sci Rep‐Uk. 2018;8. [DOI] [PMC free article] [PubMed] [Google Scholar]
- 26. Tavakolian S, Goudarzi H, Torfi F, Faghihloo E. Evaluation of microRNA‐9 and ‐192 expression levels as biomarkers in patients suffering from breast cancer. Biomed Rep. 2020;12:30‐34. [DOI] [PMC free article] [PubMed] [Google Scholar]
- 27. Ye T, Liang Y, Zhang D, Zhang X. Corrigendum: microRNA‐16‐1‐3p represses breast tumor growth and metastasis by inhibiting PGK1‐mediated warburg effect. Front Cell Dev Biol. 2021;9:649787. [DOI] [PMC free article] [PubMed] [Google Scholar]
- 28. Li I, Nabet BY. Exosomes in the tumor microenvironment as mediators of cancer therapy resistance. Mol Cancer. 2019;18. [DOI] [PMC free article] [PubMed] [Google Scholar]
- 29. Hannafon BN, Trigoso YD, Calloway CL, et al. Plasma exosome microRNAs are indicative of breast cancer. Breast Cancer Res. 2016;18. [DOI] [PMC free article] [PubMed] [Google Scholar]
- 30. Thery C, Witwer KW, Aikawa E, et al. (MISEV2018): a position statement of the International Society for Extracellular Vesicles and update of the MISEV2014 guidelines. J Extracell Vesicles. 2018;2018:7. [DOI] [PMC free article] [PubMed] [Google Scholar]
- 31. Das MK, Andreassen R, Haugen TB, Furu K. Identification of Endogenous Controls for Use in miRNA Quantification in Human Cancer Cell Lines. Cancer Genom Proteom. 2016;13:63‐68. [PubMed] [Google Scholar]
- 32. Shao YB, Sun XF, He YN, Liu CJ, Liu H. Elevated levels of serum tumor markers CEA and CA15‐3 are prognostic parameters for different molecular subtypes of breast cancer. PLoS ONE. 2015;10:e0133830. [DOI] [PMC free article] [PubMed] [Google Scholar]
- 33. Itani M, Nassar FJ, Tfayli A, et al. A Signature of four circulating micrornas as potential biomarkers for diagnosing early‐stage breast cancer. Int J Mol Sci. 2021;22:6121. [DOI] [PMC free article] [PubMed] [Google Scholar]
- 34. Shimomura A, Shiino S, Kawauchi J, et al. Novel combination of serum microRNA for detecting breast cancer in the early stage. Cancer Sci. 2016;107:326‐334. [DOI] [PMC free article] [PubMed] [Google Scholar]
- 35. Li S, Xu JL, Qian J, Gao XH. Engineering extracellular vesicles for cancer therapy: recent advances and challenges in clinical translation. Biomater Sci‐Uk. 2020;8:6978‐6991. [DOI] [PubMed] [Google Scholar]
- 36. Hafiz M, Al‐Hallak MN, Philip PA, et al. Exosomal microRNA in pancreatic cancer diagnosis, prognosis, and treatment: from bench to bedside. Cancers. 2021;13:2777. [DOI] [PMC free article] [PubMed] [Google Scholar]
Associated Data
This section collects any data citations, data availability statements, or supplementary materials included in this article.
Supplementary Materials
Fig S1‐S3
Table S1‐S3


