
Fig. 3.
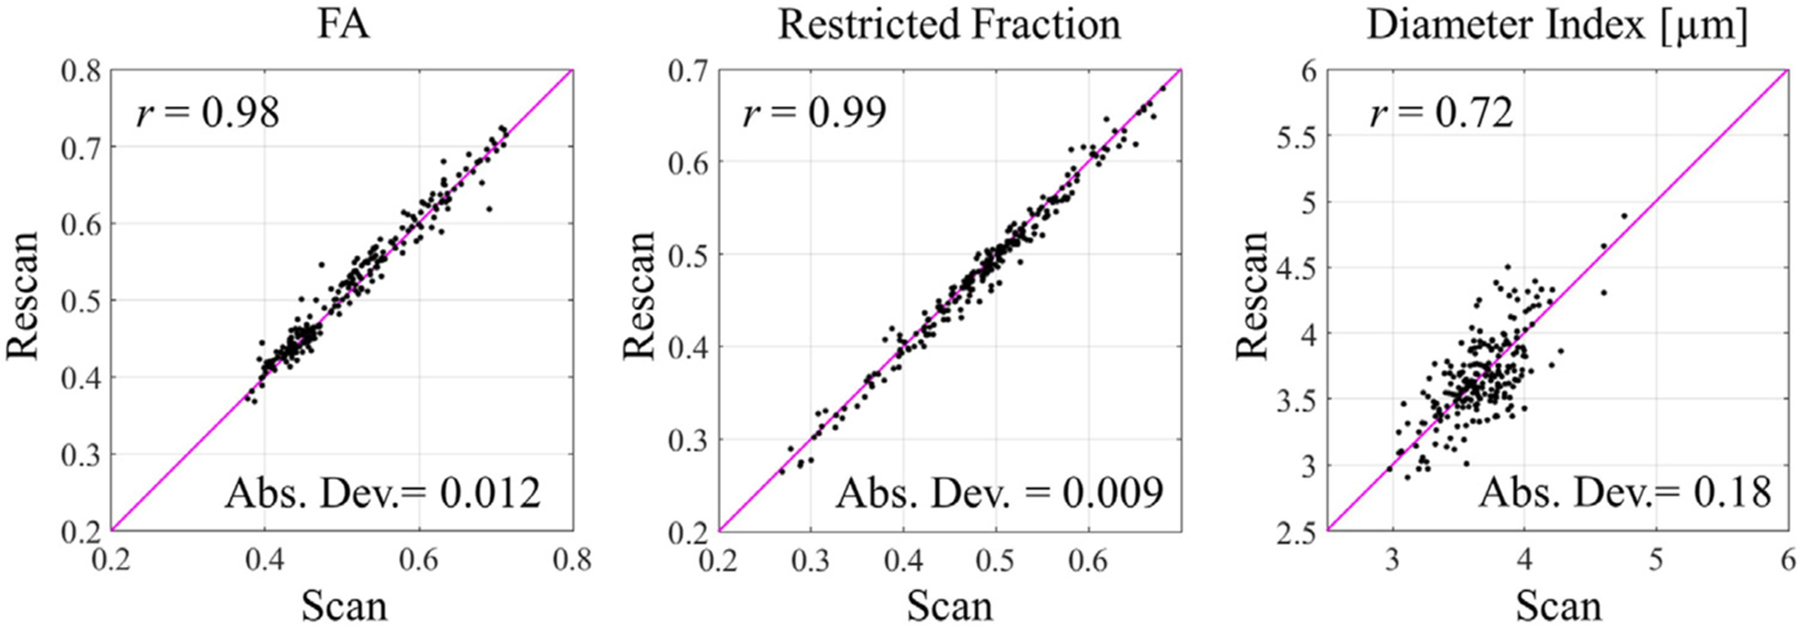
ROI-averaged diffusion metrics of scan and rescan sessions. The plots were generated by pooling together all white matter segments across all subjects. The Pearson’s correlation coefficient (r) and absolute deviation (Abs. Dev.) were labeled on each plot. The line of unity is marked in pink.