

Abstract
The detection of biological RNA from sputum has a comparatively poor positive rate in the initial/early stages of discovering COVID‐19, as per the World Health Organization. It has a different morphological structure as compared to healthy images, manifested by computer tomography (CT). COVID‐19 diagnosis at an early stage can aid in the timely cure of patients, lowering the mortality rate. In this reported research, three‐phase model is proposed for COVID‐19 detection. In Phase I, noise is removed from CT images using a denoise convolutional neural network (DnCNN). In the Phase II, the actual lesion region is segmented from the enhanced CT images by using deeplabv3 and ResNet‐18. In Phase III, segmented images are passed to the stack sparse autoencoder (SSAE) deep learning model having two stack auto‐encoders (SAE) with the selected hidden layers. The designed SSAE model is based on both SAE and softmax layers for COVID19 classification. The proposed method is evaluated on actual patient data of Pakistan Ordinance Factories and other public benchmark data sets with different scanners/mediums. The proposed method achieved global segmentation accuracy of 0.96 and 0.97 for classification.
Keywords: Deeplabv3, denoise convolutional neural network (DnCNN), healthcare, public health, ResNet‐18, stack sparse autoencoder deep learning model (SSAE)
Denoise convolutional neural network regression model used for noise removal to enhance images quality. Model deeplabv3 is used as a backbone of the ResNet‐18 model to segment infected lungs region. Segmented images are further supplied to stack sparse autoencoder model for COVID‐19 classification.

1. INTRODUCTION
Coronaviruses infected patients may suffer from MERS and SARS. Recently, the COVID‐19 (a new strain of coronaviruses) has been reported as a worldwide epidemic disease originating from China's Province Hubei. This disease is transmitted from affected peoples to others by sneezing and coughing, in which the droplets are the disease carriers (Khan et al., 2021; Yi, Lagniton, Ye, Li, & Xu, 2020). Therefore, washing hands with soap or sanitizing is a preliminary precaution to safeguard from the attack of COVID‐19. Other measures to minimize the spread of these viruses are to keep social distance and isolation. Initial symptoms in such patients are high body temperatures and coughing with difficulty in breathing. When the virus attacks inside the lungs, the infection of pneumonia is generated (Rehman et al., 2021a). A problem of early detection for COVID‐19 is due to the low positive rate of biological RNA, as stated by World Health Organization (WHO). According to the most recent WHO figures, the cumulative number of confirmed COVID‐19 cases and deaths is 165,772,430 and 3,437,545, respectively (“WHO, n.d., https://www.who.int/emergencies/diseases/novel-coronavirus). Computer tomography images taken from COVID‐19 patients' lungs are different from healthy images. The evolutionary phase for quick diagnosis of COVID‐19 is in the infantry stage. Due to the limited availability of testing kits, 3–4 days are needed for diagnosis using PCR, which is gold standard procedure also called nucleic acid testing (Jianping Tong, Mengyun Liu, & Shen, 2020; Saba, Abunadi, Shahzad, & Khan, 2021). Testing result's accuracy mainly depends on the stage of disease, nucleic extraction method, and the collection of specimens. Results of confirmation should be declared after repetitive examines. (Ai et al., 2020). The rapidly available diagnostic tool is HRCT that can be used for patient's screening of COVID‐19. Pulmonary consolidation is found in lateral stages. In many cases, paving morphology in the crazy or rounded form is found for peripheral lung distribution (Saba 2019). For diseases of infectious and inflammatory, overlapping is observed while taking computer tomography (CT) images (Jamal, Hazim Alkawaz, Rehman, & Saba, 2017), therefore, it becomes difficult to diagnosis the COVID‐19. The convolutional neural network (CNN) is an alternative method that helps for the diagnosis of COVID‐19 (Xu & Meng, ; Haimed, Saba, Albasha, Rehman, & Kolivand, 2021).
1.1. Keys challenges
This research work is mainly focused on the detection of COVID‐19 problems. The noisy CT images having poor contrast at the same time, the noise removal is a challenging task (Ejaz et al., 2021; Rehman et al., 2020). Accurate lesion segmentation is a complex task because of the irregular size and shape of the abnormal region. Classification among the Healthy/COVID19 is another exciting task because it depends upon the feature extraction and selection methods. COVID‐19 identification in its early stages is a big issue due to nucleic acid‐based laboratory testing limitations. AI‐based methods can be utilized as front‐line health care for accurate and quickly diagnosed COVID‐19 (He et al., 2021). As a result, the deep learning methodology is introduced for accurate COVID‐19 identification. The core contribution steps of the proposed modal are:
The proposed modal addresses the adverse effect of noisy images on detection rate DcNN methodology employed on input images for noise removal.
The three‐dimensional (3D) semantic segmentation is developed by merging the Deeplabv3 & ResNet‐18 and training is done on selected hyperparameters on actual ground masks.
After segmentation of the actual COVID‐19 lesions, stack sparse autoencoder (SSAE) model is utilized for the classification of the healthy & unhealthy images.
The proposed research is presented in five sections; related work is discussed in Section 2, suggested method is mentioned in Section 3 and achieved results & conclusion is written in Section 4 & Section 5, respectively.
2. RELATED WORK
COVID‐19 spread from one person to another through respiratory droplets (Singhal, 2020) has caused adverse impact on the industries, educational institutes and shopping malls, etc. It is also causing a loss to the industry (Nicola et al., 2020). The computerized methodologies might provide help for precise COVID‐19 detection because manual evaluation of the CT scan takes up to 15 min while DL takes a few seconds and improves the clinical assessments' efficiency (McCall, 2020). In the literature, extensive work is done on COVID‐19 detection using CNN; some of the latest work is discussed in this section (Rodriguez‐Morales et al., 2020; Sohrabi et al., 2020). The CNNs (Amin, Sharif, Raza, Saba, & Anjum, 2019; Amin, Sharif, Raza, Saba, & Rehman, 2019; Amin, Sharif, Yasmin, Saba, & Raza, 2019; Khan, Nazir, et al., 2019; Khan, Javed, Sharif, Saba, & Rehman, 2019; Rehman, Sadad, Saba, Hussain, & Tariq, 2021b) are helpful in extracting the meaningful features from lung CT images for identification of pulmonary nodules, ground‐glass haze, and pneumonia (Choe et al., 2019). Patchy shadows with bilateral distribution are symptoms of COVID‐19 which are easily detected using CNN (Jamil & Hussain, 2020; Ramzan et al., 2020). The 3D DL model is used to extract the local (2D) and global (3D) features (Amin et al., 2020; Fahad, Ghani Khan, Saba, Rehman, & Iqbal, 2018; Liaqat et al., 2018) from lung CT images, method is evaluated on CT scan of the 3,506 patients, which are collected from different six medical centers (Li et al., 2020). The pretrained such as Xception & ResNet101 are utilized for extraction of COVID‐19 features (Ardakani, Kanafi, Acharya, Khadem, & Mohammadi, 2020). The inception model is modified with pretrained weights for classification and results are reported on 453 CT slices (Guo et al., 2020). Sixteen pretrained CNN models are used for the analysis of the COVID‐19 features and the results are reported on the publicly benchmark Chinese data set (Pham, 2020). The method is assessed on the local CT images as well as publicly available benchmark data sets. The COVID‐19 detection is still a challenging task due to the complex structure of the lung CT images. The lesions regions appear in a variable shape and size on the border. Therefore, the actually infected region is also segmented as a healthy region. In this research, a novel approach is proposed for noise removal by utilizing denoise convolutional neural network (DnCNN) and semantic segmentation based on U‐Net model. The proposed SSAE model provides significant features from the segmented images for accurate classification.
3. PROPOSED METHOD
The methodology employed is depicted in Figure 1, where the deep network had three phases, Phase I is based on the DnCNN regression model used for noise removal and enhance the image quality. After denoising, enhanced images are passed to the proposed segmentation model. In this model, deeplabv3 & ResNet‐18 model are utilized to segment the infected region of the lung. The segmented images are further supplied to the SSAE for classification.
FIGURE 1.
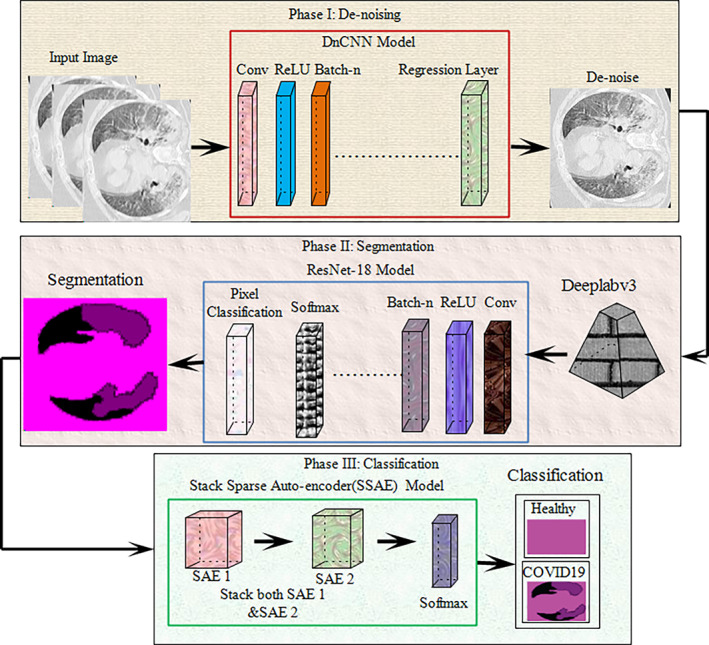
Proposed research model
3.1. Preprocessing using denoise convolutional neural network
The CT is the best imaging modality for lung nodule diagnosis. It is used to analyze the functional and structural information related to human body parts (Khan et al., 2021). However, the quality of the CT images is degraded due to the radiation, which affects the Radiologists decision and diagnosis. Therefore noise removal is a challenging task for the accurate detection of COVID‐19 (Mahersia, Zaroug, & Gabralla, 2015). That is why pretrained DnCNN (Zhang, Zuo, Chen, Meng, & Zhang, 2017) model is utilized, which consists of 59 layers such as 01 input, 20 convolutional, 19 ReLU, 18 batch‐normalization, and 01 regression output layer. The DnCNN layers with activation units are shown in Figure 2.
FIGURE 2.
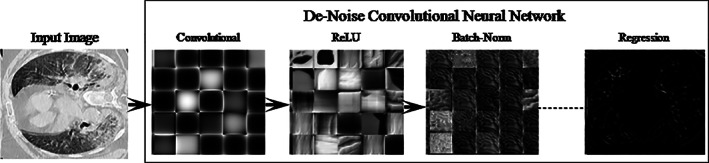
DnCNN model for noise removal
3.2. Semantic segmentation using DeeplabV3 and ResNet‐18 model
In this study, a semantic segmentation model is proposed utilizing deeplabv3 convolutional neural network as a backbone of the pre‐trained ResNet18 (He, Zhang, Ren, & Sun, 2016). The deeplabv3 (Chen, Zhu, Papandreou, Schroff, & Adam, 2018) network utilize encoder/decoder model dilated convolutional and skip connections to segments the multi‐scaled objects. Therefore, the reported research combination of the deeplabv3 and Resnet‐18 models is employed for segmentation of COVID‐19. The designed segmentation model consists of the 98 layers such as 01 input, 30 convolutional, 25 ReLU, 01 maxpooling, 28 batch‐normalization, 08 addition, 02 depth concatenation, 01 crop 2D, 01 softmax, and 01‐pixel classification. The proposed architecture with activation units of different layers is illustrated in Figure 3.
FIGURE 3.
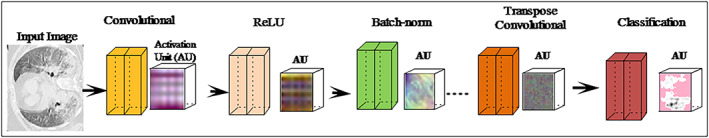
Semantic segmentation model with activation units
Table 1 lists the configuration settings for the recommended segmentation technique and segmented lesion regions are depicted in Figure 4.
TABLE 1.
Configuration parameter of semantic segmentation model
| Epoch | 300 | |
| Minibatch size | 128 | |
| Image size |
|
FIGURE 4.
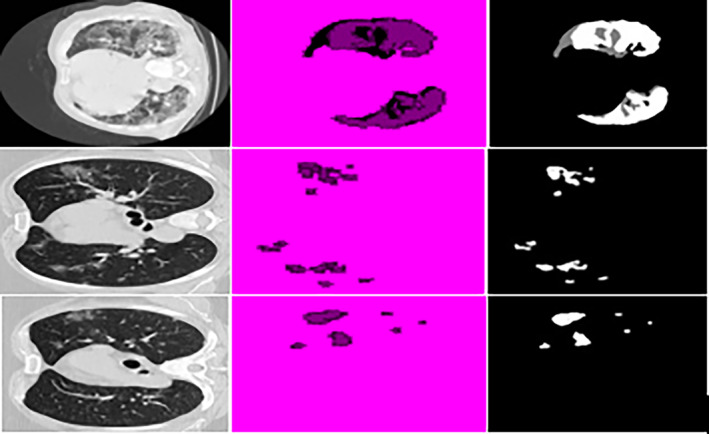
Result of segmented images input images, segmentation, ground truth
3.3. Stack sparse autoencoder for COVID‐19 classification
Segmented CT images are obtained after applying semantic segmentation model and subsequently supplied to the SSAE model. The proposed SSAE (Olshausen & Field, 1997) model is designed by two sparse autoencoders (SAEs) with a softmax layer as shown in Figure 5. A detailed description of autoencoder and SAE is discussed in the succeeding paragraph.
FIGURE 5.
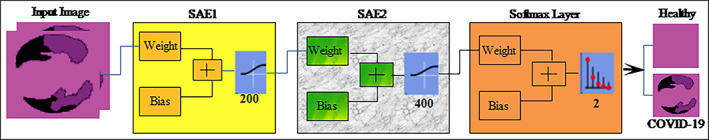
SSAE model for infected lung region classification
3.3.1. Autoencoder
Autoencoder (AE) is an unsupervised network in which training is performed to replicate input size as its output. The training depends upon the cost optimization function. Cost function (CF) computes error among input I(x, y) and reconstructed output image . The autoencoder input vector , encoder maps vector I into another vector as
| (1) |
Here, superscript (1) represents the first hidden layer, encoder transfer function, weight matrix and bias matrix . The decoder maps z block encoded representation into input vector I that is defined as:
| (2) |
Superscript (2) denotes second hidden layer, decoder transfer function, and . The encoder and decoder processes are shown in Figure 6.
FIGURE 6.
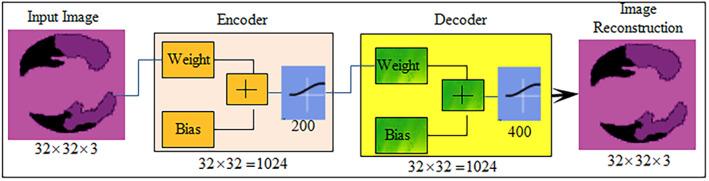
Autoencoder for image reconstruction
3.3.2. Sparse autoencoders
Autoencoder sparsity is probable through the addition of regularizers to CF. The average output value activation of each neuron is computed by function of the regularizers, which is mathematically expressed as
| (3) |
where n represent training samples, is jth training samples, represents jth training samples of weight matrix, denote weight and the bias. When neurons are firing, then the output of activation is high, lower value of the output activation means hidden layer neurons fire on small training samples.
| (4) |
where Kullback–Leibler divergence (kL) computes difference among the distributions, which takes zero value when and are equal and larger when they diverge each other. Sparsity regularizers apply a sparsity constraint of the hidden layer output. Sparsity, regularization is added which takes higher value when average activations values of neuron i and desired value are not close such as Kullback–Leibler divergence sparsity regularization.
| (5) |
where L denotes hidden layers, n represents observations, and k training samples. L2 regularization is used in training of the SAE, in which set small value of the sparsity regularizer by increase the weights values and minimize the z values. The training CF in which SAE adjust the mean squared error (MSE) as follows
| (6) |
where denote L2 regularization coefficient. represents sparsity regularization.
3.3.3. Stack sparse autoencoder
In this study, two SAE networks are stacked together. In SSAE model, the output of the first SAE becomes the input of the next SAE. Shallow SAE is used instead of full SAE as shown in Figure 7.
FIGURE 7.
Features learning process: (a) SAE1 and (b) SAE2
The stacked network is connected with softmax. The SSAE network is mathematically express as:
| (7) |
| (8) |
where denote ith neuron of the kernel vector, denote SSAE output, and represent the softmax.
The input image vector size is , where 3 denote the channel and input vector size of 1,024 units that are passed to the SSAE model as mentioned in Table 2. The SSAE model is constructed by the combination of SAE1 & SAE2 layers. The input units are fed to SAE1 with 200 hidden units, in which the encoder section of the SAE1 with the learning parameters such as weight and bias matrix creates a features vector. This features vector is supplied as an input to the SAE2. The encoder section of the SAE2 with 400 hidden units and selected hyperparameters such as weight and bias create a final features vector. Finally, the softmax layer is attached at the end of the SSAE model that made predictions based on the features vector obtained from the SAE2.
TABLE 2.
Parameters of SSAE network
| Hidden size | Encoder transfer function | Encoder weights | Encoder biases | Decoder transfer function | Decoder weights | Decoder biases |
|---|---|---|---|---|---|---|
| SAE1 | ||||||
| 200 | Logistic sigmoid function (logsig) | 200 × 1024 | 200 × 1 | Logsig | 1024 × 200 | 1024 × 1 |
| SAE2 | ||||||
| 400 | Logsig | 400 × 200 | 400 × 1 | Logsig | 200 × 400 | 200 × 1 |
4. MATERIAL SETUP & EXPERIMENTATION
COVID‐19 Segmentation Data set‐I contains 40 patient's CT imaging data, in which 100 positive slices with binary ground truth masks and 200 negative slices (Johannes, Jeanny, Sebastian, Helmut, & Georg, 2020) (“COVID‐19 CT segmentation data set, Available: http://medicalsegmentation.com/covid19/ accessed by 8/5/2020”).
Data set‐II contains 349 positive images & 701 negative images that are collected from the Wuhan China (UCSD‐AI4H/COVID‐CT; Zhao, Zhang, He, & Xie, 2020).
Data set‐III, 1500 CT slices of the 12 COVID‐19 patients with different angles axial, coronal and sagittal as well as 1,200 negative images. The pixel‐based ground‐truth annotated images are created and infected regions are marked after careful examination of each image by the expert radiologists.
Data set IV contains 10 CT slices of BSTI COVID‐19 database library (4/23/2020; Guo et al., 2020).
Three experiments have been performed for the evaluation of the proposed technique. The first experiment is performed to validate the performance of the enhancement method, the second experiment is performed to evaluate the segmentation method, and the third experiment is conducted to evaluate the classification method. This research was carried out on MATLAB 2020a toolbox and a Core i7 CPU with a 2070 RTX NVIDIA GPU.
4.1. Experiment#1: Preprocessing using DnCNN model
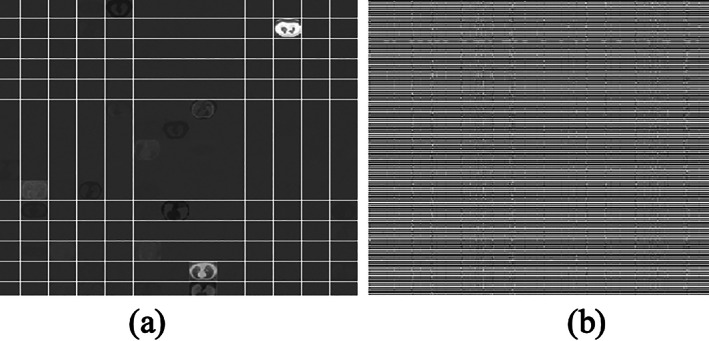
The performance of the DnCNN method is validated in terms of different measures such as Peak signal to noise ratio (PSNR), Structural Similarity Index (SSIM) , and MSE. The quantitative results are computed image by image as mentioned in Table 3 and the average enhancement results on the benchmark data sets are mentioned in the Table 4. The enhanced images with performance measures are also illustrated in Figure 8.
TABLE 3.
Enhancement results in term of PSNR, MSE, and SSIM parameters on benchmark data sets
| PSNR of image obtained after applying DnCNN | MSE | SSIM |
|---|---|---|
| 57.8267 | 0.0768 | 0.0768 |
| 60.4955 | 0.0363 | 0.9998 |
| 43.1336 | 1.3488 | 0.9974 |
| 55.8361 | 0.0363 | 0.9994 |
| 32.8257 | 15.4776 | 0.8693 |
| 58.3146 | 0.0534 | 0.9997 |
| 60.2372 | 0.0338 | 0.9996 |
| 61.1223 | 0.0291 | 0.9997 |
| 60.5253 | 0.0293 | 0.9997 |
| 60.0714 | 0.0347 | 0.9997 |
| 53.9383 | 0.1459 | 0.9987 |
| 59.3848 | 0.0455 | 0.9997 |
| 57.8156 | 0.0594 | 0.9996 |
| 56.5979 | 0.0784 | 0.9988 |
| 59.1942 | 0.0401 | 0.9994 |
| 55.8477 | 0.0905 | 0.9984 |
| 60.4202 | 0.0281 | 0.9995 |
TABLE 4.
Average computation results on the benchmark data sets
| Data sets | PSNR | MSE | SSIM |
|---|---|---|---|
| COVID‐19 CT segmentation | 60.4111 | 0.0366 | 0.9996 |
| Chinese Hospital | 58.8402 | 0.0448 | 0.9997 |
| Pakistani Hospital | 59.6863 | 0.0406 | 0.9997 |
| BSIT data | 53.5280 | 0.1633 | 0.9993 |
FIGURE 8.
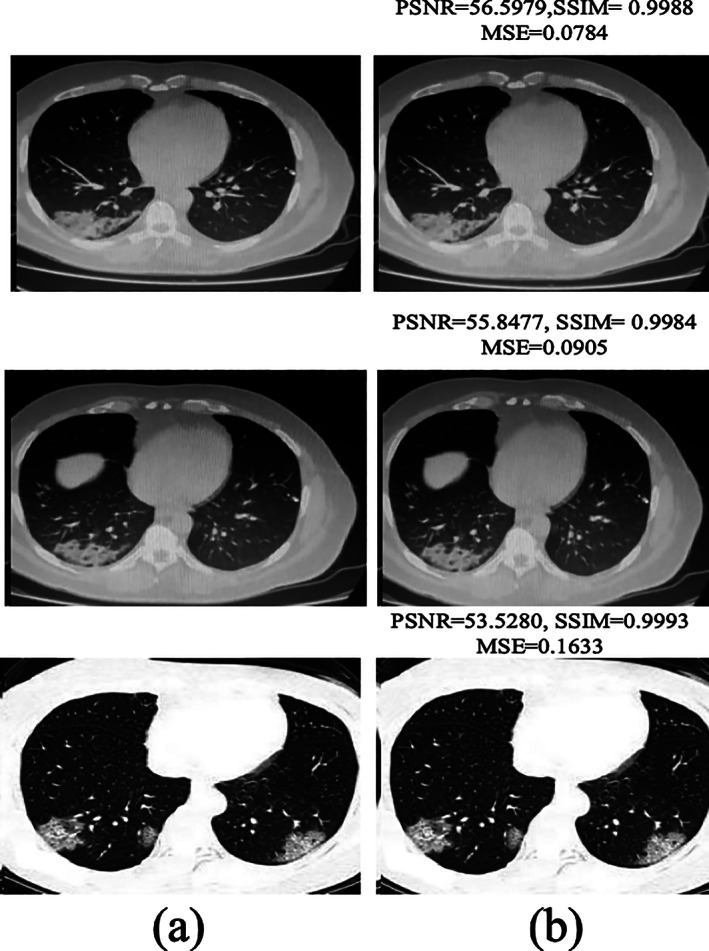
Noise reduction: (a) input images and (b) after applying DnCNN
The empirical results image by image are mentioned in Table 3, the numerical result shows significant enhancement in PSNR after applying the DnCNN method. The average enhancement results are also computed separately on benchmark data sets as mentioned in Table 4.
Table 4 shows that the method obtained PSNR of 60.4111 on COVID‐19 CT segmentation data set, 58.8402 on Chinese Hospital data set, 59.6863 on Pakistani Hospital and 53.5280 on BSIT data set.
4.2. Experiment#2: Using proposed semantic segmentation model
The proposed model is validated in terms of mean intersection over union (mIoU), global accuracy (GAc), Weighted IoU (wIoU), mean accuracy (mAc), and F1 score on COVID‐19 segmentation and Pakistani Hospitals data sets. In addition, the average segmentation outcomes are mentioned in Table 5.
TABLE 5.
Segmentation outcomes with ground truth annotations
| Data set | GAc | mAc | mIoU | wIoU | mBF score |
|---|---|---|---|---|---|
| COVID19 segmentation | 0.96 | 0.910 | 0.89 | 0.93 | 0.83 |
| POF Hospital | 0.97 | 0.93 | 0.91 | 0.95 | 0.85 |
The results in Table 5 show that the proposed method achieved 0.97 GAc on the POF Hospital data set, whereas 0.96 GAc on COVID‐19 segmentation data set. Figures 9 and 10 demonstrate the segmentation of lung CT photographs using ground truth.
FIGURE 9.
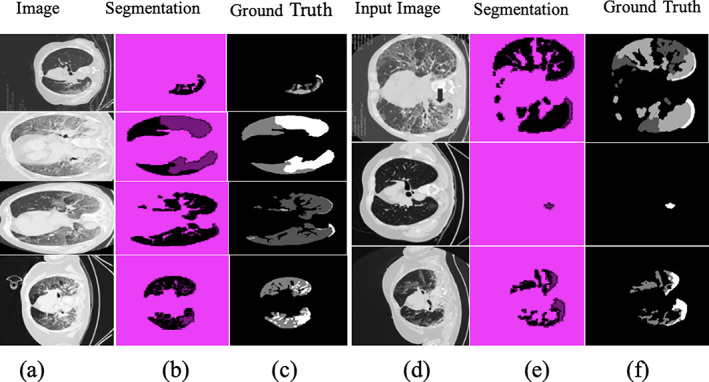
Segmentation results on COVID19 segmentation data set (a), (d) input CT images; (b) and (e) segmentation; and (c) and (f) truth annotated
FIGURE 10.
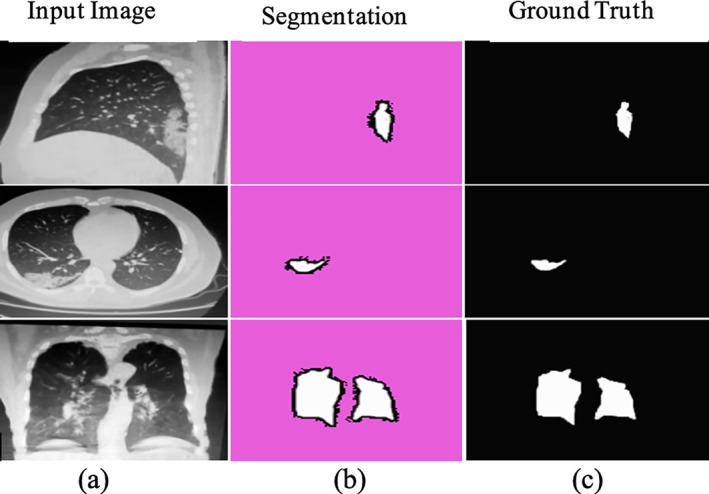
Segmentation results with ground truth on POF Hospital data set (a) input; (b) Covid‐19 segmentation; and (c) truth annotated
4.3. Experiment#3: Using fine‐tuned SSAE model for classification
A combination of SAE1 and SAE2 designs SSAE model. The configuration parameters such as hidden units, sparsity proportion, L2weight regularization, and number of epochs of SAE1 & SAE2 are selected after extensive experimentation that provides help to learn the complicated patterns as mentioned in Table 6. The computation time of the training model is depicted in Table 7.
TABLE 6.
Hyperparameters of proposed model training
| SAE1 | SAE2 | Error rate | ||||||||
|---|---|---|---|---|---|---|---|---|---|---|
| L2 Weight regularization | Hidden size | Max epochs | Sparsity regularization | Sparsity proportion | L2 Weight regularization | Hidden size | Max epochs | Sparsity regularization | Sparsity proportion | |
| 0.002 | 200 | 250 | 0.4 | 0.45 | 0.002 | 300 | 300 | 3 | 0.35 | 0.046 |
| 0.004 | 100 | 150 | 0.5 | 0.55 | 0.003 | 350 | 400 | 5 | 0.45 | 0.107 |
| 0.001 | 200 | 400 | 0.5 | 0.35 | 0.003 | 400 | 400 | 4 | 0.25 | 0.014 |
Bold italic represent the optimum values that are selected after the extensive experiment.
TABLE 7.
Proposed technique's computation time
| Training | Testing |
|---|---|
| 10 min | 1 min 2 s |
The selected configuration parameters with error rates are graphically shown in Figure 11.
FIGURE 11.
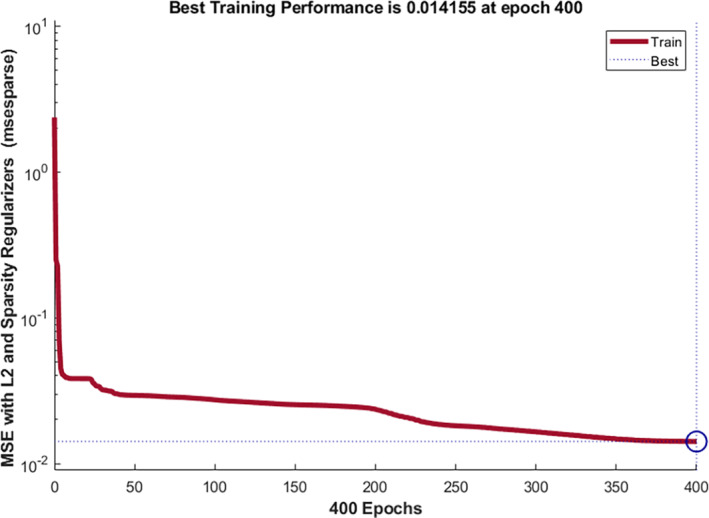
Fine tune model configuration parameters with error rate
The optimized configuration parameters (highlighted bold italic) having less error rate are used for model training. The testing is performed on a trained SSAE model for COVID‐19 CT classification. The testing results are plotted in confusion matrixes that are shown, that is, Figure 12. Table 7, shows the computational time of the proposed model.
FIGURE 12.
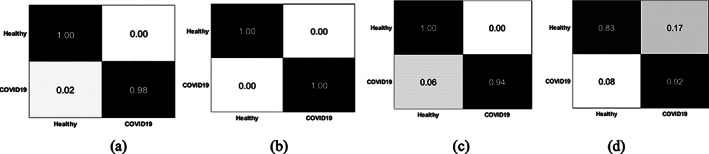
Confusion matrix on benchmark data sets (a) BSTI; (b) China Hospital; (c) POF hospital; and (d) COVID19 segmentation
The training time of the proposed model is 10 min, and the testing time is 1 min & 2 s.
Figure 12 shows, confusion matrix that represent the 0.00 FP, 0.02 FN on BSTI, 0.00 FP, FN on Wuhan China data set, 0.00 FP, 0.06 FN on POF Hospital data set, and 0.17 FP, 0.08 FN on COVID‐19 segmentation data set (Italian). The empirical classification results are computed based on FP, FN, TP, and TN as mentioned in Tables 8, 9, 10, 11.
TABLE 8.
Classification of healthy/COVID‐19 CT images on POF Hospital
| Overall accuracy: 99.23% | ||||
|---|---|---|---|---|
| Classes | Accuracy | Precision | Sensitivity | F1 score |
| Healthy | 99.23% | 1.0 | 0.99 | 0.99 |
| COVID‐19 | 99.23% | 0.98 | 1.0 | 0.99 |
TABLE 9.
Classification of healthy/COVID‐19 CT images on China Hospital
| Overall accuracy: 100% | ||||
|---|---|---|---|---|
| Classes | Accuracy | Precision | Sensitivity | F1 score |
| Healthy | 100% | 1.0 | 1.0 | 1.0 |
| COVID‐19 | 100% | 1.0 | 1.0 | 1.0 |
TABLE 10.
Classification of healthy/COVID‐19 CT images on BSTI
| Overall accuracy: 96.15% | ||||
|---|---|---|---|---|
| Class | Accuracy | Precision | Sensitivity | F1 score |
| Healthy | 96.15% | 0.99 | 0.94 | 0.96 |
| COVID‐19 | 96.15% | 0.94 | 0.98 | 0.96 |
TABLE 11.
Classification of healthy/COVID‐19 CT images on COVID‐19 segmentation data
| Overall accuracy: 86.47% | ||||
|---|---|---|---|---|
| Classes | Accuracy | Precision | Sensitivity | F1 score |
| Healthy | 86.47% | 0.83 | 0.95 | 0.88 |
| COVID‐19 | 86.47% | 0.92 | 0.77 | 0.84 |
The classification results on Tables 8, 9, 10, 11 show that the method achieved an accuracy of 99.23% on the POF Hospital data set, 100% on the Wuhan China data set, 96.15% on the BSIT data set, and 86.47% COVID19 segmentation data set. The quantitative assessment shows that method achieved higher accuracy on Chinese and POF Hospital data sets than another benchmark data set. The proposed method performance is also plotted in terms of ROC in Figure 13.
FIGURE 13.
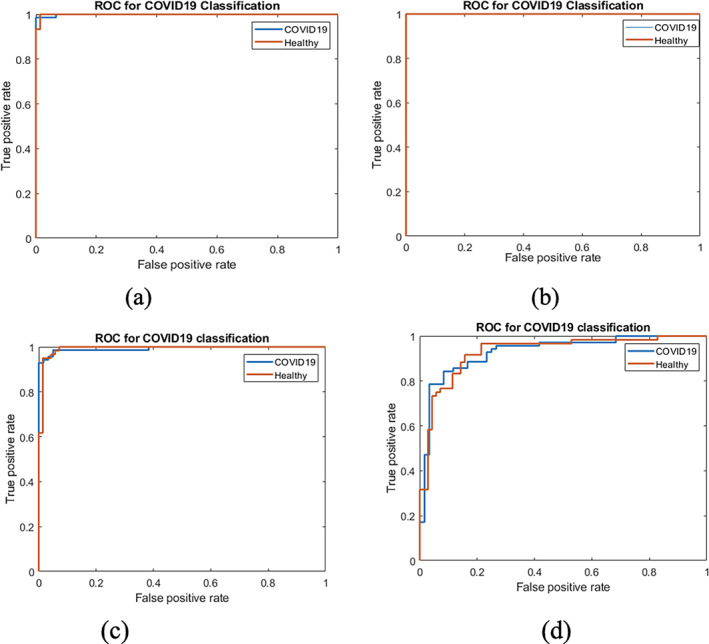
ROC on benchmark data sets (a) POF hospital; (b) China Hospital; (c) BSTI; and (d) COVID‐19 segmentation
The proposed model achieves higher accuracy and ROC as presented in Tables 8, 9, 10, 11 and Figure 13, authenticating the proposed model's effectiveness and contribution. Finally, the proposed approach outcomes are compared to the latest existing works, as depicted in Table 12.
TABLE 12.
Comparison of the proposed techniques outcomes to existing works
Table 12 depicts the results comparison in which we achieved 1.00 ACC for classification of COVID‐19, whereas existing works provide maximum 0.89 ACC. Thus, the comparison of COVID‐19 outcomes shows that the presented framework is outperformed the existing works.
5. CONCLUSION
In this retrospective study, ensemble deep convolutional neural networks are presented to overcome the existing challenges that are facing for accurate detection of the COVID‐19. During image acquisition, noise appears in the CT images that degrade the image quality, affecting the segmentation results. Therefore, noise reduction is a preprocessing step for the accurate detection of lesions, which is also a challenging task and is handled by applying a proposed DnCNN model. The model performance is computed in terms of PSNR, MSE, and SSIM. The model achieves 60.4111 PSNR, 0.0366 MSE, 0.9996 SSIM on COVID‐19 CT segmentation data set, 58.8402 PSNR, 0.0448 MSE, 0.9997 SSIM on Wuhan Chinese data set, 59.6863 PSNR, 0.0406 MSE, 0.9997 SSIM on POF Hospital data set, 53.5280 PSNR, 0.1633 MSE, and 0.9993 SSIM on BSIT data set. The second challenge is lesion segmentation because COVID‐19 having variable shapes and size. Therefore, after extensive experimentation, the semantic segmentation model is proposed to handle this challenge, with the selected configuration parameters. On the COVID19 segmentation data set, the model obtains 0.96 GAc, and on the POF Hospital data set, it obtains 0.97 GAc. The quantitative and visually presented results demonstrate that the method segment the infected region accurately. Finally, classification is another challenge for screening of the healthy/COVID‐19 images. Because accurate results of the classification depend upon the features extraction method. To handle this issue, in this study, SSAE model is proposed having optimized configuration parameters that provide significant improvement in the classification of the healthy/COVID‐19 CT images.
CONFLICTS OF INTEREST
The authors declare that they have no conflicts of interest to report regarding the present study.
ETHICS STATEMENT
No experiments are conducted on animals or humans, only benchmark data sets are considered for experiments.
Amin, J. , Anjum, M. A. , Sharif, M. , Rehman, A. , Saba, T. , & Zahra, R. (2022). Microscopic segmentation and classification of COVID‐19 infection with ensemble convolutional neural network. Microscopy Research and Technique, 85(1), 385–397. 10.1002/jemt.23913
Review Editor: Alberto Diaspro
DATA AVAILABILITY STATEMENT
The data that support the findings of this study are openly available in [CT segmentation COVID19 dataset] at [http://medicalsegmentation.com/covid19].
REFERENCES
- Ai, T. , Yang, Z. , Hou, H. , Zhan, C. , Chen, C. , Lv, W. , … Xia, L. (2020). Correlation of chest CT and RT‐PCR testing in coronavirus disease 2019 (COVID‐19) in China: A report of 1014 cases. Radiology, 296(2), E32–E40. [DOI] [PMC free article] [PubMed] [Google Scholar]
- Amin, J. , Sharif, M. , Raza, M. , Saba, T. , & Anjum, M. A. (2019). Brain tumor detection using statistical and machine learning method. Computer Methods and Programs in Biomedicine, 177, 69–79. [DOI] [PubMed] [Google Scholar]
- Amin, J. , Sharif, M. , Raza, M. , Saba, T. , & Rehman, A. (2019). Brain tumor classification: feature fusion. 2019 International Conference on Computer and Information Sciences (ICCIS) (pp. 1‐6). IEEE.
- Amin, J. , Sharif, M. , Raza, M. , Saba, T. , Sial, R. , & Shad, S. A. (2020). Brain tumor detection: A long short‐term memory (LSTM)‐based learning model. Neural Computing and Applications, 32, 15965–15973. [Google Scholar]
- Amin, J. , Sharif, M. , Yasmin, M. , Saba, T. , & Raza, M. (2019). Use of machine intelligence to conduct analysis of human brain data for detection of abnormalities in its cognitive functions. Multimedia Tools & Applications, 79(15), 10955–10973. 10.1007/s11042-019-7324-y [DOI] [Google Scholar]
- Ardakani, A. A. , Kanafi, A. R. , Acharya, U. R. , Khadem, N. , & Mohammadi, A. (2020). Application of deep learning technique to manage COVID‐19 in routine clinical practice using CT images: Results of 10 convolutional neural networks. Computers in Biology and Medicine, 121, 103795. [DOI] [PMC free article] [PubMed] [Google Scholar]
- Burgos‐Artizzu, X. P. (2020). Computer‐aided covid‐19 patient screening using chest images (X‐ray and CT scans). medRxiv .
- Chen, L.‐C. , Zhu, Y. , Papandreou, G. , Schroff, F. & Adam, H. (2018). Encoder‐decoder with atrous separable convolution for semantic image segmentation. Paper presented at the Proceedings of the European conference on computer vision (ECCV).
- Choe, J. , Lee, S. M. , Do, K.‐H. , Lee, G. , Lee, J. G. , Lee, S. M. , & Seo, J. B. (2019). Deep learning–based image conversion of CT reconstruction kernels improves Radiomics reproducibility for pulmonary nodules or masses. Radiology, 292(2), 365–373. [DOI] [PubMed] [Google Scholar]
- COVID‐19 CT segmentation dataset. Retrieved from http://medicalsegmentation.com/covid19/
- Ejaz, K. , Rahim, M. S. M. , Bajwa, U. I. , Chaudhry, H. , Rehman, A. , & Ejaz, F. (2021). Hybrid segmentation method with confidence region detection for tumor identification. IEEE Access, 9, 35256–35278. 10.1109/ACCESS.2020.3016627 [DOI] [Google Scholar]
- Ewen, N. , & Khan, N. (2020). Targeted Self Supervision for Classification on a Small COVID‐19 CT Scan Dataset. arXiv preprint arXiv:2011.10188 .
- Fahad, H. M. , Ghani Khan, M. U. , Saba, T. , Rehman, A. , & Iqbal, S. (2018). Microscopic abnormality classification of cardiac murmurs using ANFIS and HMM. Microscopy Research and Technique, 81(5), 449–457. [DOI] [PubMed] [Google Scholar]
- Guo, Y.‐R. , Cao, Q.‐D. , Hong, Z.‐S. , Tan, Y.‐Y. , Chen, S.‐D. , Jin, H.‐J. , … Yan, Y. (2020). The origin, transmission and clinical therapies on coronavirus disease 2019 (COVID‐19) outbreak–an update on the status. Military Medical Research, 7(1), 1–10. [DOI] [PMC free article] [PubMed] [Google Scholar]
- Haimed, A. M. A. , Saba, T. , Albasha, A. , Rehman, A. , & Kolivand, M. (2021). Viral reverse engineering using artificial intelligence and big data COVID‐19 infection with long short‐term memory (LSTM). Environmental Technology & Innovation, 22, 101531. [DOI] [PMC free article] [PubMed] [Google Scholar]
- He, K. , Zhang, X. , Ren, S. , & Sun, J. (2016). Deep residual learning for image recognition. Paper presented at the Proceedings of the IEEE conference on computer vision and pattern recognition.
- He, K. , Zhao, W. , Xie, X. , Ji, W. , Liu, M. , Tang, Z. , … Liu, J. (2021). Synergistic learning of lung lobe segmentation and hierarchical multi‐instance classification for automated severity assessment of COVID‐19 in CT images. Pattern Recognition, 113, 107828. [DOI] [PMC free article] [PubMed] [Google Scholar]
- Jamal, A. , Hazim Alkawaz, M. , Rehman, A. , & Saba, T. (2017). Retinal imaging analysis based on vessel detection. Microscopy Research and Technique, 80(17), 799–811. 10.1002/jemt [DOI] [PubMed] [Google Scholar]
- Jamil, M. , & Hussain, I. J. . (2020). Automatic Detection of COVID‐19 Infection from Chest X‐ray using Deep Learning, medRixv .
- Johannes, H. , Jeanny, P. , Sebastian, R. , Helmut, P. , & Georg, L. (2020). Automatic lung segmentation in routine imaging is primarily a data diversity problem, not a methodology problem. European Radiology Experimental, 4(1), 50. [DOI] [PMC free article] [PubMed] [Google Scholar]
- Khan, M. A. , Javed, M. Y. , Sharif, M. , Saba, T. , & Rehman, A. (2019). Multi‐model deep neural network based features extraction and optimal selection approach for skin lesion classification. 2019 International Conference on Computer and Information Sciences (ICCIS) (pp. 1–7). IEEE.
- Khan, M. A. , Kadry, S. , Zhang, Y. D. , Akram, T. , Sharif, M. , Rehman, A. , & Saba, T. (2021). Prediction of COVID‐19 ‐ pneumonia based on selected deep features and one class kernel extreme learning machine. Computers & Electrical Engineering, 90. [DOI] [PMC free article] [PubMed] [Google Scholar]
- Khan, M. Z., Khan, M. U. G., Saba, T., Razzak, I., Rehman, A., & Bahaj, S. A. (2021). Hot‐Spot zone detection to tackle COVID19 spread by fusing the traditional machine learning and deep learning approaches of computer vision. IEEE Access, vol.9, pp. 1000040‐100049.
- Khan, S. A. , Nazir, M. , Khan, M. A. , Saba, T. , Javed, K. , Rehman, A. , … Awais, M. (2019). Lungs nodule detection framework from computed tomography images using support vector machine. Microscopy Research and Technique, 82(8), 1256–1266. [DOI] [PubMed] [Google Scholar]
- Li, L. , Qin, L. , Xu, Z. , Yin, Y. , Wang, X. , Kong, B. , … Song, Q. J. R. (2020). Artificial intelligence distinguishes COVID‐19 from community‐acquired pneumonia on chest CT. Radiology, 296(2), 200905. [DOI] [PMC free article] [PubMed] [Google Scholar]
- Liaqat, A. , Khan, M. A. , Shah, J. H. , Sharif, M. , Yasmin, M. , & Fernandes, S. L. (2018). Automated ulcer and bleeding classification from WCE images using multiple features fusion and selection. Journal of Mechanics in Medicine and Biology, 18(04), 1850038. [Google Scholar]
- Mahersia, H. , Zaroug, M. , & Gabralla, L. (2015). Lung cancer detection on CT scan images: A review on the analysis techniques. International Journal of Advanced Research in Artificial Intelligence, 4(4), 1–8. [Google Scholar]
- McCall, B. (2020). COVID‐19 and artificial intelligence: Protecting health‐care workers and curbing the spread. Lancet Digital Health, 2(4), e166–e167. [DOI] [PMC free article] [PubMed] [Google Scholar]
- Nicola, M. , Alsafi, Z. , Sohrabi, C. , Kerwan, A. , Al‐Jabir, A. , Iosifidis, C. , … Agha, R. (2020). The socio‐economic implications of the coronavirus and COVID‐19 pandemic: a review. International Journal of Surgery, 78, 185–193. [DOI] [PMC free article] [PubMed] [Google Scholar]
- Olshausen, B. A. , & Field, D. J. (1997). Sparse coding with an overcomplete basis set: A strategy employed by V1? Vision Research, 37(23), 3311–3325. [DOI] [PubMed] [Google Scholar]
- Pham, T. (2020). A comprehensive study on classification of COVID‐19 on computed tomography with pretrained convolutional neural networks. Scientific Reports, 10, 16942. [DOI] [PMC free article] [PubMed] [Google Scholar]
- Ramzan, F. , Khan, M. U. G. , Rehmat, A. , Iqbal, S. , Saba, T. , Rehman, A. , & Mehmood, Z. (2020). A deep learning approach for automated diagnosis and multi‐class classification of Alzheimer's disease stages using resting‐state fMRI and residual neural networks. Journal of Medical Systems, 44(2), 37. [DOI] [PubMed] [Google Scholar]
- Rehman, A. , Khan, M. A. , Mehmood, Z. , Saba, T. , Sardaraz, M. , & Rashid, M. (2020). Microscopic melanoma detection and classification: A framework of pixel‐based fusion and multilevel features reduction. Microscopy Research and Technique, 83(4), 410–423. [DOI] [PubMed] [Google Scholar]
- Rehman, A. , Saba, T. , Ayesha, N. , & Tariq, U. (2021a). Deep learning‐based COVID‐19 detection using CT and X‐ray images: Current analytics and comparisons. IEEE IT Professional, 23, 63–68. 10.1109/MITP.2020.3036820 [DOI] [PMC free article] [PubMed] [Google Scholar]
- Rehman, A. , Sadad, T. , Saba, T. , Hussain, A. , & Tariq, U. (2021b). Real‐time diagnosis system of COVID‐19 using X‐ray images and deep learning. IEEE IT Professional, 23, 63–68. 10.1109/MITP.2020.3042379 [DOI] [PMC free article] [PubMed] [Google Scholar]
- Rodriguez‐Morales, A. J. , Cardona‐Ospina, J. A. , Gutiérrez‐Ocampo, E. , Villamizar‐Peña, R. , Holguin‐Rivera, Y. , Escalera‐Antezana, J. P. , … Latin American Network of Coronavirus Disease 2019‐COVID‐19 Research (LANCOVID‐19) . (2020). Clinical, laboratory and imaging features of COVID‐19: A systematic review and meta‐analysis. Travel Medicine and infectious Disease, 34, 101623. [DOI] [PMC free article] [PubMed] [Google Scholar]
- Saba, T. (2019). Automated lung nodule detection and classification based on multiple classifiers voting. Microsc Res Tech. 82(9), 1601–1609. 10.1002/jemt.23326 [DOI] [PubMed] [Google Scholar]
- Saba, T. , Abunadi, I. , Shahzad, M. N. , & Khan, A. R. (2021). Machine learning techniques to detect and forecast the daily total COVID‐19 infected and deaths cases under different lockdown types. Microscopy Research and Technique, 84, 1462–1474. 10.1002/jemt.23702 [DOI] [PMC free article] [PubMed] [Google Scholar]
- Singhal, T. (2020). A review of coronavirus disease‐2019 (COVID‐19). Indian Journal of Pediatrics, 87, 281–286. [DOI] [PMC free article] [PubMed] [Google Scholar]
- Sohrabi, C. , Alsafi, Z. , O'Neill, N. , Khan, M. , Kerwan, A. , Al‐Jabir, A. , … Agha, R. (2020). World Health Organization declares global emergency: A review of the 2019 novel coronavirus (COVID‐19). International Journal of Surgery, 76, 71–76. [DOI] [PMC free article] [PubMed] [Google Scholar]
- World Health Organization . Retrieved from https://www.who.int/emergencies/diseases/novel‐coronavirus‐2019?adgroupsurvey={adgroupsurvey}&gclid=CjwKCAjw‐qeFBhAsEiwA2G7Nl3eAxKeqwr57jd1EHSqhIyQ2N6wXNZ8hpmh5Zeouz83023Irg1qZLBoCuwcQAvD_BwE
- Xia, J., Jianping, T., Mengyun, L., Ye, S., & Dongyu, G. (2020). Evaluation of coronavirus in tears and conjunctival secretions of patients with SARS‐CoV‐2 infection. Journal of medical virology, 92(6), 589–594. [DOI] [PMC free article] [PubMed] [Google Scholar]
- Yang, X. , He, X. , Zhao, J. , Zhang, Y. , Zhang, S. , & Xie, P. (2020). COVID‐CT‐dataset: A CT scan dataset about COVID‐19. ArXiv e‐Prints, arXiv: 2003.13865.
- Yi, Y. , Lagniton, P. N. , Ye, S. , Li, E. , & Xu, R.‐H. J. (2020). COVID‐19: What has been learned and to be learned about the novel coronavirus disease. International Journal of Biological Sciences, 16(10), 1753. [DOI] [PMC free article] [PubMed] [Google Scholar]
- Zhang, K. , Zuo, W. , Chen, Y. , Meng, D. , & Zhang, L. (2017). Beyond a gaussian denoiser: Residual learning of deep CNN for Image Denoising. IEEE Transactions on Image Processing, 26(7), 3142–3155. [DOI] [PubMed] [Google Scholar]
- Zhao, J. , Zhang, Y. , He, X. , & Xie, P. J. (2020). Covid‐ct‐dataset: A CT scan dataset about covid‐19.
Associated Data
This section collects any data citations, data availability statements, or supplementary materials included in this article.
Data Availability Statement
The data that support the findings of this study are openly available in [CT segmentation COVID19 dataset] at [http://medicalsegmentation.com/covid19].