

Summary
Social restrictions necessary to reduce the spread of coronavirus disease 2019 (COVID‐19) profoundly changed how we socialised, worked and, for students, attended classes. Interestingly, significant sleep pattern shifts occurred in the context of pandemic‐related social restrictions. Whether age and chronotype influenced these sleep pattern changes remains poorly understood. In this pre‐registered (https://osf.io/4a3fx), web‐based study, United States residents reported, in one‐time assessments, demographic information, self‐reported chronotype using the reduced Morningness–Eveningness Questionnaire, and pre‐pandemic and pandemic first wave sleep timing using the Ultrashort Munich Chronotype Questionnaire. Participants reported sleep phase delays, reduced social jetlag (SJL) and reduced social sleep restriction (SSR) during the first wave of the pandemic compared to pre‐pandemic. Pandemic‐related changes in SJL and SSR varied with participants’ age and self‐reported chronotype. Young adults reported the greatest reductions in SJL and young adults and individuals with evening chronotypes reported the greatest reductions in SSR. We conclude that these groups may have been the most vulnerable to social–biological sleep timing desynchrony under pre‐pandemic social, occupational, and educational schedules.
Keywords: age, chronotype, COVID‐19, Munich chronotype questionnaire, social jetlag, social sleep restriction
1. INTRODUCTION
Stay‐at‐home orders and social distancing implemented to reduce spread of the coronavirus disease 2019 (COVID‐19) offered unique insight into how sleep patterns change with greater flexibility in (or reduced opportunities for) social, educational, and occupational demands. Delayed sleep timing (i.e. later bedtimes and rise‐times), as well as reduced social jetlag (SJL; the difference between workday and free‐day sleep timing) and social sleep restriction (SSR; the difference between workday and free‐day sleep duration), have been among the most consistent findings (Blume et al., 2020; Cellini et al., 2020; Gao & Scullin, 2020; Korman et al., 2020; Leone et al., 2020; Wright et al., 2020).
However, whether pandemic‐related sleep timing changes were associated with age or chronotype, two factors that strongly influence sleep timing (Roenneberg et al., 2004; Wittmann et al., 2006), remains underspecified. SJL, a type of social–biological sleep timing desynchrony, is greatest in adolescence into early adulthood and lowest in older age (Zhang et al., 2019). Further, SJL is greatest in those with evening chronotypes (Wittmann et al., 2006) – individuals with a predisposition for late bed‐ and rise‐times. Chronotype linearly shifts across the lifespan (Levandovski et al., 2011), with younger individuals exhibiting a greater tendency toward an evening chronotype and older individuals exhibiting a greater tendency toward a morning chronotype (i.e. early bed‐ and rise‐times; Roenneberg et al., 2004).
In this pre‐registered investigation (https://osf.io/4a3fx), we characterised pandemic‐related sleep timing changes (bed‐ and rise‐times, SJL, SSR) in a USA sample. In the USA, social restrictions were ubiquitous and included non‐essential business and school closures, travel bans, and physical distancing requirements. We further explored whether USA participants’ age and self‐reported chronotype, two indicators of sleep timing desynchrony under non‐pandemic conditions (e.g. Roenneberg et al., 2004; Wittmann et al., 2006), were associated with the magnitude of changes in sleep timing during the first wave of the pandemic (April–May 2020) compared to pre‐pandemic (December 2019–January 2020).
Aligning with recent findings, we hypothesised that participants would report later bed‐ and rise‐times, increased sleep duration and reduced SJL and SSR during the first wave of the pandemic compared to pre‐pandemic. Pandemic‐related restrictions likely relaxed scheduling demands, allowing for greater adherence to sleep schedules based on biological sleep drives. We therefore hypothesised that younger adults and those with evening chronotypes, groups most vulnerable to social–biological sleep desynchrony, would report the greatest reductions in SJL and SSR.
2. METHODS
2.1. Participants
Data collection took place in the context of a larger longitudinal online study exploring how the COVID‐19 pandemic impacted emotional well‐being and sleep, which was open globally for adult participants aged ≥18 years (Cunningham et al., 2021). Recruitment primarily occurred through word of mouth, social media posts and snowballing methods. A total of 839 participants completed the sleep and demographics questionnaires. In the present study, we included a subset of 691 USA participants aged 18–89 years. We excluded 148 non‐USA participants as the timing of social restrictions in other countries was variably aligned with the administration of our assessments. Further, we excluded 81 participants who did not complete required surveys or engaged in shift‐work in the 3‐months prior to administration of the surveys. This resulted in a final sample of 610 USA adults (aged 18–89 years), representing 43 USA States, who completed the demographics questionnaire and Ultrashort Munich Chronotype Questionnaire (μMCTQ; for sample demographics, see Table 1). A subset of 418 participants completed the reduced Morningness–Eveningness Questionnaire (rMEQ). Ethical approval was obtained from the Boston College Institutional Review Board and all participants completed informed consent prior to study participation. As compensation, participants were entered into a drawing to receive gift cards.
TABLE 1.
Participant demographics
| Variable | Value |
| Sample size, N | 610 |
| Age, years | |
| Mean | 39.24 |
| SD | 17.45 |
| Minimum | 18 |
| 25th percentile | 27 |
| Median | 32 |
| 75th percentile | 49 |
| Maximum | 90 |
| Ethnicity, % | |
| Hispanic | 4.1 |
| Not Hispanic | 94.6 |
| Prefer not to say (ethnicity) | 1.3 |
| Race, % | |
| African American | 1.8 |
| Asian | 8.0 |
| White | 82.0 |
| Hispanic/Latinx | 1.6 |
| Native Hawaiian or Other Pacific Islander | 0.0 |
| American Indian/Alaska Native | 0.2 |
| More than one race/prefer to self‐describe | 5.2 |
| Unknown | 0.5 |
| Prefer not to say (race) | 0.7 |
| Gender, % | |
| Female | 82.9 |
| Male | 15.8 |
| Non‐binary/third gender | 0.5 |
| Prefer to self‐describe | 0.7 |
| Prefer not to say | 0.2 |
| Biological sex, % | |
| Female | 83.6 |
| Male | 16.4 |
| Gender identity, % | |
| Cisgender | 98.7 |
| Transgender | 0.8 |
| Prefer not to say | 0.5 |
| Sexual orientation, % | |
| Straight/heterosexual | 83.6 |
| Bisexual | 11.2 |
| Gay/lesbian | 2.6 |
| Prefer to self‐describe | 1.7 |
| Prefer not to say | 0.8 |
| Education, % | |
| Some high school | 0.5 |
| High school diploma or GED | 1.8 |
| Some college | 11.3 |
| Bachelor’s degree | 24.4 |
| Some post‐bachelor | 9.7 |
| Graduate, medical, or professional degree | 52.3 |
| Relationship status, % | |
| Single | 29.2 |
| In a relationship | 25.1 |
| Married | 38.0 |
| Separated/divorced | 4.8 |
| Widowed | 3.0 |
| Serious medical problems?, % | |
| Yes | 8.4 |
| No | 91.6 |
| Income, % | |
| $0−25,000 | 6.6 |
| $25,001–50,000 | 15.2 |
| $50,001–75,000 | 16.9 |
| $75,001–100,000 | 16.6 |
| $100,001–150,000 | 19.8 |
| $150,001–250,000 | 15.2 |
| $250,000+ | 9.7 |
| Are you a full‐time student?, % | |
| Yes | 22.1 |
| No | 77.9 |
| Are you currently employed?, % | |
| Yes | 74.5 |
| No | 25.5 |
GED, General Education Development.
2.2. Procedures
All survey data were collected online using the Research Electronic Data Capture (REDCap™) system (2013, Vanderbilt U) through Boston College. During study enrollment (which began on March 20, 2020), participants completed a demographics survey (Table 1). Participants later completed the µMCTQ (Ghotbi et al., 2020) twice at one time; once which queried sleep patterns in the 6‐weeks prior to February 1, 2020 (prior to the progressive implementation of COVID‐19 restrictions in the USA) and a second time in the 6‐weeks prior to ~May 19, 2020 (corresponding to the first‐wave of the COVID‐19 pandemic). The μMCTQ queried bed‐ and rise‐times on workdays and free days. In a separate assessment, participants completed the rMEQ (Danielsson et al., 2019), which assessed self‐reported chronotype. The rMEQ queries wake‐up and bed‐times, tiredness soon after awakening, time of day when respondents feel their best and whether respondents consider themselves a “morning” or “evening” type. For additional information about study instruments, see Appendix S1.
2.2.1. Primary outcome measures
Sleep‐onset time, sleep‐end time, sleep duration (total amount of time between sleep‐onset time and sleep‐end time) and sleep midpoint (circular mean of sleep‐onset and sleep‐end times expressed as minutes past midnight) on workdays and free days were drawn from each µMCTQ. We used these values to calculate SJL (difference between workday and free‐day sleep midpoint) and SSR (difference between workday and free‐day total sleep time). We further calculated change in SJL (ΔSJL) and SSR (ΔSSR) by subtracting pre‐pandemic from pandemic first‐wave values (i.e. more negative values correspond to greater reductions in these sleep timing measures).
2.3. Statistical analyses
Our confirmatory sleep‐timing analyses were pre‐registered on Open Science Framework (https://osf.io/4a3fx) and open‐access data are available online (https://osf.io/gpxwa/). In brief, we compared sleep duration, sleep‐onset, sleep midpoint, and sleep‐end time during the first wave of the COVID‐19 pandemic (April‐May 2020) to pre‐pandemic (December 2019–January 2020) with a 2 day (workday, free day) × 2 pandemic phase (pre‐pandemic, pandemic first wave) analysis of variance (ANOVA) with follow‐up trimmed tests. In exploratory analyses, we correlated participants’ age and self‐reported chronotype with SJL and SSR using Kendall’s Tau. We observed a significant correlation between age and self‐reported chronotype (τ = 0.18, 95% confidence interval [CI] 0.12–0.24, p < 0.001), so performed additional regression analyses including both variables in our models. After seeing the results, we additionally explored whether presence of a diagnosed depressive or anxiety disorder, psychiatric symptom severity, self‐reported sleep quality and measures of daily activity were associated with ΔSJL and ΔSSR, as well as age and chronotype (results and additional discussion are noted in Appendix S1). For a comprehensive review of our survey instruments and additional details about our statistical approach, please refer to the Appendix S1.
3. RESULTS
3.1. Confirmatory analyses
The ANOVA results with follow‐up contrasts are listed in Table 2 and descriptive statistics are listed in Table S1.
TABLE 2.
Results of the sleep timing trimmed mean ANOVA and follow‐up trimmed t tests
| Statistic | p | Difference, min (95% CI) | |
|---|---|---|---|
| Sleep duration | |||
| Trimmed ANOVA | |||
| Main effect of pandemic | Q = 0.02 | 0.887 | |
| Main effect of day | Q = 172.09 | <0.001 | |
| Interaction | Q = 63.31 | <0.001 | |
| Follow‐up trimmed t tests | |||
| Pre‐pandemic: free day – workday | t(343.0) = 14.44 | <0.001 | 39.24 (33.90, 44.58) |
| First wave: free day – workday | t(343.0) = 7.46 | <0.001 | 17.81 (13.11, 22.50) |
| Workday: first wave – pre‐pandemic | t(343.0) = 4.07 | <0.001 | 10.44 (5.39, 15.48) |
| Free day: first wave – pre‐pandemic | t(343.0) = −4.96 | <0.001 | −11.00 (−15.37, −6.63) |
| Average week sleep time (weighted average of free‐ and workdays) | |||
| First wave – pre‐pandemic | t(343.0) = 2.29 | 0.023 | 4.85 (0.68, 9.03) |
| Sleep‐onset | |||
| Trimmed ANOVA | |||
| Main effect of pandemic | Q = 98.05 | <0.001 | |
| Main effect of day | Q = 316.85 | <0.001 | |
| Interaction | Q = 28.73 | <0.001 | |
| Follow‐up trimmed t tests | |||
| Pre‐pandemic: free day – workday | t(354.0) = 17.01 | <0.001 | 39.97 (35.35, 44.60) |
| First wave: free day – workday | t(354.0) = 13.68 | <0.001 | 28.15 (24.10, 32.19) |
| Workday: first wave – pre‐pandemic | t(354.0) = 11.67 | <0.001 | 26.72 (22.22, 31.23) |
| Free day: first wave – pre‐pandemic | t(354.0) = 6.07 | <0.001 | 14.90 (10.07, 19.72) |
| Sleep‐end | |||
| Trimmed ANOVA | |||
| Main effect of pandemic | Q = 81.51 | <0.001 | |
| Main effect of day | Q = 622.17 | <0.001 | |
| Interaction | Q = 86.44 | <0.001 | |
| Follow‐up trimmed t tests | |||
| Pre‐pandemic: free day – workday | t(354.0) = 25.01 | <0.001 | 81.39 (74.99, 87.79) |
| First wave: free day – workday | t(354.0) = 18.95 | <0.001 | 54.91 (49.21, 60.61) |
| Workday: first wave – pre‐pandemic | t(354.0) = 11.58 | <0.001 | 32.81 (27.23, 38.38) |
| Free day: first wave – pre‐pandemic | t(354.0) = 2.71 | 0.007 | 6.32 (1.74, 10.91) |
| Sleep midpoint | |||
| Trimmed ANOVA | |||
| Main effect of pandemic | Q = 118.33 | <0.001 | |
| Main effect of day | Q = 576.49 | <0.001 | |
| Interaction | Q = 88.17 | <0.001 | |
| Follow‐up trimmed t tests | |||
| Pre‐pandemic: free day – workday | t(345.0) = 23.96 | <0.001 | 58.84 (54.01, 63.67) |
| First wave: free day – workday | t(345.0) = 18.69 | <0.001 | 39.54 (35.38, 43.70) |
| Workday: first wave – pre‐pandemic | t(345.0) = 13.08 | <0.001 | 28.66 (24.35, 32.97) |
Effect sizes and confidence intervals (CIs) are in minutes and reflect differences in the trimmed means of the conditions being compared.
Differences expressed in minutes with 95% CIs in brackets. Significant values bolded for emphasis. Pandemic effects refer to comparisons between pre‐pandemic to the first wave of the COVID‐19 pandemic. Day effects refer to comparisons between weekdays and free days.
3.1.1. Sleep timing
As predicted, participants reported significant delays in sleep‐onset and sleep‐end times, as well as increased sleep duration, during the first wave of the pandemic compared to pre‐pandemic (Table 2). Sleep‐onset was delayed by 20.8 min and sleep‐end time by 19.6 min. Sleep duration increased by a small, but statistically significant, 4.9 min.
3.1.2. Social jetlag (SJL)
The difference between sleep‐midpoint during workdays and free days (i.e. SJL) decreased by 19.3 min during the pandemic first wave compared to pre‐pandemic (Table 2 and Figure 1a).
FIGURE 1.
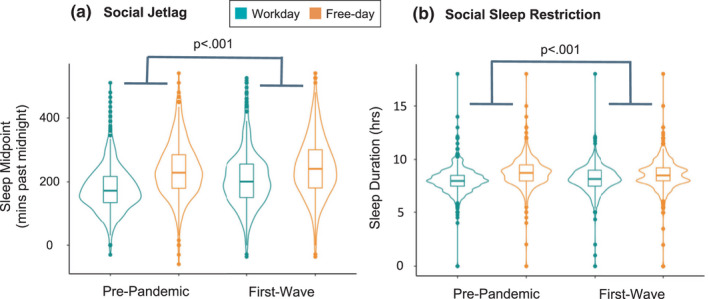
Discrepancy between workday and free‐day sleep timing and duration prior to and during the first wave of the COVID‐19 pandemic. (a) Social jetlag decreased by 19.3 min pre‐pandemic to the first wave of the pandemic, evidenced by a significant Pandemic phase × Day interaction. (b) Social sleep restriction decreased by 21.5 min pre‐pandemic to the first wave of the pandemic, evidenced by a significant Pandemic phase × Day interaction. Note that outliers are included in figures a and b as points above and below the distributions l]
3.1.3. Social sleep restriction (SSR)
The SSR decreased by 21.5 min during the pandemic first wave compared to pre‐pandemic (Table 2 and Figure 1b).
3.2. Exploratory analyses
3.2.1. Age
Age was positively associated with ΔSJL (τ = 0.14, p < 0.001, 95% CI 0.09–0.19) and ΔSSR (τ = 0.13, p < 0.001, 95% CI 0.08–0.18), suggesting pandemic‐related decreases were greatest for younger adults.
3.2.2. Chronotype
Chronotype, determined by rMEQ (lower score equates to a more evening chronotype), was positively associated with ΔSJL (τ = 0.09, p = 0.011, 95% CI 0.02–0.15) and ΔSSR (τ = 0.12, p = 0.001, 95% CI 0.05–0.18), suggesting pandemic‐related decreases were greatest for those with evening chronotypes.
3.2.3. Age and chronotype regression
Age remained positively associated with ΔSJL (τ = 0.36, SE = 0.10, 95% CI 0.15–0.54, p < 0.001; Figure 2a) and ΔSSR (τ = 0.56, SE = 0.18, 95% CI 0.17–0.85, p < 0.001; Figure 2b) in a regression model including rMEQ scores. The rMEQ remained positively associated with ΔSSR (τ = 1.06, SE = 0.57, 95% CI 0.03–2.30, p =.027; Figure 2d), but not ΔSJL (τ = 0.36, SE = 0.33, 95% CI −0.20 to 1.16, p = 0.20; Figure 2c) in regression models including age.
FIGURE 2.
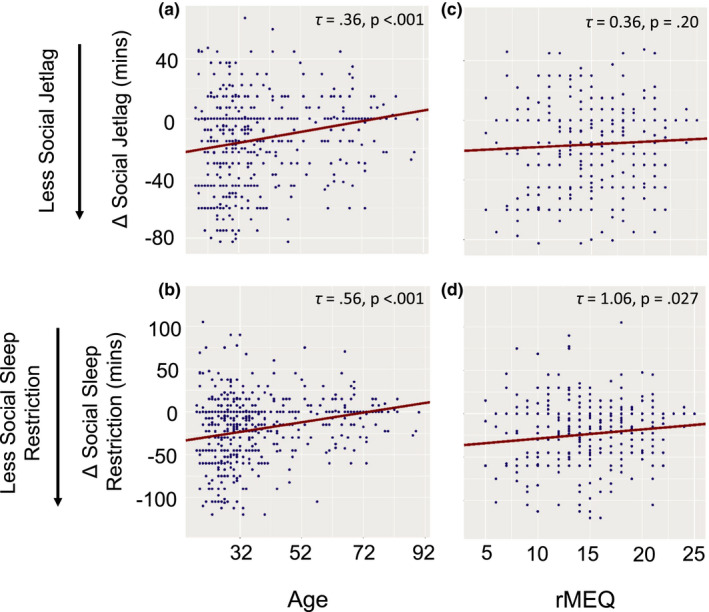
Age and chronotype regression results. (a–d) show the results of the Theil–Sen multiple regression analyses (see Appendix S1 for details). The relationship between each predictor is shown while controlling for the other predictor (held constant at its median). Social jetlag is defined as (free‐day sleep midpoint) – (workday sleep midpoint) and social sleep restriction is defined as (free‐day sleep duration) – (workday sleep duration). The change in these measures (Δ = first wave – pre‐pandemic) are shown in minutes on the y‐axis. Outliers in these sleep measures, defined as values more than three median absolute deviations (scaled to estimate the standard deviation under normality) from the median, are excluded from these plots for easier visualisation. Although the predictors were centred at their median for the regression analysis, they have been re‐scaled to their original units for the x‐axis shown here [Ct wileyonlinelibrary.com]
4. DISCUSSION
In the present sample of USA participants, we replicated recent findings of sleep phase delays (i.e. later bed and sleep‐end times; e.g. Cellini et al., 2020; Leone et al., 2020; Pépin et al., 2021; Wright et al., 2020) and decreased SJL (e.g. Blume et al., 2020; Korman et al., 2020; Leone et al., 2020; Wright et al., 2020) and SSR (e.g. Blume et al., 2020; Korman et al., 2020) during the first wave of the COVID‐19 pandemic compared to pre‐pandemic. Importantly, we expand on prior work by showing that decreased SJL and SSR varied with participants’ age and self‐reported chronotype. Young adults reported the largest reductions in SJL from pre‐pandemic to the first wave of the pandemic. Further, young adults and individuals with a late chronotype reported the largest reductions in SSR.
Factors contributing to sleep phase delays may have included reduced exposure to circadian zeitgebers such as daytime light exposure (Blume et al., 2020), regular meal timing, and physical activity (Pépin et al., 2020). Increased light exposure or stress in the evening may have impacted bedtimes, while increased morning scheduling flexibility may have provided the opportunity to “sleep‐in”, delaying rise‐times.
Under typical, pre‐pandemic conditions, weekend sleep scheduling varies to accommodate weekend social commitments and to catch‐up on sleep lost during a typical work week (Depner et al., 2019). In contrast, pandemic‐related restrictions likely reduced variability between workday and free‐day sleep timing by reducing late night social activities and allowing for greater sleep scheduling flexibility. We theorise that our present findings may reflect a “correction” of social–biological sleep timing desynchrony, facilitated by these social restrictions. Interestingly, a recent report found that objective measures of sleep depth decreased following pandemic‐related lockdowns (Pépin et al., 2021). This aligns with our previously reported hypothesis that individuals may have engaged in naturalistic “sleep extension” during the early part of the lockdown, attenuating sleep debt and, consequently, sleep depth (for further discussion, see Bottary et al., 2020). Yet, this hypothesis requires further investigation as proxies of rebound sleep, such as increased slow wave activity, were not reported by Pépin et al., 2021. While this question may remain unspecified in the context of the current pandemic, future work may address whether easing strict scheduling requirements in workplace and school settings moving forward improves sleep timing and consistency for those most affected by pre‐pandemic scheduling demands.
4.1. Limitations
Our present sample was a convenience sample of primarily well‐educated, White, non‐Hispanic, cis‐gender, female participants and over half (52%) of our participants reported living in the Northeastern region of the USA. We did not collect information about daily activities or work‐hour flexibility and recognise this may have been a factor determining pandemic‐related sleep schedule changes. Lastly, sleep timing was reported retrospectively, unconfirmed by objective sleep recordings, and thus likely subject to some level of recall bias (Gao & Scullin, 2020). However, a recent study that used objective sleep monitoring similarly reported sleep phase delays and reductions in weekday–weekend sleep timing changes during pandemic‐related lockdowns (Pépin et al., 2021).
CONFLICT OF INTEREST
The authors declare no competing financial interests.
AUTHOR CONTRIBUTIONS
Conceptualisation: RB, EAK and TJC; Data collection: TJC; Statistical analysis plan: RB, ECF and TJC; Statistical analysis: ECF; Writing – original draft: RB and ECF; Writing – review and editing: RB, ECF, EAK and TJC.
Supporting information
App S1
ACKNOWLEDGEMENTS
RB, ECF, and TJC would like to thank their National Institutes of Health (NIH) T32 funding sources for supporting their work and ongoing training. RB and TJC are currently funded by the Research Training Program in Sleep, Circadian and Respiratory Neurobiology (NIH T32 HL007901) through the Division of Sleep Medicine at Harvard Medical School and Brigham and Women’s Hospital. ECF is currently funded by NIH NRSA T32 NS007292 through Brandeis University. Additional funding for the project was provided by Boston College. We especially thank our dedicated participants during these unprecedented times and frontline workers who have worked tirelessly and selflessly to keep us safe and healthy.
Bottary, R. , Fields, E. C. , Kensinger, E. A. , & Cunningham, T. J. (2022). Age and chronotype influenced sleep timing changes during the first wave of the COVID‐19 pandemic. Journal of Sleep Research, 31, e13495. 10.1111/jsr.13495
DATA AVAILABILITY STATEMENT
The data that support the findings of this study are openly available on Open Science Framework: https://osf.io/gpxwa/
REFERENCES
- Blume, C. , Schmidt, M. H. , & Cajochen, C. (2020). Effects of the COVID‐19 lockdown on human sleep and rest‐activity rhythms. Current Biology: CB, 30(14), R795–R797. 10.1016/j.cub.2020.06.021 [DOI] [PMC free article] [PubMed] [Google Scholar]
- Bottary, R. , Simonelli, G. , Cunningham, T. J. , Kensinger, E. A. , & Mantua, J. (2020). Sleep extension: An explanation for increased pandemic dream recall? Sleep, 43(11), 10.1093/sleep/zsaa131 [DOI] [PubMed] [Google Scholar]
- Cellini, N. , Canale, N. , Mioni, G. , & Costa, S. (2020). Changes in sleep pattern, sense of time and digital media use during COVID‐19 lockdown in Italy. Journal of Sleep Research, 29(4), e13074. 10.1111/jsr.13074 [DOI] [PMC free article] [PubMed] [Google Scholar]
- Cunningham, T. J. , Fields, E. C. , & Kensinger, E. A. (2021). Boston College daily sleep and well‐being survey data during early phase of the COVID‐19 pandemic. Scientific Data, 8(1), 110. 10.1038/s41597-021-00886-y [DOI] [PMC free article] [PubMed] [Google Scholar]
- Danielsson, K. , Sakarya, A. , & Jansson‐Fröjmark, M. (2019). The reduced Morningness‐Eveningness Questionnaire: Psychometric properties and related factors in a young Swedish population. Chronobiology International, 36(4), 530–540. 10.1080/07420528.2018.1564322 [DOI] [PubMed] [Google Scholar]
- Depner, C. M. , Melanson, E. L. , Eckel, R. H. , Snell‐Bergeon, J. K. , Perreault, L. , Bergman, B. C. , … Wright, K. P. (2019). Ad libitum weekend recovery sleep fails to prevent metabolic dysregulation during a repeating pattern of insufficient sleep and weekend recovery sleep. Current Biology, 29(6), 957–967.e4. 10.1016/j.cub.2019.01.069 [DOI] [PubMed] [Google Scholar]
- Gao, C. , & Scullin, M. K. (2020). Sleep health early in the coronavirus disease 2019 (COVID‐19) outbreak in the United States: Integrating longitudinal, cross‐sectional, and retrospective recall data. Sleep Medicine, 73, 1–10. 10.1016/j.sleep.2020.06.032 [DOI] [PMC free article] [PubMed] [Google Scholar]
- Ghotbi, N. , Pilz, L. K. , Winnebeck, E. C. , Vetter, C. , Zerbini, G. , Lenssen, D. , … Roenneberg, T. (2020). The µMCTQ: An ultra‐short version of the Munich ChronoType questionnaire. Journal of Biological Rhythms, 35(1), 98–110. 10.1177/0748730419886986 [DOI] [PubMed] [Google Scholar]
- Korman, M. , Tkachev, V. , Reis, C. , Komada, Y. , Kitamura, S. , Gubin, D. , … Roenneberg, T. (2020). COVID‐19‐mandated social restrictions unveil the impact of social time pressure on sleep and body clock. Scientific Reports, 10(1), 22225. 10.1038/s41598-020-79299-7 [DOI] [PMC free article] [PubMed] [Google Scholar]
- Leone, M. J. , Sigman, M. , & Golombek, D. A. (2020). Effects of lockdown on human sleep and chronotype during the COVID‐19 pandemic. Current Biology, 30(16), R930–R931. 10.1016/j.cub.2020.07.015 [DOI] [PMC free article] [PubMed] [Google Scholar]
- Levandovski, R. , Dantas, G. , Fernandes, L. C. , Caumo, W. , Torres, I. , Roenneberg, T. , … Allebrandt, K. V. (2011). Depression scores associate with chronotype and social jetlag in a rural population. Chronobiology International, 28(9), 771–778. 10.3109/07420528.2011.602445 [DOI] [PubMed] [Google Scholar]
- Pépin, J.‐L. , Bailly, S. , Mordret, E. , Gaucher, J. , Tamisier, R. , Ben Messaoud, R. , … Mignot, E. (2021). Greatest changes in objective sleep architecture during COVID‐19 lockdown in night owls with increased REM sleep. Sleep, 44, zsab075. 10.1093/sleep/zsab075 [DOI] [PMC free article] [PubMed] [Google Scholar]
- Pépin, J. L. , Bruno, R. M. , Yang, R.‐Y. , Vercamer, V. , Jouhaud, P. , Escourrou, P. , & Boutouyrie, P. (2020). Wearable activity trackers for monitoring adherence to home confinement during the COVID‐19 pandemic worldwide: Data aggregation and analysis. Journal of Medical Internet Research, 22(6), e19787. 10.2196/19787 [DOI] [PMC free article] [PubMed] [Google Scholar]
- Roenneberg, T. , Kuehnle, T. , Pramstaller, P. P. , Ricken, J. , Havel, M. , Guth, A. , & Merrow, M. (2004). A marker for the end of adolescence. Current Biology, 14(24), R1038–R1039. 10.1016/j.cub.2004.11.039 [DOI] [PubMed] [Google Scholar]
- Wittmann, M. , Dinich, J. , Merrow, M. , & Roenneberg, T. (2006). Social jetlag: Misalignment of biological and social time. Chronobiology International, 23(1–2), 497–509. 10.1080/07420520500545979 [DOI] [PubMed] [Google Scholar]
- Wright, K. P. , Linton, S. K. , Withrow, D. , Casiraghi, L. , Lanza, S. M. , de la Iglesia, H. , … Depner, C. M. (2020). Sleep in university students prior to and during COVID‐19 Stay‐at‐Home orders. Current Biology: CB, 30(14), R797–R798. 10.1016/j.cub.2020.06.022 [DOI] [PMC free article] [PubMed] [Google Scholar]
- Zhang, Z. , Cajochen, C. , & Khatami, R. (2019). Social jetlag and chronotypes in the Chinese population: Analysis of data recorded by wearable devices. Journal of Medical Internet Research, 21(6), e13482. 10.2196/13482 [DOI] [PMC free article] [PubMed] [Google Scholar]
Associated Data
This section collects any data citations, data availability statements, or supplementary materials included in this article.
Supplementary Materials
App S1
Data Availability Statement
The data that support the findings of this study are openly available on Open Science Framework: https://osf.io/gpxwa/