Abstract
Since 11 March 2020 when officially declared a global pandemic, Covid‐19 (or SARS‐COV2) has turned out to be a multifaceted disease differently affecting countries and individuals. What makes certain countries more vulnerable than others has attracted the interest of scientists from various disciplines. This paper intends to compare the impact of demographic parameters, population health conditions and policy actions on prevalence and fatality levels of Covid‐19 during the first 3 months since its declaration of global pandemic. A country‐level exploratory analysis has been conducted in order to assess how demography, national health conditions and measures taken interact and condition the disease outcomes. Analysis relies on publicly available data on Covid‐19 reported cases, deaths and number of persons tested. Those data are combined with demographic parameters (sex ratio, mean age, population density and life expectancy), health data (cardiovascular death rate, diabetes prevalence, share of smokers among males and females and number of hospital beds) and information about relative national policies aiming the management of the pandemic (lockdown timing and duration). Our analysis confirms the diversity of factors and the complexity of their interaction in explaining the propagation and fatality of the disease across Europe. Our findings question some well‐established attitudes concerning the role of demographic variables and public health conditions in the spread of the disease.
Keywords: age, cardiovascular death rate, Covid‐19, demography, Europe, pandemic, policy measures, sex ratio
1. INTRODUCTION
First Covid‐19 cases detected on European soil were reported in France as early as 24 January 2020. First reported death was in France, again, on 5 February. On 21 February, only 47 cases were registered in nine European countries; most of them were either linked to two clusters, in Bavaria (Germany) and Haute‐Savoie (France), or related to a trip from China (Spiteri et al., 2020). The situation rapidly deteriorated, in early March, especially after an outbreak in Northern Italy. On 11 March, the WHO declared a global pandemic, and ever since, a daily update of Covid‐19 new confirmed cases and deaths runs the headlines all over the world. During the next 3 months, the spread and the fatality of the new virus took most countries by surprise. The situation relaxed sometime by the end of June when as said by epidemiologists (i.e., Kontis et al., 2020) the ‘first wave’ of the pandemic came to an end. A couple of months later, the number of registered cases and deaths surged again: The very‐much feared second wave was flooding the continent.
Besides being highly contagious, Covid‐19 has raised major concerns for its decidedly unpredictable nature. Certain populations seem more vulnerable against the new coronavirus whereas for some countries, the death toll has been disproportionally high. The rapidly increasing literature covering different scientific fields—ranging from medicine and biology to economy and sociology as well as from public health to demography—is anything but surprising. It displays the necessity of interdisciplinary approaches should the nature and the mechanisms of this virus are to be fully understood and its severe social and economic implications are to be efficiently addressed.
Uncertainties remain around the epidemiological and clinical characteristics as well as about the determinant factors behind critical cases. However, one persistent pattern has emerged. Data from different countries suggest that, although the probability to be infected does not vary with age or sex, fatality rates are significantly higher among men and persons above 65 years of age (Sobotka et al., 2020). While the gender imbalance remains largely unexplained, the vulnerability of elder is somehow related to chronic health conditions, another aggravating factor at individual level (Romero Starke et al., 2020). Cardiovascular diseases, asthma and diabetes have been put forward to defend the ‘underlying diseases’ argument. Moreover, personal lifestyle choices, mainly obesity and smoking, are also associated with the disease outcome. Different studies point obesity as a culprit in Covid‐19 deaths, mainly among males below 60 years of age (Dietz & Santos‐Burgoa, 2020; Tartof et al., 2020). On the other hand, research about smoking as an independent risk factor remains inconclusive. Some first findings report a significant inverse relationship between current smoking and Covid‐19 mortality rates whereas others suggest a non‐significant positive association (WHO, 2020). The reasons why some patients sail through the disease whereas for others implications are overwhelming and lead to death are still to be identified.
However determinant those parameters may be at individual level, they do not necessarily suffice to justify significant differences across countries. The aim of this work is to explore plausible explanatory factors behind different pandemic outcomes across European countries. This study intends to provide a complementary analysis by analysing the role of demographic parameters, national health conditions and policy actions on risk for death due to the novel coronavirus.
The rest of this paper is structured as follows: Section 2 describes the data and methods applied in our analysis, Section 3 presents and discusses the results and Section 4 summarises the most important findings.
2. DATA AND METHODS
Analysis relies on country‐specific epidemiological results referring to the first 100 days of the pandemic. At a first level, analysis covers 41 European countries with more than 150,000 inhabitants whereas at a second stage, the discussion is narrowed down to the 15 worst affected countries. This work combines data from different databases. Official country‐level Covid‐19 data (namely, confirmed cases, reported deaths and number of persons tested) are retrieved from national government reports and databases; their values refer to 20 June 2020. This date, 100 days away from the pandemic declaration, has an additional significance as the end of the so‐called first wave of the pandemic in Europe. Thereafter, but only for a couple of months, most European countries managed to retain new virus‐related death rates at low levels. We opt to focus on the first wave, a period when very little was known about the pandemic and how to deal with it, so as to better identify the role of the demographic parameters, social conditions and the readiness of policy on the spread of Covid‐19. This choice is further justified by the fact that the countries were unprepared and variants of the Covid‐19 virus had not emerged by the time.
Demographic data comprise population size and density, sex ratio, median age and share of above 70 years of age in total population, as provided by the Eurostat (2020). Health statistics including cardiovascular death rate and diabetes prevalence refer to the year 2017 and are supplied by the World Bank. Data about policy actions, such as date of strict lockdown and its duration (in days), have been compiled by official governmental reports. Official data about regional and national mortality trends during the 22 first weeks of 2020 have also been used to produce the map (Illustration 1). The later data refer to only 15 countries that were found to be the most affected by the pandemic at the end of the first wave.
ILLUSTRATION 1.
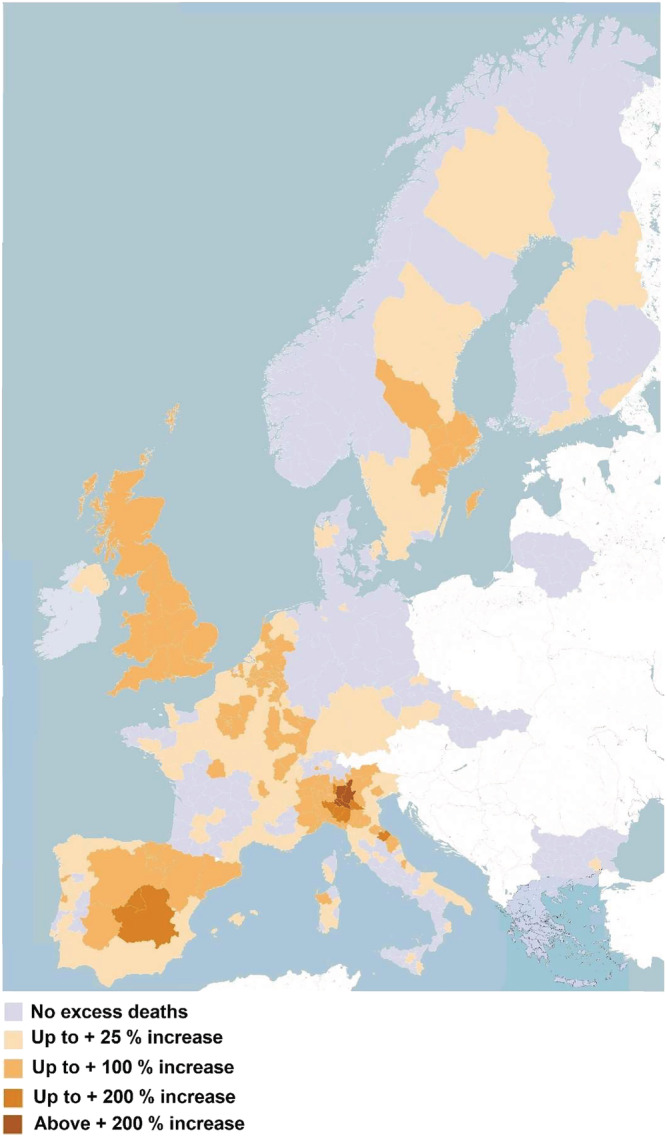
Excess mortality during the first wave of the SARS‐COV (compared with 2019) in provinces, departments and districts of various countries in Europe. Sources: EUROSTAT, and compilations by European Data Journalism (https://www.europeandatajournalism.eu), CSO (Ireland, Central statistics office), EODY (Greece, Εθνικός Οργανισμός Δημόσιας Υγείας)
Our analysis comprises a number of indexes that measure the intensity of the pandemic outbreak in each country. Crude fatality rates (CFRs) reported cases and deaths per million inhabitants, as well as number tests per 1000 persons. CFR is defined as the number of reported Covid‐19 deaths over the number of confirmed cases. As the number of reported cases is strictly related to the number of persons tested, which largely varies across countries, both CFR and number of cases per million inhabitants are not suitable for comparisons across regions or over time. The number of deaths per million inhabitants is considered to be more objective an indicator. Thus, in order to identify the countries the most affected, we used as benchmark 100 deaths per million inhabitants. Mortality rates at such levels suggest that the virus was widely spread across almost all the regions or where at least a majority of the inhabitants of the hardest hit countries are living. Official data enable a map with representation of the excess of mortality in NUTS III level (provinces in Italy, departments in France, etc.). As of 20 June, 15 countries were found above that threshold (100 deaths per million inhabitants) and were, thus, included in the second part of this analysis.
Exploratory analysis on the relative impact of demographic parameters, national health conditions and governments measures on Covid‐19 comprises descriptive statistics and correlations and is completed with a cluster analysis which aims to identify national similarities. Hierarchical ascendant classifications (HACs) are appropriate methods to identify proximities across countries when different parameters—relevant to the dynamics of the pandemic—are taken into consideration.
3. RESULTS
3.1. The Covid‐19 pandemic in Europe and its spatial disparities
On 20 June, 100 days since the pandemic declaration, a total number of 2,237,200 confirmed cases and 186,761 deaths had been registered in Europe. For the continent as a whole, the fatality of the pandemic is high: The CFR goes up to 8.3%, and there are 250 deaths per million inhabitants. Significant variations across countries are covered beneath those aggregate numbers. The number of deaths per million inhabitants varies from as low as 5 in Slovakia to as high as 840 deaths per million persons in Belgium; the CFR goes from 0.5% in Iceland and Belarus to 18.6% in France (Figure 1).
Figure 1.
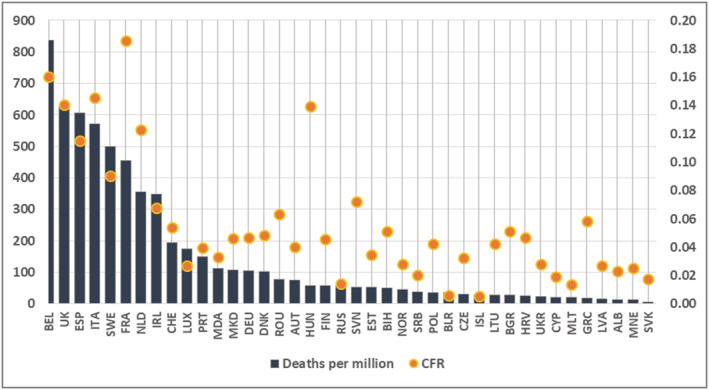
Covid‐19 fatality indexes in European countries, as of 20/06/2020. Note: Left axis refers to the number of deaths per million inhabitants (in columns); right axis refers to the Crude Fatality Rate (in dots) defined as the number of deaths over the number of confirmed cases
Differences in population age composition only partly explain the spread and the fatality of the disease across European countries (Dowd et al., 2020). At the beginning of the pandemic, it has been repeatedly mentioned that older persons and males are disproportionally affected by the new virus (Dudley & Lee, 2020; Sasson, 2020; Verity et al., 2020). The age structure argument has been put forward to explain the huge outbreak in Italy, the first European country to be harshly hit by the pandemic (Omori et al., 2020).
As shown on Figure 2, the share of above 70 years of age in a population does not explain the distinction between more and less harshly hit European countries. Among the countries the most affected, the share of elder in the total population ranges from as low as 8% (in N. Macedonia and Ireland) to above 17% (in Italy). Things get slightly more straightforward when it comes to the gender composition. The countries more affected by the pandemic have a sex ratio close or above to 100, indicating a relatively higher share of males. France is one of the two countries with a high level of Covid‐19 mortality in spite of medium sex ratio. The high level of mortality in nursing houses where 73% of residents are women explains this specific position (Tragaki & Richard, 2020).
Figure 2.
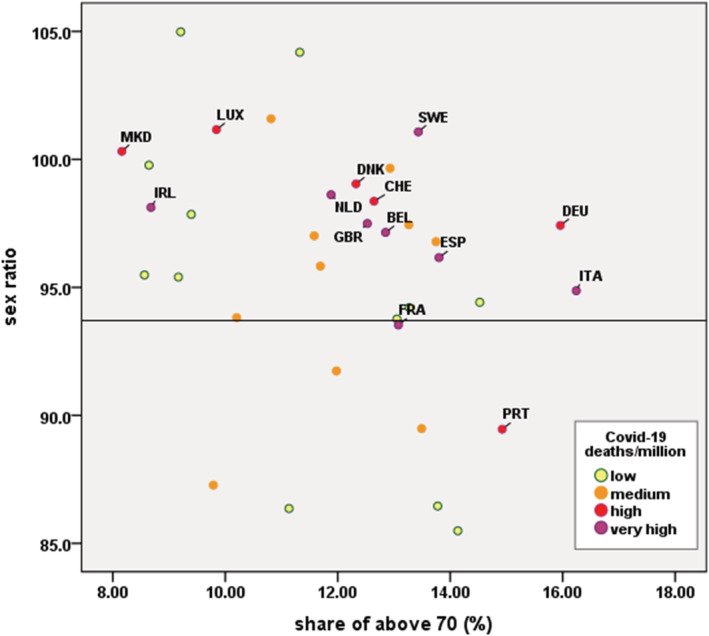
Correlation between demographic parameters (sex ratio and share of above 70 years of age) and Covid‐19 mortality rates (per 1M of population). Note: Vertical axis refers to the number of men for every 100 women; horizontal axis refers to the share of above 70 in total population. Each dot refers to a country; the colour of each dot illustrates how high the number of Covid‐19 deaths/million persons is. In bold the 15 hardest hit European countries (as mentioned in our analysis)
Against common wisdom, high living standards do not provide a national shield against Covid‐19. Figure 3 clearly illustrates this finding, as 13 out of 15 most affected European countries enjoy high per capita GDP along with high life expectancy at birth, two crucial indicators in Human Development Index. More precisely, eight out of 15 most affected by the pandemic countries are found among the 25% of countries with the higher GDP (in ppp) whereas only four out of 15 countries are not included in the top 25% of European countries with the highest life expectancy at birth.
Figure 3.
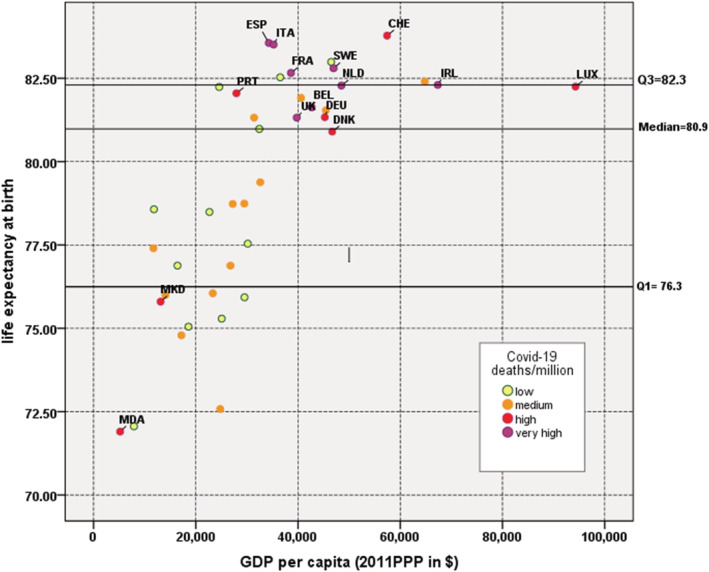
Correlation between living standards (GDP per capita & life expectancy at birth) and Covid‐19 mortality rates (per 1M of population). Note: Vertical axis refers to life expectancy at birth (both sexes); horizontal axis refers to the per capita GDP at purchasing power parity (in constant 2011$). Each dot refers to a country; the colour of each dot illustrates how high the number of Covid‐19 deaths/million persons is. In bold the 15 hardest hit European countries (as mentioned in our analysis)
People with underlying medical conditions are identified to be at an increased risk for severe illness or death from Covid‐19. Relevant literature suggests that cardiovascular diseases and diabetes are among the aggravating comorbidities (Nishiga et al., 2020; Ren et al., 2020; Sabatino et al., 2020). However, this positive association valid at individual level is not confirmed at an aggregate level. Our data suggest a strong statistically significant inverse relationship between Covid‐19 and national CVD death rates. More precisely, for an additional 1000 CVD deaths, the expected decrease in the number of Covid‐19 per million inhabitants ranges from 44 to 141 (95% confidence level). An inverse, though not statistically significant, correlation (b = −0.293, n = 41, t STAT = −1.987 < 2.0227) between Covid‐19 death rates and diabetes prevalence across European countries has been observed (Figure 4). Those really interesting findings are counter‐intuitional as longevity is correlated to increased cardiovascular disease rates and CVD deaths are the first cause of death among elder persons (Kollia et al., 2018; Tragaki & Panagiotakos, 2018). Such findings are presented for the first time in relevant literature. The investigation of lifestyle indicators or other characteristics that may act as potential confounding factors are clearly beyond the scope of this work. We only present this finding to underline the amazingly unconditional way Covid‐19 death rates varied across Europe, at least during the first wave of the pandemic.
Figure 4.
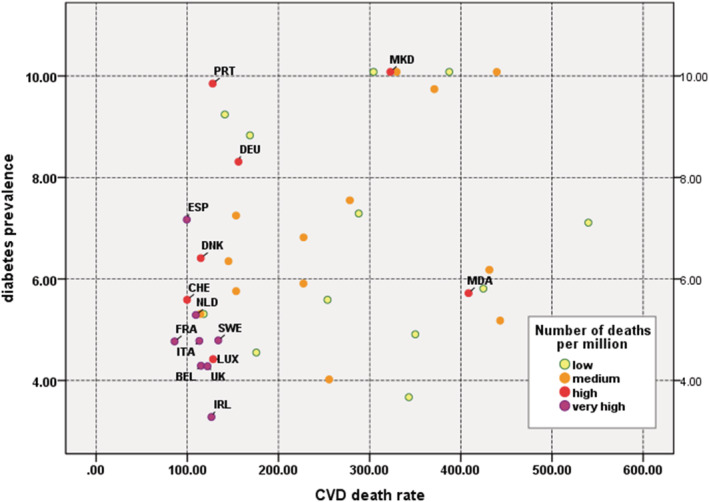
Correlation between underlying health issues (diabetes prevalence and cardiovascular death rate) and Covid‐19 mortality rates (per 1M of population). Note: Vertical axis refers to diabetes prevalence (as share) across population aged from 20 to 79 (in 2017); horizontal axis refers to cardiovascular death rate (in 2017). Each dot refers to a country; the colour of each dot illustrates how high the number of Covid‐19 deaths/million persons is. In bold the 15 hardest hit European countries (as mentioned in our analysis)
Policy actions against the spread of the pandemic comprise wide‐range measures varying from efficient testing strategies to lockdown decisions. Our analysis focuses on the first 100 days of the pandemic, a period where tests were mainly performed on persons with symptoms or at high risk. The frequency of testing significantly varied across countries making case‐based comparison rather precarious. According to available data by 20 June, the number of tests performed goes from 14.63 tests for thousand persons in North Macedonia to 230 tests in Luxembourg. By the time, information about national testing strategies is rather limited. For example, on 14 May, Germany extended testing to asymptomatic people who have been in contact with COVID‐19 patients (especially nursing homes workers and health professionals). Obviously testing frequency affects the number of confirmed cases and thus the CFR indicator. The lower the number of cases registered, the higher the CFR level. That is partly why CFR is particularly high in France and Italy (Yuan et al., 2020). This is confirmed by a cluster analysis performed among 15 countries (the hardest hit ones in Europe during the first wave during the first half of the year 2020) using as variables the total number of deaths per million persons, the number of tests per thousand persons and the CFR.
3.2. The 15 worst affected countries: What are the reasons behind?
In the rest of this paper, analysis is focused on those countries where the number of Covid‐19 deaths exceeded the benchmark of 100 per million inhabitants on 20 June 2020, a condition met by 15 countries of all population sizes, geographically scattered all over the continent (Table 1).
Table 1.
Lockdown details for the 15 selected countries
| Lockdown dates | Cases/100,000 inhabitants at the lockdown date | Deaths/1,000,000 inhabitants at the lockdown dates | |||
|---|---|---|---|---|---|
| Starting date | Days since the first lockdown imposed in Europe a | Duration (days) | |||
| Belgium | 20 March | 10 | 53 | 19.47 | 3.19 |
| United Kingdom | 24 March | 14 | 49 | 11.90 | 6.21 |
| Spain | 14 March | 4 | 66 | 20.79 | 6.24 |
| Italy | 10 March | 0 | 56 | 16.79 | 10.44 |
| Sweden | No strict lockdown | 20 | 21 | 17.76 | 10.89 |
| France | 17 March | 7 | 56 | 11.84 | 2.68 |
| Netherlands | 1 April | 22 | 41 | 79.45 | 6.85 |
| Ireland | 27 March | 17 | 51 | 41.01 | 4.46 |
| Switzerland |
No strict lockdown restrictions 20 March |
10 | 38 | 81.14 | 9.10 |
| Luxembourg | 15 March | 5 | 49 | 12.30 | 1.60 |
| Portugal | 18 March | 8 | 45 | 6.30 | 0.20 |
| Moldova |
Restrictions 17 March |
7 | 56 | 0.75 | 0 |
| N. Macedonia | 12 April | 33 | 36 | 39.74 | 16.32 |
| Germany | 22 March | 12 | 27 | 22.21 | 0.66 |
| Denmark | 11 March | 1 | 35 | 8.91 | 0 |
Note: Sweden and Switzerland did not opt for a strict lockdown. Information provided for those two countries concern the date of strictest measure imposed.
Italy was the first European country to impose a total lockdown on 10 March. Figures on relative column give the number of days that elapsed between that date and the date of national lockdown—or the strictest measure imposed.
A main divide emerges between the top eight countries that register high numbers of Covid‐19 deaths and high fatality rates and the other seven countries with relatively low mortality and fatality rates. It is interesting to notice that most of the countries with high CFR had a rather poor performance in the number of tests conducted—this is the case for Belgium, the United Kingdom, Spain, Italy and France. Testing is a key metric in both measuring and tackling with the pandemic. A timely and widespread testing strategy provides a tool for early reaction against the diffusion of the virus. Statistically speaking, testing increases the number of confirmed cases and lowers the CFR level—this is the case of Luxembourg and Sweden. However, different governmental decisions about the date and duration of lockdown conditioned the levels of death rate (Table 1).
HAC is a useful tool to identify differences and similarities across countries in respect to a number of parameters that can be linked with the dynamic of the pandemic. The first HAC we run takes into consideration four demographic variables: population density, sex ratio, the proportion of citizens above 70 years old and life expectancy at birth (Figure 5). All those variables have been considered relevant either to the diffusion (population density) or the fatality of the disease (higher vulnerability among men and elders). Clustering analysis results in two main groups of countries. The first one comprises countries where all risk factors are high: Luxembourg, Germany, Italy, Switzerland and the United Kingdom register high population density, high or very high shares of above 70 years of age and high sex ratios. Countries grouped in the second cluster (IRL, MKD, MDA, ESP, FRA, PRT and DNK) have low population density and relatively low sex ratio whereas some of them have relatively young age structure. Sweden registers the lowest population density; Belgium and Netherlands are outliers due to their highest population density. Obviously, this divide cannot justify the pandemic dynamics shown on Figure 6. Demographic variables though important are not decisive in conditioning the diffusion and severity of the disease. In fact, density often appears as more pertinent if densities are examined at regional rather than national level.
Figure 5.
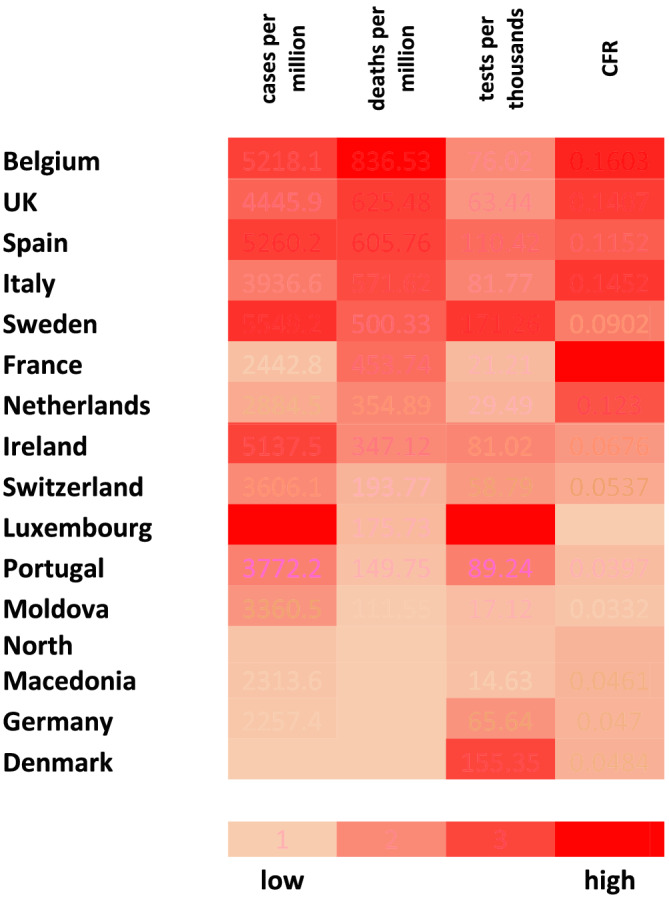
Dendrogram of a hierarchical ascendant classification of 15 hardest hit European countries in respect to their demographic variables. Note: Countries have been classified in respect to the following variables: population density, sex ratio, share of above the age of 70 and life expectancy. Clustering method here used was the nearest neighbour combined with the squared Euclidean distance
Figure 6.
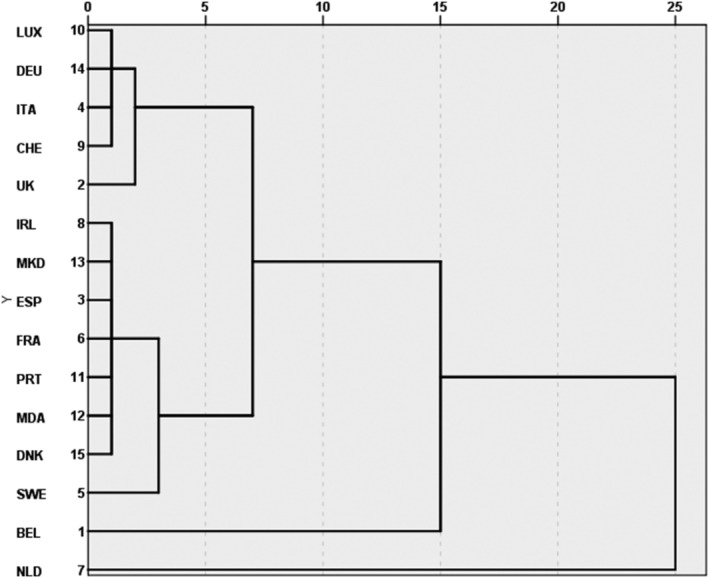
Key trends in 15 selected countries. Note: Countries are ranked in respect to the number of deaths per million inhabitants (in descendant order) as registered on 20 June 2020
When HAC is applied on the 15 hardest hit European countries taking into consideration the health conditions, grouping is different to the demographic one but still far from sufficiently explaining the pandemic dynamics. Countries varied substantially in terms of how their healthcare system provide life‐saving services: Several countries were less able to rapidly enhance capacity, partly related to uneven health and social care spending, responded less effectively to increased healthcare needs. These countries are characterised by low per capita spending in ICU beds (Kontis et al., 2020). In several countries, IC capacity in beds delayed admission of patients with COVID‐19 or even led to patients' triage. 1
As early evidence suggested that the main way the new virus spreads is either by respiratory droplets among people who are in close contact with each other or aerosol transmission that can occur in specific settings, restrictions were applied in most areas of everyday life. Sooner or later, all European countries implemented social distancing measures, strongly encouraged populations to follow the ‘stay at home’ calls and ultimately most of them enforced a total lockdown. Differences concerning the timing and duration of lockdown across countries depend on societal norms regarding accepted levels of risk (Glynn, 2020). Despite its very serious side effects (mostly economic and psychological), the effect of lockdown in containing the spread of the pandemic has been tested and found positive (Atalan, 2020; Kennelly et al., 2020). Clustering countries in respect to the date, precocity and duration of lockdown suggests different groups of countries, if compared with demographic and national health variables. It seems however that this grouping better explains the ranking of countries in Figure 1.
The last dendrogram (Figure 7) clusters the 15 worst affected countries in respect to the timeliness and strictness of measures against the new virus. Variables taken into account are the number of tests per thousand inhabitants, duration of lockdown, number of cases and deaths per inhabitants on the lockdown date. 2 Three largely discrete groups of countries emerge. The first one comprises countries (France, Netherlands, North Macedonia 3 and Moldova) with low testing performance (in average 20.6 tests per thousand persons) and relatively late lockdown decisions, when the average number of deaths and cases was already above 2 and 33 per million persons, respectively. Six countries (Italy, Ireland, Belgium, Portugal, Germany and the United Kingdom) are grouped together in an intermediate cluster for they share long lockdown durations and rather low frequency of tests (in average about 80 per thousand inhabitants); in those countries, measures were taken when earlier than in countries of the previous cluster but considerably later than in Denmark and Luxembourg. Those two countries in the bottom of the dendrogram opted for early and short lockdowns along with wide testing strategies.
Figure 7.
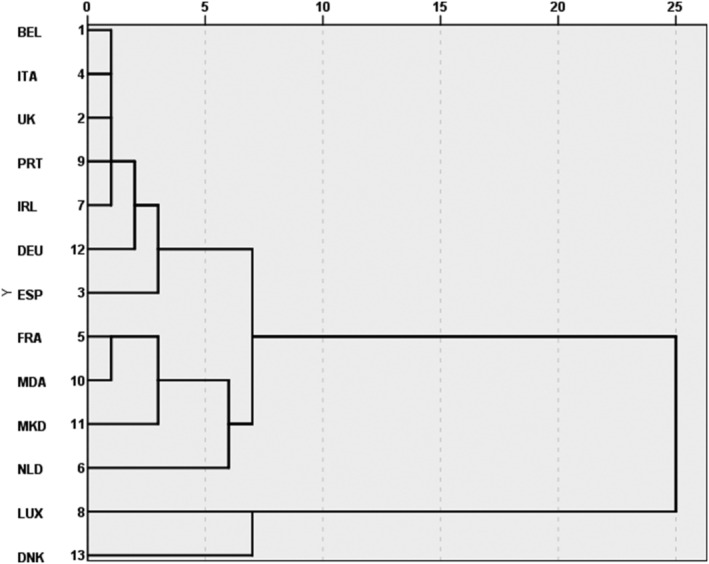
Dendrogram of a hierarchical ascendant classification of the hardest hit European countries who decided strict lockdowns in respect to measures taken to halt the pandemic. Note: Countries have been classified in respect to the following variables: number of tests per thousand inhabitants, duration of lockdown, numbers of cases and deaths (per standardised population, see Table 1) on the lockdown date. Clustering method here used was the average between groups linkage combined with the squared Euclidean distance. Sweden and Switzerland have been excluded from this clustering for they never proceeded with a total lockdown
Some interesting findings emerge when all three sets of variables are taken into consideration. Switzerland and Germany have similar demographic profiles and close health conditions; late implementation of strict measures in Switzerland may be the reason behind their important gap in performance against the pandemic. This is also the case for Sweden and Denmark: two countries close to each other when demographic and health variables are examined but with very different governmental decisions upon the management of the pandemic. Italy and the United Kingdom are consistently grouped together; so do North Macedonia and Moldova. Belgium top ranking in the pandemic list may be explained by late measures coupled high population density.
Seen through a different perspective and based on a different methodology, recent research efforts come up with similar findings arguing that countries that opted for rapid and strict elimination policies were the most efficient and managed to lessen the economic and social impact of the pandemic (Oliu‐Barton et al., 2021).
4. CONCLUSION
The pandemic outbreak took the whole Europe by surprise. Totally unprepared, European countries were called—almost simultaneously—to face an unprecedented situation and were urged to take timely and efficient decisions against a widely unknown and fast spreading disease. It has been a surprise, if not a puzzle, how differently the first wave of Covid‐19 pandemic has been experienced across Europe and how divergent outcomes have been produced by European countries with largely similar economies. This work tried to identify the role of demographic variables, national health care conditions and policy decisions in explaining those differences. It seems that there is not a ‘one‐size‐fits‐all’ approach. Demographic variables, mainly sex ratio and, to a lesser extent, population density, may partly explain the prevalence of the disease in specific countries; curiously enough, variables like share of elder in a population and median age did not have the expected explanatory value. The role of national health standards turned out to be more complicated than initially thought: No correlation has been identified between the number of hospital beds (per thousand persons) and the number of deaths. Even more surprisingly, most of the worst affected countries register low levels of cardiovascular death rates, a finding that goes against intuition.
The nature of policy measures imposed to contain the pandemic has also been examined, this time across the 15 worst affected countries. It seems that the timing the restrictions are introduced as well as the length of period measures remain effective may provide an additional explanatory factor. Though the rule is not general, the fewer the cases and deaths at the time of measures, the higher their efficiency, even among the 15 hardest hit countries.
There are some limitations in this study, as it is the case in every work on an unfolding issue. There are discrepancies in the way outcomes are measured across countries and conflicting statements about their measures, the duration and peoples' compliance to them. Moreover, confounding factors, others to those here studied, may turn out to be crucial in the study of the pandemic.
International comparisons are useful to make out decisive factors that may affect the outcome. Although nothing guarantees that the second wave experience will be the same, and similar measures will suffice, there are definitely things to be learnt from those countries that did not manage to efficiently address the disease.
Tragaki, A. , & Richard, J.‐L. (2022). First wave of SARS‐COV2 in Europe: Study and typology of the 15 worst affected European countries. Population, Space and Place, 28, e2534. 10.1002/psp.2534
ENDNOTES
Countries with low level of ICU beds have not necessarily been the most affected by the pandemic. It needs, however, to be reminded that here we focus on the 15 countries most hit by the pandemics.
Sweden and Switzerland have been excluded from this clustering for they never proceeded with a total lockdown.
The pandemic in North Macedonia followed a different timeline. Three months after the reference date (20 June), the number of deaths was three times higher (cumulated total of 233 deaths on 20 June and 721 deaths on 21 September).
DATA AVAILABILITY STATEMENT
Data used for figures are available upon request.
REFERENCES
- Atalan, A. (2020). Is the lockdown important to prevent the COVID‐9 pandemic? Effects on psychology, environment and economy‐perspective. Annals of Medicine and Surgery, 56, 38–42. 10.1016/j.amsu.2020.06.010 [DOI] [PMC free article] [PubMed] [Google Scholar]
- Dietz, W. , & Santos‐Burgoa, C. (2020). Obesity and its implications for COVID‐19 mortality. Obesity, 8(6), 1005. 10.1002/oby.22818 [DOI] [PubMed] [Google Scholar]
- Dowd, J. B. , Andriano, L. , Brazel, D. M. , Rotondi, V. , Block, P. , Ding, X. , Liu, Y. , & Mills, M. C. (2020). Demographic science aids in understanding the spread and fatality rates of COVID‐19. Proceedings of the National Academy of Sciences, 117, 9696–9698. 10.1073/pnas.2004911117 [DOI] [PMC free article] [PubMed] [Google Scholar]
- Dudley, J. P. , & Lee, N. T. (2020). Disparities in age‐specific morbidity and mortality from SARS‐CoV‐2 in China and the Republic of Korea. Clinical Infectious Diseases: An Official Publication of the Infectious Diseases Society of America, 71(15), 863–865. 10.1093/cid/ciaa354 [DOI] [PMC free article] [PubMed] [Google Scholar]
- Eurostat . (2020) Demography/population on 1 January by age and sex. https://ec.europa.eu/eurostat/databrowser/view/demo_pjan/default/table?lang=en Accessed 30 June 2020.
- Glynn, J. R. (2020). Protecting workers aged 60–69 years from COVID‐19. The Lancet Infectious Diseases, 20, 1123. 10.1016/S1473-3099(20)30311-X [DOI] [PMC free article] [PubMed] [Google Scholar]
- Kennelly, B. , O'Callaghan, M. , Coughlan, D. , Cullinan, J. , Doherty, E. , Glynn, L. , Moloney, E. , & Queally, M. (2020). The COVID‐19 pandemic in Ireland: An overview of the health service and economic policy response. Health Policy and Technology, 9(4), 419–429. 10.1016/j.hlpt.2020.08.021 [DOI] [PMC free article] [PubMed] [Google Scholar]
- Kollia, N. , Tragaki, A. , Syngelakis, A. I. , & Panagiotakos, D. (2018). Trends of cardiovascular disease mortality in relation to population aging, in Greece (1956‐2015). The Open Cardiovascular Medicine Journal, 12, 71–79. 10.2174/1874192401812010071 [DOI] [PMC free article] [PubMed] [Google Scholar]
- Kontis, V. , Bennett, J. E. , Rashid, T. , Parks, R. M. , Pearson‐Stuttard, J. , Guillot, M. , Asaria, P. , Zhou, B. , Battaglini, M. , Corsetti, G. , McKee, M. , di Cesare, M. , Mathers, C. D. , & Ezzati, M. (2020). Magnitude, demographics and dynamics of the effect of the first wave of the COVID‐19 pandemic on all‐cause mortality in 21 industrialized countries. Nature Medicine, 26, 1919–1928. 10.1038/s41591-020-1112-0 [DOI] [PMC free article] [PubMed] [Google Scholar]
- Nishiga, M. , Wang, D. W. , Han, Y. , Lewis, D. B. , & Wu, J. C. (2020). COVID‐19 and cardiovascular disease: From basic mechanisms to clinical perspectives. Nature Reviews. Cardiology, 17(9), 543–558. 10.1038/s41569-020-0413-9 [DOI] [PMC free article] [PubMed] [Google Scholar]
- Oliu‐Barton, M. , Pradelski, B. S. , Aghion, P. , Artus, P. , Kickbusch, I. , Lazarus, J. V. , Sridhar, D. & Vanderslott, S. (2021) “SARS‐CoV‐2 elimination, not mitigation, creates best outcomes for health, the economy, and civil liberties” The Lancet, 397(10291):2234–2236. ISSN: 0140‐6736. 10.1016/s0140-6736(21)00978-8 [DOI] [PMC free article] [PubMed] [Google Scholar]
- Omori, R. , Matsuyama, R. , & Nakata, Y. (2020). The age distribution of mortality from novel coronavirus disease (COVID‐19) suggests no large difference of susceptibility by age. Scientific Reports, 10, 16642. 10.1038/s41598-020-73777-8 [DOI] [PMC free article] [PubMed] [Google Scholar]
- Ren, H. , Yang, Y. , Wang, F. , Yan, Y. , Shi, X. , Dong, K. , Yu, X. , & Zhang, S. (2020). Association of the insulin resistance marker TyG index with the severity and mortality of COVID‐19. Cardiovascular Diabetology, 19, 58–58. 10.1186/s12933-020-01035-2 [DOI] [PMC free article] [PubMed] [Google Scholar]
- Romero Starke, K. , Petereit‐Haack, G. , Schubert, M. , Kämpf, D. , Schliebner, A. , Hegewald, J. , & Seidler, A. (2020). The age‐related risk of severe outcomes due to COVID‐19 infection: A rapid review, meta‐analysis, and meta‐regression. International Journal of Environmental Research and Public Health, 17(16), 5974. 10.3390/ijerph17165974 [DOI] [PMC free article] [PubMed] [Google Scholar]
- Sabatino, J. , De Rosa, S. , Di Salvo, G. , & Indolfi, C. (2020). Impact of cardiovascular risk profile on COVID‐19 outcome. A meta‐analysis. PLoS ONE, 15(8), e0237131. 10.1371/journal.pone.0237131 [DOI] [PMC free article] [PubMed] [Google Scholar]
- Sasson, I. (2020). Aging and COVID‐19 mortality: A demographic perspective. MedRxiv. 10.1101/2020.10.15.20213454 [DOI] [Google Scholar]
- Sobotka, T. , Brzozowska, Z. , Muttarak, R. , Zeman, K. , & di Lego, V. (2020). Age, gender and COVID‐19 infections. medRxiv. 10.1101/2020.05.24.20111765 [DOI] [Google Scholar]
- Spiteri, G. , Fielding, J. , Diercke, M. , Campese, C. , Enouf, V. , Gaymard, A. , Bella, A. , Sognamiglio, P. , Moros, M. J. S. , Riutort, A. N. , Demina, Y. V. , Mahieu, R. , Broas, M. , Bengnér, M. , Buda, S. , Schilling, J. , Filleul, L. , Lepoutre, A. , Saura, C. , … Ciancio, B. C. (2020). First cases of coronavirus disease 2019 (COVID‐19) in the WHO European Region. Eurosurveillance, 25(9), 2000178. 10.2807/1560-7917 [DOI] [PMC free article] [PubMed] [Google Scholar]
- Tartof, S. Y. , Qian, L. , Hong, V. , Wei, R. , Nadjafi, R. F. , Fischer, H. , Li, Z. , Shaw, S. F. , Caparosa, S. L. , Nau, C. L. , Saxena, T. , Rieg, G. K. , Ackerson, B. K. , Sharp, A. L. , Skarbinski, J. , Naik, T. K. , & Murali, S. B. (2020). Obesity and mortality among patients diagnosed with Covid‐19: Results from an integrated health care organization. Annals of Internal Medicine, 173, 773–781. 10.7326/M20-3742 [DOI] [PMC free article] [PubMed] [Google Scholar]
- Tragaki, A. , & Panagiotakos, D. (2018). Population ageing and cardiovascular health: The case of Greece. Hellenic Journal of Cardiology, 59, 360–361. 10.1016/j.hjc.2018.01.001 [DOI] [PubMed] [Google Scholar]
- Tragaki, A. , Richard, J.‐L. (2020), Premiers mois de l'épidémie de coronavirus COVID19 dans deux pays aux trajectoires différentes, la Grèce et la France, Documents de travail de l'Observatoire démographique de la Méditerranée. https://demomed.org/index.php/fr/ https://hal.archives-ouvertes.fr/hal-02879274/document
- Verity, R. , Okell, L. C. , Dorigatti, I. , Winskill, P. , Whittaker, C. , Imai, N. , Cuomo‐Dannenburg, G. , Thompson, H. , Walker, P. , Fu, H. , Dighe, A. , Griffin, J. T. , Baguelin, M. , Bhatia, S. , Boonyasiri, A. , Cori, A. , Cucunubá, Z. , FitzJohn, R. , Gaythorpe, K. , … Ferguson, N. M. (2020). Estimates of the severity of coronavirus disease 2019: A model‐based analysis. The Lancet Infectious Diseases, 20(6), 669–677. 10.1016/S1473-3099(20)30243-7 [DOI] [PMC free article] [PubMed] [Google Scholar]
- World Health Organization . (2020) “Smoking and Covid‐19”, Scientific Brief, 30‐06‐2020. https://www.who.int/publications/i/item/smoking‐and‐covid‐19
- Yuan, J. , Li, M. , Lv, G. , & Lu, Z. K. (2020). Monitoring transmissibility and mortality of COVID‐19 in Europe. International Journal of Infectious Diseases, 95, 311–315. 10.1016/j.ijid.2020.03.050 [DOI] [PMC free article] [PubMed] [Google Scholar]
Associated Data
This section collects any data citations, data availability statements, or supplementary materials included in this article.
Data Availability Statement
Data used for figures are available upon request.


