

Abstract
Universal platforms for biomolecular analysis using label‐free sensing modalities can address important diagnostic challenges. Electrical field effect‐sensors are an important class of devices that can enable point‐of‐care sensing by probing the charge in the biological entities. Use of crumpled graphene for this application is especially promising. It is previously reported that the limit of detection (LoD) on electrical field effect‐based sensors using DNA molecules on the crumpled graphene FET (field‐effect transistor) platform. Here, the crumpled graphene FET‐based biosensing of important biomarkers including small molecules and proteins is reported. The performance of devices is systematically evaluated and optimized by studying the effect of the crumpling ratio on electrical double layer (EDL) formation and bandgap opening on the graphene. It is also shown that a small and electroneutral molecule dopamine can be captured by an aptamer and its conformation change induced electrical signal changes. Three kinds of proteins were captured with specific antibodies including interleukin‐6 (IL‐6) and two viral proteins. All tested biomarkers are detectable with the highest sensitivity reported on the electrical platform. Significantly, two COVID‐19 related proteins, nucleocapsid (N‐) and spike (S‐) proteins antigens are successfully detected with extremely low LoDs. This electrical antigen tests can contribute to the challenge of rapid, point‐of‐care diagnostics.
Keywords: crumpled graphene FET biosensor, COVID‐19 antigen test, COVID‐19 proteins detection, dopamine detection, S‐ and N‐protein
The crumpled graphene field‐effect transistor‐based biosensing of important biomarkers are reported. Dopamine and three kinds of proteins, which are interleukin‐6 and two COVID‐19 related proteins, are captured with specific aptamer and antibodies. All tested biomarkers are detectable with the highest sensitivity reported. The crumpling effects of the electrical double layer formation and bandgap opening on the graphene are studied.
1. Introduction
An all electrical biosensor is of great interest and capturing increased attention, especially in the pandemic, as these devices can be used for clinical diagnosis, point‐of‐care testing, and on‐site detection.[ 1 ] The pandemic, amongst other healthcare challenges, has pointed attention to the importance of rapid and effective diagnosis of diseases.[ 2 ] FET‐based biosensors allow label‐free and highly sensitive biomolecular detection on integrated lab‐on‐a‐chip systems. Detection of pH, nucleic acids, proteins, and other biomarkers have been reported using FET biosensor with many different channel materials such as conventional silicon,[ 3 , 4 ] nanowire,[ 5 , 6 ] and 2D materials.[ 7 , 8 ] Among those, graphene is an attractive material due to its unique mechanical, chemical, and electrical properties. CVD‐grown graphene exhibits superior sensitivity in charge‐based detection of biomolecules owing to its single‐atom thickness and ultimate aspect ratio.
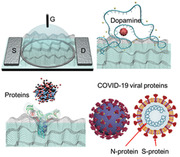
In the past, we have shown that the crumpled graphene FET‐based biosensor is capable of detecting nucleic acids with ultra‐high sensitivity.[ 9 , 10 ] This was due to the unique finding that the crumpled FET allows for an increase Debye length and reduced charge screening of the biomolecules, and that the bending of graphene can also open a bandgap, allowing for an exponential increase in current upon binding of charges. In this paper here, we demonstrate that the crumpled graphene can be universally used for different analytes and biomarkers across a range of sizes at unprecedented concentration level (Figure 1 ). Dopamine, Interleukin 6 (IL‐6) protein and SARS‐CoV‐2 Viral spike protein were detected on the crumpled graphene biosensor (Figure 1a). The high sensitivity was possible by optimizing the crumpling ratio of the graphene sensing film. We also investigated the effect of crumpling ratio (10–60%) on biosensing performance (Figure 1b) which is elaborated in the later section. Importantly, we have successfully detected COVID‐19 related proteins, spike (S‐), and nucleocapsid (n‐) proteins with extremely low LODs.
Figure 1.
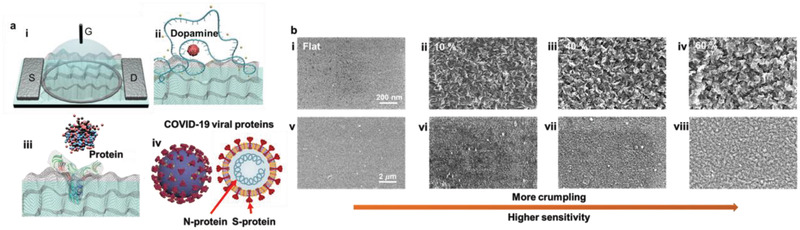
Schematics and characterization of crumpled graphene FET biosensor. a): i) Scheme of crumpled graphene FET biosensor; “S” is source, “G” is liquid gate, and “D” is drain electrodes. ii) Dopamine detection with aptamer probe and iii) various proteins detection with specific antibodies on the crumpled graphene channels. iv) Scheme and the lateral section of COVID‐19 virus which show targeted viral proteins for the proposed antigen test with crumpled graphene FET. b) SEM images of flat and different crumpling ratios of graphene. SEM images of i) flat graphene and ii–iv) with 10–60% of crumpling ratios. v–viii) SEM images of same samples of i–iv) with a larger scale. Scale bars and crumpling ratios are indicated on images.
2. Results and Discussion
2.1. Molecular Dynamics (MD) Simulations
We investigated the effect of RNA and ionic species near flat and crumpled graphene surfaces to predict and explain the enhanced sensitivity of molecular detection from our experimental observations. As shown in Figure 2 , five different configurations are considered (see the computational methods for the simulations details). In the first configuration, which is labeled as flat, a COVID‐19 RNA with 20 bases is equilibrated on a flat graphene sheet (see Note in supporting materials). In the other four systems, the RNA is self‐adsorbed onto the surface of the crumpled graphene along the concave regions of the graphene for different degrees of crumpling of 10%, 30%, 50%, and 70% (Figure 2a–e). It has been shown computationally that DNA molecules adsorb onto the concave region of crumpled graphene, as it is the most energetically favorable configuration.[ 9 ] The detection sensitivity of any charged molecule is influenced by the degree by which the charged molecule is screened by the electrical double layer (EDL). Detection of the RNA molecule is enhanced when more of the RNA charge is exposed to the graphene surface without being electrostatically screened by ions. The concentrations of ions (sodium and chloride) and the backbone of the RNA strand as well as the screening factor of ions are plotted in Figure 2 for all the configurations considered. The screening factor is obtained from, , where F is the Faraday constant, z is the normal distance from graphene surface (z = 0 on graphene) and σ is the surface charge density. As shown, because of the confined nature of the concave crumpled region, the ionic layer forms farther away from the concave graphene surface compared to the case of flat graphene. As the degree of crumpling increases, more ions are excluded from the graphene interface and the ionic screening takes place at a longer distance away from the graphene (Figure 2a–f). With less of the RNA charge screened in highly crumpled graphene sheets, the RNA detection is enhanced. Hence, it should be noted that performance of crumpled graphene can be correlated with the crumpling ratio and systematically optimized for improved performance. We controlled the crumpling ratio by varying the annealing temperature (110–115 °C) and time (10–120 min) as described later.
Figure 2.
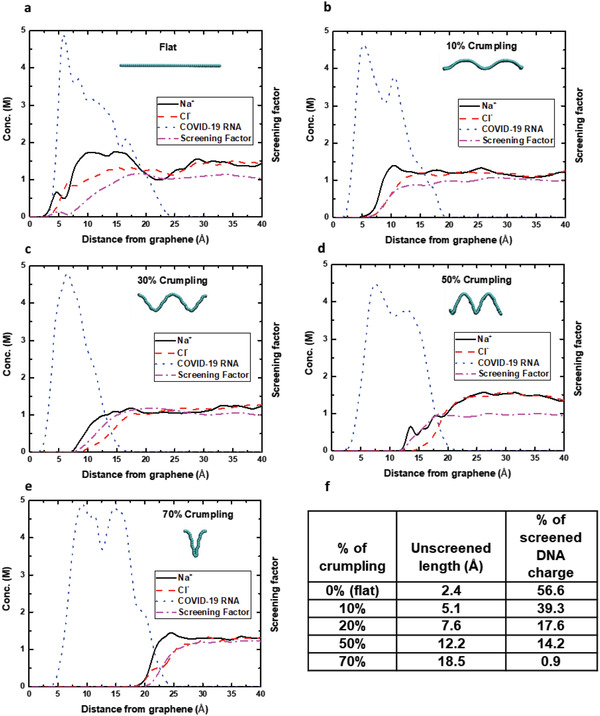
The molar concentration of ions (sodium and chloride) and the backbone of COVID‐19 RNA strand segment along with the screening factor of ions are plotted as a function of the distance from the graphene surface for a) flat, b) 10%, c) 30%, d) 50%, and e) 70% crumpled graphene. The configurations of different graphene (in cyan) are illustrated. In concave regions of crumpled graphene, ions are excluded due to its confinement and most of the adsorbed COVID‐19 RNA molecule remains unscreened electrostatically. As the degree of crumpling increases, more of the RNA molecules are exposed to the graphene surface without being electrostatically screened by ions resulting in enhanced RNA detection. f) Summary table of the simulations.
To investigate the electronic structure of the deformed graphene, we performed density functional theory (DFT) calculations using the local density approximation (LDA)[ 11 ] and Perdew–Burke–Ernzerhof (PBE)[ 12 ] functionals. Both LDA and PBE functionals produce bandgap values that are close to each other and show a local bandgap opening in the deformed graphene over all the crumpling range (10–60%) studied here (Figure S1, Supporting Information). While the bandgap exhibits an oscillatory behavior as a function of the crumpling percentage, the overall bandgap opening upon crumpling has been shown to play an important role in increasing the graphene detection sensitivity.[ 9 ]
2.2. Surface Characterization
Surface characterization of the crumpled graphene with different ratios was performed with AFM and SEM imaging, contact angle measurements, EDL capacitance measurements, and Raman spectroscopy analysis (Figure 3a–c and Figure S2, Supporting Information). There are previous studies which reported structural analysis, roughness changes, and hydrophobicity modulation with stepwise crumpling of graphene by stretching and releasing on elastic substrates.[ 13 , 14 , 15 ] However, there are few reports on graphene crumpling with slow buckling on a thermoplastic substrate with stepwise crumpling ratios.[ 10 , 16 , 17 , 18 ] We explored the different ratios of graphene crumpling using AFM imaging. As shown in Figure 3c and Figure S2, Supporting Information, increasing the crumpling ratio created increased roughness in the graphene. More complicated and rougher surface should perturb ion distribution at the interface of the graphene and the ionic solutions more effectively. Also, higher crumpling ratio increases the surface area of graphene per unit of flat area and thus the surface becomes more hydrophobic.[ 19 ] Those two effects are expected to result in modulation of Debye screening effect.
Figure 3.

Characterization of crumpling ratio effects. a) EDL capacitance of the graphene samples with crumpling ratio of i) 10%, ii) 30%, iii) 40%, and iv) 60%. b) Strain analysis via confocal Raman spectroscopy. i) Raw Raman spectrum of graphene with various crumpling ratios. ii) 2D peak position map of graphene with various crumpling ratios. Scale bars: 1 µm. iii) 2D Raw Raman spectrum of (ii) (iv) 2D peak position graph of (iii). c) AFM image of (i) 40% and (ii) 60% crumpled graphene. 3D AFM image of (iii) 40% and (iv) 60% crumpled graphene. d) Dirac point shift by ssDNA absorption on graphene FET sensors with various crumpling ratios.
Hydrophobicity heavily influences the formation of the EDL and it is directly related to Debye screening effect and thus affect the sensitivity of the charge‐based sensors.[ 20 ] The hydrophobicity of crumpled graphene samples with four different crumpling ratios was compared by contact angle measurements (Figure S2, Supporting Information). It has already been shown that the hydrophobicity of MoS2 sheets on the pre‐strained polystyrene substrate can be tuned by different crumpling ratio with the similar experimental schematics with this work.[ 19 ] In the previous study on MoS2, higher crumpling ratio provided higher hydrophobicity. Similar to this result, 60% crumpled graphene showed the highest hydrophobicity with the largest contact angle while 15% crumpling showed the smallest contact angle. EDL capacitance measurements results were also consistent with the contact angle data (Figure 3a). 55% crumpling showed the smallest capacitance, which indicated the highest hydrophobicity. However, the wettability of the graphene tends to decrease as the crumpling ratio is increased. We found that it might be hard to settle on Wenzel state at certain highly crumpling ratio, resulting in unstable Dirac point measurement over time.
Because of increased hydrophobicity, crumpled graphene devices need ‘wetting process’ by repeating the I–V measurements over hours without adding target molecules. When the Dirac points are identical for at least 2 h, the actual biomarker detection experiments can be initiated. We found that devices with higher crumpling required a longer time for the wetting process. Most of devices with 50% crumpled ratios required up to 4 h of wetting process, while flat devices did not need any prior incubation time for wetting. When the crumpling ratio was 60%, some devices needed more than one day of wetting and even after the Dirac point being stable, about 25% of the devices yielded reliable and consistent sensing results. These issues could be attributed to irreversible bonding of some ions with graphene with prolonged exposure to water.[ 21 ] Hence, increase in sensitivity of devices is also correlated with decreasing yield and we concluded that ≈55% is the optimal crumpling ratio when considering the trade‐offs between sensitivity, reproducibility and yield. Further studies are warranted to quantify these trends in more detail.
It is known that strain effect can open the bandgap in graphene and we have shown that the strain induced by crumpling process may locally open the bandgap of the curved graphene.[ 22 ] It has been reported that the strain modulation of graphene by nanoscale substrate curvatures can be characterized by measuring shifts of G and 2D peaks[16,23,24] and rippled graphene can behave as a semiconductor due to the strain.[ 24 ] Moreover, larger strain may open larger bandgap.[ 22 ] Therefore, if increasing the crumpling ratio generates larger strain, the bandgap opening effect can be larger with higher crumpling ratio and could contribute to larger exponential changes in the current from a small numbers of charges.[ 25 ]
Typical raw spectra Raman peaks of crumpled graphene with different crumpling ratios are shown in Figure 3b. The size of the laser spot in the Raman measurements is ≈0.2 × 0.2 µm2, covering many peaks and valleys of various sizes of crumples. Thus, the spatially averaged strain across crumples was measured in each spectrum spot. It is reasonable to consider those values as estimates of the overall magnitude of strain even though these averaged measurements are not the complete information of the microscopic strain distribution. It is well‐known that two prominent peaks are closely related to strain effect on graphene: G mode (1580−1590 cm−1) and 2D mode (2660−2680 cm−1). However, G peaks of the polystyrene substrate and graphene overlap, making only the 2D mode peaks useful.[ 9 ] Compared to 5% crumpled graphene, 20, 40, and 60% show blue shifts in the 2D peaks, with more significant shifts occurring in larger crumpling ratios. In Figure 3b, the measured spectrum in each optical pixel is fitted with Lorentzian line shapes for 2D modes, and the fitted peak values (ω2D) are plotted in the map. The strong modulation on the Raman scattering of crumpled graphene was confirmed by the sharp transition across the domain boundary and the large spectral shifts. Raman peak shifts in graphene are known to be sensitive to strain modulations.[ 16 , 23 , 26 ] The strain is tensile if the shift is blue and compressive when it is red. The average strain effect of different crumpling ratios shows a clear increasing trend (Figure 3b). All the larger crumpling ratios samples have larger average tensile strain than the smallest crumpling ratio, 5%, revealing that the graphene lattice is stretched with larger crumpling ratios. It was reported that the stretched graphene showed bandgap opening and the gap can be larger when the tensile strain was increased.[ 22 ] It is reasonable to conclude that the larger crumpling ratio might open larger bandgap of graphene because of the larger strain and this can lead to the higher sensitivity in charge‐based biomolecular sensing.[ 9 , 25 ]
To clarify the physical distinction of highly crumpled graphene, 40% and 60% of crumpled graphene samples were imaged by atomic force microscopy (AFM) (Figure 3c). 2 dimensional images of AFM images were not so distinguishable at glance. However, 3D images show clearly higher fluctuation in z‐direction for the 60% sample as compared to the 40%. Rq and Rs values are also higher as marked in Figure 3c.
DNA absorption through π–π stacking on the graphene FET was also investigated with varied crumpling ratios and electrical measurements (Figure 3d). Four different crumpling ratios ranging from 10% to 55% has been tested in 1 × PBS buffer solution. As predicted, the 55% showed the largest Dirac shift of 50 mV while the 30% showed 15 mV. LODs were also different; there was 8 mV of shift with the 55% crumpling at 200 zM, which corresponds to only ≈6 molecules (≈120 copy per mL). However, similar size of shift was observed at 20 aM with 40% of crumpling and negligible shifts were observed below this concentration. Noticeable shifts were observed from 2 fM for 30% of crumpling. In the previous study, flat device did not generate meaningful signals with the similar experimental condition. From the above results, we optimized the crumpling ratio to 55% and used this ratio for the sensing experiments performed next. We note that the rest of the device fabrication, sample preparation including the probe molecule immobilization, and electrical measurement methods were previously published.[ 9 ] We postulate that the sensitivity enhancement effect induced by the crumpling process can be applied to charge‐based molecular detection.
2.3. Detection of Small Molecule Dopamine
We first examined the detection of an uncharged small molecule, dopamine, which is a neurotransmitter associated with motivational salience, and can serve as a biomarker for the onset and progression of diverse diseases such as schizophrenia, Parkinson's disease, and several cancers such as neuroblastoma and pheochromocytoma.[ 27 ] Conventional monitoring methods of upregulation, downregulation or imbalance of dopamine are challenged by rigorous sample preparation to achieve the desired specificity and sensitivity. Precise detection of dopamine can be closely related to early diagnosis of neurological diseases, function tests of dopaminergic neurons derived from various stem cell sources and toxicity assessments of drugs.[ 28 ] Dopamine is electrically neutral and hence could not be directly detected by a FET based sensor; however, a previous study showed that the neutral molecules can be detectable with conformational change of aptamer probes.[ 29 ] Graphene‐ and its nanocomposite‐based electrical or electrochemical sensing of dopamine have been demonstrated previously however, as dopamine is electroneutral, the detections relied on redox or oxidation process of analytes, which lack specificity and sensitivity.[ 30 , 31 , 32 ] A few studies utilized aptamer as a probe molecule for aptamer detection and one report demonstrated Indium oxide FET‐based dopamine detection at fM range of concentration with conformation change of aptamer probe when capturing the target molecules.[ 29 , 33 ]
Aptamer is a single stranded DNA or RNA, and its conformation is changed upon binding of the target resulting in a change in the distance of the overall charge from the negative backbone to the active channel surface. In a previous report where the same aptamer was used on an organic FET biosensor, the aptamer, which is negatively charged, became closer to the active channel surface when capturing dopamine.[ 29 ] This situation can be analogous to DNA capturing the target molecules and the IV curve of the proposed graphene FET biosensor is expected to shift to left.[ 9 ] As seen in Figure 4 , capture of dopamine by the aptamer induced left‐shift of the I–V curve, consistent with the previous reports. The dopamine aptamer‐FET exhibited concentration‐dependent responses to dopamine, ranging from 2.5 aM to 2.5 µM). The LoD of 25 aM is three orders of magnitude lower than the previous report with the same aptamer. Negative control tests were performed with non‐specific target molecule serotonin as well as with dopamine without the aptamer probe. Negative control signals were negligible compared to the positive test signals. Dopamine detection was also reproduced on a regular flat graphene FET and the sensitivity was far inferior.
Figure 4.
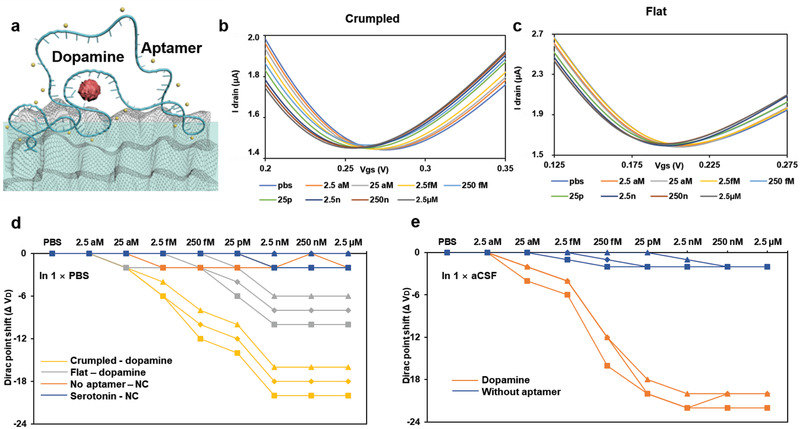
Dopamine detections on graphene FET biosensors. a) Schematic of dopamine capturing with aptamer on the crumpled graphene channel. b) I–V relationship of the crumpled and c) flat graphene FET sensors for the dopamine detection using aptamer probe. d) Dirac voltage shift of the FET sensor with the detection of dopamine in PBS, NC is negative control with no aptamer attached or with serotonin, and e) In aCSF (Artificial cerebrospinal fluid). Sample without aptamer is the negative control sample is aCSF only which has only chemicals typically present, and sample with Dopamine is aCSF spiked with Dopamine.
2.4. Detection of IL‐6 Protein
We also detect proteins such as interleukin‐6 (IL‐6) and viral protein on the crumpled graphene FET biosensor with very high sensitivity.[ 1 , 34 , 35 ] IL‐6 protein is a multipotent cytokine that plays an important role in immune responses, inflammation, bone metabolism, reproduction, arthritis, aging, and neoplasia.[ 36 ] Monitoring the level of IL‐6 protein can help diagnose inflammatory diseases and sepsis. Concentration level of IL‐6 in blood can grow up to approximately nM range under these disease conditions.[ 37 ] However, several reports proposed advanced diagnostics in other body fluids which are easier to collect such as saliva, sweat or urine, and those solutions contain much lower concentration of IL‐6 than in blood, thus requiring highly sensitive sensing platform.[ 38 , 39 ]
We next tested detection of Interleukin 6 (IL‐6) as shown in Figure 5a,b. To bind the inherently charged IL‐6 protein, IL‐6 antibody was used as a probe molecule. It was reported that the detection of IL‐6 protein with the antibody on a graphene FET showed negative shift of the IV curves.[ 34 ] We also consistently found negative shifts of Dirac points with the detection of IL‐6 protein with the antibody on the crumpled graphene FET in 1 × PBS (Figure 5b). The total shift is smaller than previously reported DNA detection because there can be certain distances from the graphene surface to the charged target protein (≈25 kDa) due to the bulkiness of the antibody as the general IgG molecular weight is ≈150 kDa. The isoelectric point of IL‐6 protein is 6.96 therefore it can be assumed that the overall charge of the protein is negative in PBS solution which could explain the left‐shifts of the IV curves. The flat device was not able to detect IL‐6 protein as the protein is further away and screened as Debye length of 1 × PBS is ≈1 nm. In summary, we demonstrated detection of IL‐6 protein detection by using its antibody as a probe molecule on the crumpled graphene FET in 1 × PBS and showed aM level sensitivity, which corresponds to only tens of molecules in 50 µL, given sample volume.
Figure 5.
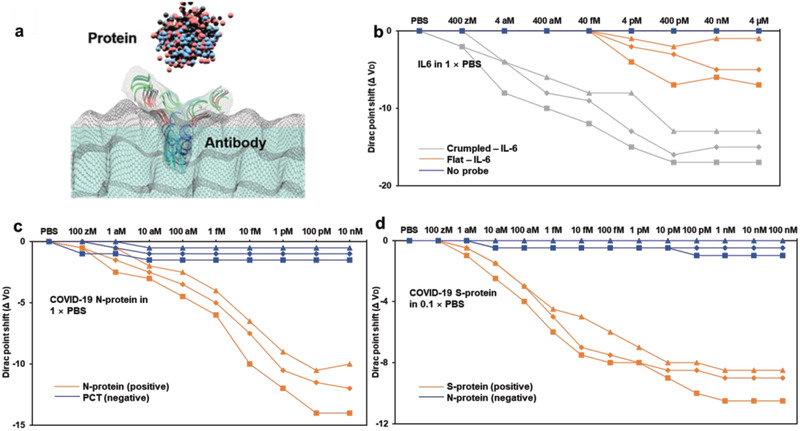
Various protein detections on graphene FET biosensors. a) Schematic of proteins capturing with specific antibodies on the crumpled graphene channel. b) Dirac voltage shift of the FET sensor with detection of IL‐6 protein, c) COVID‐19 N‐protein, and d) S‐protein.
2.5. Detection of SARS CoV‐2 Antigens
There are three kinds of commercially available tests for COVID‐19. These are; i) detection of viral RNA genes based on nucleic acid amplification techniques are the gold standard for confirmation of COVID‐19, ii) Antigen tests which target the proteins on or inside the virus. The antigen tests do not need amplification and hence can significantly reduce the turnaround time but are inherently less sensitive as compared to the RNA tests, and iii) antibody tests from blood samples which detect presence of antibodies and confirm immunity from the infection. There is an opportunity to improve the sensitivity of the antigen tests and use of label‐free electric sensors could play a role in this area. For SARS‐CoV‐2, the spike protein or the nucleocapsid protein can be captured with specific antibodies anchored on surfaces. Several antigen tests are available or in development by companies including Quidel, OraSure, Iceni Diagnostics, and E25Bio. These antigen tests are typically based on enzyme‐linked immunoassay (ELISA) and have an optical readout. New tests typically require fluorescence labelling or nanoparticle anchoring to enhance the output signal. There are reports which have raised concerns about the performance of available antigen tests.[ 40 , 41 ] For example, an analysis suggest that each 10‐fold increase in LoD is expected to increase the false negative rate by 13%, missing an additional one in eight infected patients.[ 41 ]
The crumpled graphene FET‐based antigen test can be important as its sensitivity can be superior to ELISA and it does not require any labelling.[ 40 , 42 , 43 ] Such sensors can attempt to capture whole virus or the proteins after the virus lysis, the later can be safer from a user perspective. Recent reports have demonstrated label‐free COVID‐19 related protein detection in human nasopharyngeal swab specimens on graphene FET sensors.[ 1 ]
We immobilized N‐ and S‐protein antibodies (purchased from CD Diagnostics) on the graphene channels as reported previously[ 1 ] (Figure 5a). Different kinds of coronavirus‐related N‐proteins detections were reported using nanowire FET in the pM concentrations.[ 44 , 45 ] However, an improvement in sensitivity desired if antigen tests were to replace the RNA molecular detection tests.[ 41 ] Moreover, COVID‐19 N‐protein has not been tested on graphene FET based biosensor before this report. Figure 5c shows our results of the IV‐curve shifts with N‐protein detection in 1 × PBS on the crumpled graphene channels.
The isoelectric point of the N‐protein is pH ≈10 and thus the overall charge would be positive in 1 × PBS. However, previous studies showed that some regions of the previous SARS N‐protein, of which the isoelectric point was also ≈10, are locally negatively charged.[ 44 , 46 ] It might be possible that the positive charges on active channel surface attract the negatively charged regions of N‐protein captured on the surface, thus leading to conductance change as a result of the local negative charges of the antigens at the surface.[ 44 , 45 ] This result was supported by study with computational simulations, which shows that N‐protein has an asymmetric charge distribution.[ 47 ] Depends on the “up” or “down” orientation, the protein would generate different charge signals at pH = 7.4. It was concluded that, with “up orientation,” the N‐protein is expected to exhibit negative charges for Debye screening lengths up to 3 nm.[ 47 ] Even though these previous results were based on SARS N‐protein and not the SARS‐CoV‐2 N‐protein, their isoelectric points and molecular weights are very similar, that is, pH ≈10 and 46 kDa, respectively. Furthermore, it was recently shown that many aspects of SARS N‐protein and COVID‐19 N‐protein are similar and have more than 90% sequence similarity.[ 48 ] Thus it might be reasonable that electrical charge effect of COVID‐19 N‐protein on graphene surface could be either positive or negative depending on the orientation.[ 49 , 50 ]
The S‐protein was also tested on the crumpled graphene FET (Figure 5d) and showed a clear shift at 1 aM in 0.1 × PBS. In 1 × PBS, the signal from S‐protein detection was not statistically significant and could not be delineated. This can also be explained by large size of the S‐protein antibody at ≈150 kDa and the decrease in Debye Length from 0.1× to 1× PBS. Many prior studies have reported on the differences in signal with size of antibodies as function of experimental conditions, including buffer solution concentrations, etc.[ 1 , 44 , 45 , 51 ] Comparison of electrolyte‐gated FET biosensor sensitivity is shown in Table S1, Supporting Information.
3. Conclusion
In summary, detection of several important disease‐related biomarkers including dopamine, IL‐6 protein, and viral proteins were demonstrated on the crumpled graphene FET biosensor. The effect of various crumpling ratio on the detection sensitivity was studied and confirmed by computational simulations, Raman spectroscopy analysis, and EDL capacitance measurements. The optimized crumpled graphene FET biosensors were able to detect various sizes of biomarkers with unprecedented sensitivities. Importantly, we also demonstrated SARS CoV‐2 antigen test by detecting S‐ and N‐proteins with the crumpled graphene FET biosensor in a label‐free format that could result in a diagnostic tool with small footprint. This platform can overcome the limitation of currently available antigen tests owing to its superior sensitivity due to modulation of the Debye layer on the crumpled graphene biosensors. In the future, this platform can be highly multiplexed and can target many multiple biomarkers on a chip and have a significant impact on the diagnostics market.
4. Experimental Section
MD Simulations
Molecular dynamics simulations were performed using the LAMMPS package.[ 52 ] The systems were generated by the Visual Molecular Dynamics (VMD).[ 53 ] As mentioned in the manuscript, different graphene topologies with crumpling degrees of 0% (flat), 10%, 30%, 50%, and 70% are used. Each simulation box consists of a single‐layer graphene sheet, a single‐stranded COVID‐19 RNA, water, and ions. The COVID‐19 RNA segment has 20 bases with a sequence of GAC CCC AAA ATC AGC GAA AT. A concentration of 1.2 m sodium chloride is considered. Depending on the degree of crumpling, the simulation system contained 20 000–80 000 atoms. Periodic boundary conditions are applied in the x and y directions (projected plane of graphene lies in the xy plane). The systems are non‐periodic in z direction. The CHARMM forcefield[ 54 ] is used. The Lennard‐Jones (LJ) potential with a cutoff distance of 1.2 nm is employed. The long–range electrostatic interactions are calculated using the PPPM.[ 55 ]
First, the energy of each system was minimized for 15 000 steps. Equilibrium simulations were then performed in NPT ensemble for 2 ns at a pressure of 1 atm and a temperature of 300 K. The NPT simulation ensures that the water reaches its equilibrium density. The systems were further equilibrated in NVT ensemble for another 2ns at 300 K. Temperature was maintained at 300 K by using the Nosè–Hoover thermostat[ 56 , 57 ] with a time constant of 0.1 ps. The carbon atoms of graphene are kept frozen. The production simulations were carried out in NVT ensemble for 10 ns. Trajectories of atoms were dumped every picosecond to obtain the structure of RNA and ions near graphene sheets.
Atomic Force Microscopy Imaging
AFM images were recorded using an ASYLUM RESEARCH MFP‐3D AFM SYSTEM (Asylum Research, Santa Barbara, CA).
Raman Spectroscopy Imaging
The Raman spectra and imaging of the crumpled graphene were recorded using a Nanophoton RAMAN‐11 laser confocal microscope (Nanophoton, Osaka, Japan). A 532 nm diode laser was used for excitation. The excitation power was 0.1 mW with 3 s exposure time and 3 times averaging for point and mapping, respectively. In Raman mapping mode, region of interest was 2.2 by 2.2 um in x, y axis with 200 nm per pixel resolution with NA 0.9 100x Plan Fluor objective lens. The grating was 600 gr mm−1. The wave number range covered was 700–2900 cm−1. The wavenumber shift compensation was −8.4 cm−1 after initial Ne‐sample calibration. The Raman signals were detected by a Peltier cooled CCD camera at −70 °C.
Conflict of Interest
The authors declare no conflict of interest.
Author Contributions
M.T.H. and I.P. contributed equally to this work. M.T.H. and R.B. conceived the work and designed the experiments. M.T.H., I.P., and V.F. carried out the electrical measurements. M.H., A.T., and N.A. performed the computational simulation. M.T.H. fabricated the devices. I.P. conducted the AFM and SEM measurements, Raman spectroscopy analysis and contact angle measurements. N.A. supervised the simulation efforts. R.B. supervised and led the project. All authors contributed to intellectual insights of this work. M.T.H., M.H., A.T., I.P., N.A. and R.B. wrote the manuscript, and all authors edited the manuscript.
Supporting information
Supporting Information
Acknowledgements
This research was primarily supported by the NSF through the University of Illinois at Urbana‐Champaign Materials Research Science and Engineering Center DMR‐1720633. The work was carried out in part in the Holonyak Micro and Nanotechnology Laboratory and the Material Research Laboratory Central Facilities at University of Illinois. The authors are grateful to their colleague, Yerim Kim for advice during the experiments.
Hwang M. T., Park I., Heiranian M., Taqieddin A., You S., Faramarzi V., Pak A. A., van der A. M. Zande, Aluru N. R., Bashir R., Ultrasensitive Detection of Dopamine, IL‐6 and SARS‐CoV‐2 Proteins on Crumpled Graphene FET Biosensor. Adv. Mater. Technol. 2021, 6, 2100712. 10.1002/admt.202100712
Data Availability Statement
The data that support the findings of this study are available from the corresponding author upon reasonable request.
References
- 1. Seo G., Lee G., Kim M. J., Baek S.‐H., Choi M., Ku K. B., Lee C.‐S., Jun S., Park D., Kim H. G., Kim S.‐J., Lee J.‐O., Kim B. T., Park E. C., Il Kim S., ACS Nano 2020, 14, 5135. [DOI] [PubMed] [Google Scholar]
- 2. Ji T., Liu Z., Wang G., Guo X., Akbar khan S., Lai C., Chen H., Huang S., Xia S., Chen B., Jia H., Chen Y., Zhou Q., Biosens. Bioelectron. 2020, 166, 112455. [DOI] [PMC free article] [PubMed] [Google Scholar]
- 3. Duarte‐Guevara C., Swaminathan V., B. Reddy Jr., Wen C.‐H., Huang Y.‐J., Huang J.‐C., Liu Y.‐S., Bashir R., Sensors Actuators B Chem. 2017, 250, 100. [Google Scholar]
- 4. Ganguli A., Watanabe Y., Hwang M. T., Huang J.‐C., Bashir R., Biomed. Microdevices 2018, 20, 45. [DOI] [PubMed] [Google Scholar]
- 5. Dorvel B. R., Reddy B., Go J., Guevara C. Duarte, Salm E., Alam M. A., Bashir R., ACS Nano 2012, 6, 6150. [DOI] [PMC free article] [PubMed] [Google Scholar]
- 6. Dorvel B., Reddy B., Bashir R., Anal. Chem. 2013, 85, 9493. [DOI] [PMC free article] [PubMed] [Google Scholar]
- 7. Hwang M. T., Landon P. B., Lee J., Choi D., Mo A. H., Glinsky G., Lal R., Proc. Natl. Acad. Sci. 2016, 113, 7088. [DOI] [PMC free article] [PubMed] [Google Scholar]
- 8. Hwang M. T., Wang Z., Ping J., Ban D. K., Shiah Z. C., Antonschmidt L., Lee J., Liu Y., Karkisaval A. G., Johnson A. T. C., Fan C., Glinsky G., Lal R., Adv. Mater. 2018, 30, 1802440. [DOI] [PMC free article] [PubMed] [Google Scholar]
- 9. Hwang M. T., Heiranian M., Kim Y., You S., Leem J., Taqieddin A., Faramarzi V., Jing Y., Park I., van der Zande A. M., Nam S., Aluru N. R., Bashir R., Nat. Commun. 2020, 11, 1543. [DOI] [PMC free article] [PubMed] [Google Scholar]
- 10. Snapp P., Heiranian M., Hwang M. T., Bashir R., Aluru N. R., Nam S., Curr. Opin. Solid State Mater. Sci. 2020, 24, 100836. [Google Scholar]
- 11. Ceperley D. M., Alder B. J., Phys. Rev. Lett. 1980, 45, 566. [Google Scholar]
- 12. Perdew J. P., Burke K., Ernzerhof M., Phys. Rev. Lett. 1996, 77, 3865. [DOI] [PubMed] [Google Scholar]
- 13. Zang J., Ryu S., Pugno N., Wang Q., Tu Q., Buehler M. J., Zhao X., Nat. Mater. 2013, 12, 321. [DOI] [PMC free article] [PubMed] [Google Scholar]
- 14. Deng S., Berry V., Mater. Today 2016, 19, 197. [Google Scholar]
- 15. Rhee D., Paci J. T., Deng S., Lee W.‐K., Schatz G. C., Odom T. W., ACS Nano 2020, 14, 166. [DOI] [PubMed] [Google Scholar]
- 16. Lee W.‐K., Kang J., Chen K.‐S., Engel C. J., Jung W.‐B., Rhee D., Hersam M. C., Odom T. W., Nano Lett. 2016, 16, 7121. [DOI] [PubMed] [Google Scholar]
- 17. Chen P.‐Y., Sodhi J., Qiu Y., Valentin T. M., Steinberg R. S., Wang Z., Hurt R. H., Wong I. Y., Adv. Mater. 2016, 28, 3564. [DOI] [PubMed] [Google Scholar]
- 18. Chen W., Gui X., Yang L., Zhu H., Tang Z., Nanoscale Horiz. 2019, 4, 291. [DOI] [PubMed] [Google Scholar]
- 19. Choi J., Mun J., Wang M. C., Ashraf A., Kang S.‐W., Nam S., Nano Lett. 2017, 17, 1756. [DOI] [PubMed] [Google Scholar]
- 20. Kwon S. S., Choi J., Heiranian M., Kim Y., Chang W. J., Knapp P. M., Wang M. C., Kim J. M., Aluru N. R., Il Park W., Nam S., Nano Lett. 2019, 19, 4588. [DOI] [PubMed] [Google Scholar]
- 21. Kwon S. S., Yi J., Lee W. W., Shin J. H., Kim S. H., Cho S. H., Nam S., Il Park W., ACS Appl. Mater. Interfaces 2016, 8, 834. [DOI] [PubMed] [Google Scholar]
- 22. Ni Z. H., Yu T., Lu Y. H., Wang Y. Y., Feng Y. P., Shen Z. X., ACS Nano 2008, 2, 2301. [DOI] [PubMed] [Google Scholar]
- 23. Zhang Y., Heiranian M., Janicek B., Budrikis Z., Zapperi S., Huang P. Y., Johnson H. T., Aluru N. R., Lyding J. W., Mason N., Nano Lett. 2018, 18, 2098. [DOI] [PubMed] [Google Scholar]
- 24. Monteverde U., Pal J., Migliorato M. A., Missous M., Bangert U., Zan R., Kashtiban R., Powell D., Carbon 2015, 91, 266. [Google Scholar]
- 25. Sarkar D., Liu W., Xie X., Anselmo A. C., Mitragotri S., Banerjee K., ACS Nano 2014, 8, 3992. [DOI] [PubMed] [Google Scholar]
- 26. Lee J. E., Ahn G., Shim J., Lee Y. S., Ryu S., Nat. Commun. 2012, 3, 1024. [DOI] [PubMed] [Google Scholar]
- 27. Vázquez‐Guardado A., Barkam S., Peppler M., Biswas A., Dennis W., Das S., Seal S., Chanda D., Nano Lett. 2019, 19, 449. [DOI] [PubMed] [Google Scholar]
- 28. Kim D.‐S., Kang E.‐S., Baek S., Choo S.‐S., Chung Y.‐H., Lee D., Min J., Kim T.‐H., Sci. Rep. 2018, 8, 14049. [DOI] [PMC free article] [PubMed] [Google Scholar]
- 29. Nakatsuka N., Yang K.‐A., Abendroth J. M., Cheung K. M., Xu X., Yang H., Zhao C., Zhu B., Rim Y. S., Yang Y., Weiss P. S., Stojanović M. N., Andrews A. M., Science (80‐.). 2018, 362, 319. [DOI] [PMC free article] [PubMed] [Google Scholar]
- 30. Pandikumar A., Soon How G. T., See T. P., Omar F. S., Jayabal S., Kamali K. Z., Yusoff N., Jamil A., Ramaraj R., John S. A., Lim H. N., Huang N. M., RSC Adv. 2014, 4, 63296. [Google Scholar]
- 31. Oh J., Lee J. S., Jun J., Kim S. G., Jang J., ACS Appl. Mater. Interfaces 2017, 9, 39526. [DOI] [PubMed] [Google Scholar]
- 32. Zhang M., Liao C., Yao Y., Liu Z., Gong F., Yan F., Adv. Funct. Mater. 2014, 24, 978. [Google Scholar]
- 33. Li B.‐R., Hsieh Y.‐J., Chen Y.‐X., Chung Y.‐T., Pan C.‐Y., Chen Y.‐T., J. Am. Chem. Soc. 2013, 135, 16034. [DOI] [PubMed] [Google Scholar]
- 34. Huang J., Harvey J., Fam W. H. D., Nimmo M. A., Tok I. Y. A., Procedia Eng. 2013, 60, 195. [Google Scholar]
- 35. Huang J., Chen H., Niu W., Fam D. W. H., Palaniappan A., Larisika M., Faulkner S. H., Nowak C., Nimmo M. A., Liedberg B., Tok A. I. Y., RSC Adv. 2015, 5, 39245. [Google Scholar]
- 36. Jiang X.‐P., Yang D. C., Elliott R. L., Head J. F., Anticancer Res. 2011, 31, 2899. [PubMed] [Google Scholar]
- 37. Angulo J., Martínez‐Valdebenito C., Marco C., Galeno H., Villagra E., Vera L., Lagos N., Becerra N., Mora J., Bermúdez A., Díaz J., Ferrés M., López‐Lastra M., PLoS Negl. Trop. Dis. 2017, 11, e0005757. [DOI] [PMC free article] [PubMed] [Google Scholar]
- 38. Kumar S., Sharma J. G., Maji S., Malhotra B. D., Biosens. Bioelectron. 2016, 78, 497. [DOI] [PubMed] [Google Scholar]
- 39. Hladek M. D., Szanton S. L., Cho Y.‐E., Lai C., Sacko C., Roberts L., Gill J., J. Immunol. Methods 2018, 454, 1. [DOI] [PMC free article] [PubMed] [Google Scholar]
- 40. Scohy A., Anantharajah A., Bodéus M., Kabamba‐Mukadi B., Verroken A., Rodriguez‐Villalobos H., J. Clin. Virol. 2020, 129, 104455. [DOI] [PMC free article] [PubMed] [Google Scholar]
- 41. Arnaout R., Lee R. A., Lee G. R., Callahan C., Yen C. F., Smith K. P., Arora R., Kirby J. E., bioRxiv 2020, 2020.06.02.131144. [Google Scholar]
- 42. Quinn C. P., Semenova V. A., Elie C. M., Romero‐Steiner S., Greene C., Li H., Stamey K., Steward‐Clark E., Schmidt D. S., Mothershed E., Pruckler J., Schwartz S., Benson R. F., Helsel L. O., Holder P. F., Johnson S. E., Kellum M., Messmer T., Thacker W. L., Besser L., Plikaytis B. D., Taylor T. H., Freeman A. E., Wallace K. J., Dull P., Sejvar J., Bruce E., Moreno R., Schuchat A., Lingappa J. R., Martin S. K., Walls J., Bronsdon M., Carlone G. M., Bajani‐Ari M., Ashford D. A., Stephens D. S., Perkins B. A., Emerg. Infect. Dis. J. 2002, 8, 1103. [DOI] [PMC free article] [PubMed] [Google Scholar]
- 43. Zhao B., Che C., Wang W., Li N., Cunningham B. T., Talanta 2021, 225, 122004. [DOI] [PMC free article] [PubMed] [Google Scholar]
- 44. Ishikawa F. N., Chang H.‐K., Curreli M., Liao H.‐I., Olson C. A., Chen P.‐C., Zhang R., Roberts R. W., Sun R., Cote R. J., Thompson M. E., Zhou C., ACS Nano 2009, 3, 1219. [DOI] [PMC free article] [PubMed] [Google Scholar]
- 45. Ishikawa F. N., Curreli M., Olson C. A., Liao H.‐I., Sun R., Roberts R. W., Cote R. J., Thompson M. E., Zhou C., ACS Nano 2010, 4, 6914. [DOI] [PubMed] [Google Scholar]
- 46. Lai M. M., Cavanagh D., Adv. Virus Res. 1997, 48, 1. [DOI] [PMC free article] [PubMed] [Google Scholar]
- 47. Hediger M. R., Martinez K. L., Nygård J., Brandbyge M., Jensen J. H., De Vico L., in BioFET‐SIM: A Tool for the Analysis and Prediction of Signal Changes in Nanowire‐Based Field Effect Transistor Biosensors BT ‐ Nanoscale Sensors (Eds: Li S., Wu J., Wang Z. M., Jiang Y.), Springer International Publishing, Cham: 2013, pp. 55–86. [Google Scholar]
- 48. Tilocca B., Soggiu A., Sanguinetti M., Musella V., Britti D., Bonizzi L., Urbani A., Roncada P., Microbes Infect. 2020, 22, 188. [DOI] [PMC free article] [PubMed] [Google Scholar]
- 49. Chen R. J., Choi H. C., Bangsaruntip S., Yenilmez E., Tang X., Wang Q., Chang Y.‐L., Dai H., J. Am. Chem. Soc. 2004, 126, 1563. [DOI] [PubMed] [Google Scholar]
- 50. Lin C.‐T., Loan P. T. K., Chen T.‐Y., Liu K.‐K., Chen C.‐H., Wei K.‐H., Li L.‐J., Adv. Funct. Mater. 2013, 23, 2301. [Google Scholar]
- 51. Zhang X., Qi Q., Jing Q., Ao S., Zhang Z., Ding M., Wu M., Liu K., Wang W., Ling Y., arXiv Prepr. arXiv2003.12529, 2020.
- 52. Plimpton S., J. Comput. Phys. 1995, 117, 1. [Google Scholar]
- 53. Humphrey W., Dalke A., Schulten K., J. Mol. Graph. 1996, 14, 33. [DOI] [PubMed] [Google Scholar]
- 54. MacKerell A. D., Banavali N. K., J. Comput. Chem. 2000, 21, 105. [Google Scholar]
- 55. Hockney R. W., Eastwood J. W., Computer Simulation Using Particles, McGraw‐Hill, New York: 1981. [Google Scholar]
- 56. Nosé S., J. Chem. Phys. 1984, 81, 511. [Google Scholar]
- 57. Hoover W. G., Phys. Rev. A 1985, 31, 1695. [DOI] [PubMed] [Google Scholar]
Associated Data
This section collects any data citations, data availability statements, or supplementary materials included in this article.
Supplementary Materials
Supporting Information
Data Availability Statement
The data that support the findings of this study are available from the corresponding author upon reasonable request.