

Abstract
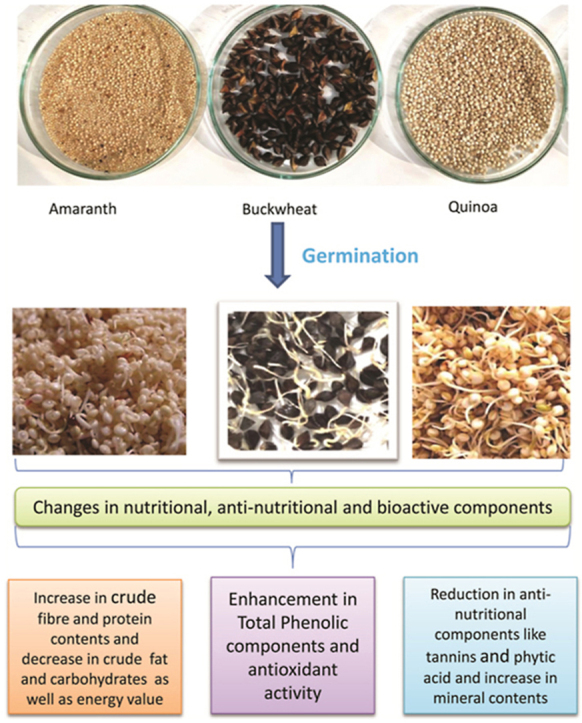
Pseudocereals have attracted the attention of nutritionists and food technologists due to their high nutritional value. In addition to their richness in nutritional and bioactive components, these are deficient in gluten and can serve as valuable food for persons suffering from gluten allergies. Processing treatments are considered an effective way to enhance the quality of food grains. Soaking and germination are traditional and most effective treatments for enhancing the nutritional and bioactive potential as well as reducing the anti-nutritional components in food grains. This study reflects the effect of soaking and germination treatments on nutritional, bioactive, and anti-nutritional characteristics of pseudocereals. There was a significant (p ≤ 0.05) increase in nutritional and bioactive components such as crude fiber, crude protein, phenolic components, antioxidant activity, and mineral content but reduced the anti-nutrients such as tannin and phytic acid. In amaranth, there was a significant increase (p ≤ 0.05) of 7.01, 74.67, 126.62, and 87.47% in crude protein, crude fiber, phenolic content, and antioxidant activity but significant (p ≤ 0.05) reduction of 32.30% and 29.57% in tannin and phytic acid contents, respectively. Similar changes in values of crude proteins, crude fiber, phenolic content, and antioxidant activity were observed in buckwheat and quinoa. While the anti-nutritional components such as tannin and phytic acid decreased by 59.91 and 17.42%, in buckwheat and 27.08% and 47.57%, in quinoa, respectively. Therefore, soaking and germination proved to be excellent techniques to minimize the anti-nutritional component and enhance the nutritional, bioactive, and antioxidant potential of these underutilized grains.
Keywords: Pseudocereals, Germination, Soaking, Anti-nutrients, Antioxidant activity, Phenolic components
Graphical abstract
Highlights
-
•
Pseudocereals were found to be a rich source of nutritional and bioactive components.
-
•
Processing treatments (soaking and germination) were found effective in improving the nutritional as well as bioactive components.
-
•
The anti-nutrients such as tannin and phytic acid contents decreased significantly thereby enhancing the nutritional potential of these underutilized grains.
1. Introduction
Pseudocereals are dicotyledonous gluten-free grains and are considered as a substitute to true cereals. Amaranth (Amaranthus hypochondriacus; family Amaranthaceae), buckwheat (Fagopyrum esculentum; family Polygonaceae), and quinoa (Chenopodium quinoa sub sp. quinoa; family Chenopodiaceae) are well-known pseudocereals used expansively worldwide. Due to their high starch content, pseudocereals can be used like other cereals for the preparation of value-added food products (Li and Zhang, 2001; Thakur et al., 2021). Recently, pseudocereals have gained wide popularity among consumers because of their good quality proteins and their appropriateness for celiac patients. Moreover, these are also rich in dietary fiber and phenolic components, which are connected with their wide health benefits. Reports from various studies have shown that the flour of pseudocereals can be replaced with that of cereal for the preparation of functional and gluten-free food products (Alencar and de Carvalho Oliveira, 2019).
Despite being highly nutritious, these grains have limited bioavailability owing to the presence of anti-nutritional components such as tannins and phytic acid that bind with nutrients making them unavailable to our body. Numerous traditional processing techniques can be employed to increase the bioavailability of several micronutrients in these grains (Hotz and Gibson, 2007). Soaking and germination are the most commonly used techniques and can be treated as the simplest, cost-effective, and most commonly used techniques to improve the nutritional quality and to reduce the anti-nutritional components of food grains. Soaking is a domestic treatment used for the hydration of grains in water for a few hours (Embaby, 2010). Thus, it is quite useful in decreasing and eliminating the anti-nutritional components present in the food grains (Kajihausa et al., 2014; Singh et al., 2017). Numerous studies have described that soaking for 12–18 h is the most effective treatment to reduce the levels of anti-nutritional components such as proteolytic enzyme inhibitors as well as phytic acid, which are partly or wholly solubilized in soaked water (Embaby, 2010; Kajihausa et al., 2014). Germination follows subsequently the soaking where the soaked seeds are kept in a moist environment until they get sprouted. It results in enhancing the bio-active potential (Pal et al., 2016), as well as the sensory characteristics (Kuo and Faber Taylor, 2004) of germinated grains, and reduces the anti-nutritional components at the same time. Various researchers have described that 24–48 h of germination can successfully result in the augmentation of nutritional properties and reducing the anti-nutritional factors of grains (Urbano et al., 2005). Keeping in view the effectiveness of soaking and germination processing treatments in enhancing the nutritional as well as the bioactive potential of processed grains, the current study was designed to study the nutritional composition of pseudocereals as well as the effect of these treatments on nutritional, antinutritional, and bioactive components so as to enhance the nutritional composition of products to be prepared from pseudocereals. The use of these processing treatments for pseudocereals can be helpful in promoting the utilization of these underutilized grains.
2. Materials and methods
2.1. Materials
The different pseudocereals used in the present investigation were procured from different institutes and local markets. The amaranth (Durga cultivar) was procured from Punjab Agriculture University, Ludhiana, Punjab. Buckwheat (PRB-1 cultivar) was procured from the National Bureau of Plant Genetic Resources (NBPGR), Shimla, Himachal Pradesh, and white quinoa was procured from the local market of Sirmour district, Himachal Pradesh. The chemicals used in the present investigations were of ultrapure grade and purchased from standard manufacturers such as BDH chemicals, Qualigens, Merck India, Hi-Media, and Sigma.
2.2. Physico-chemical evaluation
Physico-chemical evaluation of raw pseudocereals (amaranth, buckwheat, and quinoa), as well as that of the soaked and germinated ones, was carried out at laboratories of the Department of Food Technology, Eternal University located at Sirmour, Himachal Pradesh, India.
2.2.1. Physical and functional parameters
Physical parameter like thousand-grain weights (TGW) was estimated as per the methods of AACC (2000). It was expressed as the weight of thousand grains in grams. Length, breadth, and thickness were measured with a Vernier caliper and expressed in mm. Bulk density (BD) was assessed by the method of Huang et al. (2005), tap density (TD) as per method given by Jones et al. (2000), water absorption capacity (WAC) by Sosulski (1962), Oil absorption capacity (OAC) by Kaur et al. (2015) and water solubility index (WSI) by Stojceska et al. (2008). For BD, grains were filled up to 25 ml in a 50 ml measuring cylinder, and grains were then weighed. For tap density, the bottom of the measuring cylinder was tapped gently on a smooth surface to fill grains properly. Bulk as well as tap density was calculated by the ratio of the weight of the sample to the volume of these grains and expressed in g/cm3.
2.2.2. Chemical parameters
Moisture content was determined as per the air-oven drying method of AOAC (1990). The crude fiber content was accessed using Fibroplus FBS 08P (Pelican Inc.), crude protein contents by Kjeloplus Kjelodist CAS VA (Pelican Inc.), crude fat by Soxoplus SPS 06 AS (Pelican Inc.), and ash contents, as per the method defined by Ranganna (1986). The total carbohydrate contents of the samples were determined by difference and calculated by subtracting the measured crude fat, crude protein, ash content, crude fiber, and moisture content from 100. The calorific value was estimated based on the contents of fats, crude protein (N × 6.25), and carbohydrates using the Atwater factors of 9.10, 4.0, and 4.2 KCal/g of each component, respectively (WHO, 1973). Mineral contents such as manganese, copper, zinc, and iron were estimated as per AOAC (1990) using Atomic Absorption Spectrometer (AA240FS, Agilent Technology, CA, USA). The antioxidant activity (%) was evaluated quantitatively based on free radical scavenging activity of 2,2-diphenyl-1-picrylhydrazyl (DPPH) radical according to the method described by Bouaziz et al. (2008), and tannins (%) as per the method of Saxena et al. (2013). The extraction and quantification of phytic acid in the biofortified wheat derivatives was evaluated by Gao et al. (2007), with minor modifications. Total Phenolic contents (mg GAE/100g) were estimated using Folin-Ciocalteu reagent as per the method of Ainsworth and Gillespie (2007) with slight modifications.
2.2.3. Processing treatments
The soaking and germination of grains were done as per the method used by Egli et al. (2002). Amaranth, buckwheat, and quinoa were cleaned manually to remove foreign objects and soaked in distilled water in the ratio of 1:5. Soaking was done for 12 and 24 h at room temperature and oven-dried at 40 °C for 24 h. Soaked grains were packed and stored at 4 °C for further analysis. The pseudocereals were soaked and subjected to germination treatment by dividing into several groups according to different germination treatments. The 30g seeds in each treatment were cleaned and steeped in 120 ml water in a beaker covered with muslin cloth for 16 h in the dark at ambient conditions. The steeped seeds were drained off and were covered with moist muslin cloth for germination. Germination was carried out in an incubator at 24, 48, and 72 h at 25 °C. The seeds were sprinkled periodically with water during germination to keep the muslin cloth wet. Seeds germinated after each treatment were dried at 40 °C in a hot air oven for 24 h. Germinated and dried pseudocereals were packed and stored at 4 °C in air-tight sealable packets until further analysis.
2.2.4. Statistical analysis
Data was assessed using one-way analysis of variance (ANOVA) using IBM SPSS Statistics 26 software. All samples were analyzed in triplicate and values entered in tables were expressed as mean ± Standard Deviation (SD) and differences were considered significant at the level of p ≤ 0.05.
3. Results and discussion
The pseudocereals after processing treatments and further drying were subjected to physicochemical analysis. The results of analytical studies carried out on raw and processed grains are discussed under the following headings.
3.1. Physical properties
Data related to the physical characteristics of processed grains is presented in Fig. 1, Fig. 2. TGW varied significantly (p ≤ 0.05) from 0.90 g (amaranth) to 22.09 g (buckwheat). Pandey et al. (2015) reported a TGW of 23.92 g in buckwheat which was comparable with the values observed in the present study. The TGW of amaranth (0.90g) was within the range of 0.55–1.04 g as reported by Gimplinger et al. (2007). Variation in TGW of different grains of pseudocereals may be associated with varietal characteristics which are influenced by the size of the grains. Larger grains contain more edible portions because of large endosperm (Cheik et al., 2006). Dimensional characteristics such as length varied significantly (p ≤ 0.05) from 1.12 (amaranth) to 5.30 mm (buckwheat), width from 1.22 (amaranth) to 3.83 mm (buckwheat), and thickness from 1.29 (amaranth) to 2.90 mm (buckwheat). BD and TD of different pseudocereals varied significantly (p ≤ 0.05) from 0.56 to 0.78 g/cm3 and 0.62–0.78 g/cm3, respectively. BD was lowest for buckwheat (0.56 g/cm3) and highest for amaranth (0.78 g/cm3). Similarly, TD was lowest for buckwheat (0.62 g/cm3) and highest for quinoa (0.82 g/cm3). According to Sindhu et al. (2019), BD of amaranth was 0.82 g/cm3 whereas, Di Cairano et al. (2020) reported the BD of amaranth, buckwheat, and quinoa as 0.57, 0.69, and 0.54 g/ml.
Fig. 1.

Physical and functional characteristics of raw pseudocereals
(a)- L-Length (mm), W-Width (mm), T-Thickness (mm), TGW-Thousand grain weight, BD-Bulk density (g/ml), TD-Tap density (g/ml), WAC- Water absorption Capacity (%), OAC-Oil absorption capacity (%), WSI-water solubility index (%). (b) SC-Swelling capacity (%).
Fig. 2.

Projections of the variables on the factor plane.
3.2. Functional properties
The water absorption capacity (WAC) of different pseudocereals varied significantly (p ≤ 0.05) from 1.15 to 1.48 ml/g (Fig. 1). WAC was recorded lowest in amaranth (1.15 ml/g) and the highest in buckwheat (1.48 ml/g). Di Cairano et al. (2020) reported similar results concerning the WAC of pseudocereals. They found WAC in amaranth, buckwheat, and quinoa as 1.22, 1.45, and 1.27 g/g. WSI and OAC varied significantly (p ≤ 0.05) from 6.58 (buckwheat) to 7.11% (amaranth) and 1.63 ml/g (amaranth) to 2.83 ml/g (quinoa), respectively. Di Cairano et al. (2020) reported the WSI in amaranth as 10.22 g/100 g and in buckwheat as 6.22 g/100 g. Kaur et al. (2015) reported that WAC and OAC have been found to enhance the sensory scores of gluten-free biscuits owing to the improvement of functional characteristics. The swelling capacity (SC) of pseudocereals varied significantly (p ≤ 0.05) from 26.67 (buckwheat) to 225% (amaranth). The swelling capacity of amaranth grains was reported as 2.54 ml/g by Singh and Punia (2020) while that of buckwheat as 14.77% by Tanwar et al. (2019).
3.3. Nutritional characteristics
The moisture and fat content of raw ingredients varied significantly (p ≤ 0.05) from 10.31 (amaranth) to 11.56% (buckwheat) and 1.40 (buckwheat) to 6.39% (quinoa), respectively. Collar and Angioloni (2014) reported the moisture content of amaranth grains as 12.31% and that of buckwheat as 13.86%. Bertazzo et al. (2011) reported 4.5–8.8% crude fat in different cultivars of quinoa. There was a significant (p ≤ 0.05) difference in fiber content of all pseudocereals and values varied significantly (p ≤ 0.05) from 3.83 (amaranth) to 7.55% (buckwheat). Li and Zhang (2001) reported crude fiber in buckwheat as 10.9 g/100 g and Njoki et al. (2014) as 6.6% in amaranth. Ash content varied significantly (p ≤ 0.05) from 1.66 (buckwheat) to 2.32% (amaranth). Collar and Angioloni (2014) found ash content of 1.59% in amaranth and 1.67% in buckwheat. The protein content of pseudocereals varied significantly (p ≤ 0.05) from 14.59 (buckwheat) to 17.40% (amaranth) in pseudocereals. The results obtained are within the range of 12.5–17.6% as reported by Mburu et al. (2012) in amaranth and 8.51–18.87% as reported by Gimenez-Bastida and Zielinski (2015) in buckwheat. Carbohydrate content and calorific value of raw ingredients varied significantly (p ≤ 0.05) from 60.12% (quinoa) to 63.23% (buckwheat) and 336.70 (buckwheat) to 373.61 Kcal/100g (amaranth). Bertazzo et al. (2011) also found carbohydrates in the range of 59–70% in buckwheat and 54.1–64.2% in quinoa.
3.4. Phenolic content and antioxidant activity
Phenolic content ranged from 32.68 to 210.31 mg GAE/100g. It was reported highest (210.31 mg GAE/100g) in buckwheat and lowest (32.68 mg GAE/100g) in amaranth. Alvarez-Jubete et al. (2010) reported phenolic content of 323 mg GAE/100g in buckwheat and 21.2 mg GAE/100g in amaranth. Antioxidant activity ranged from 18.75 (amaranth) to 46.41% (quinoa) in pseudocereals. Gorinstein et al. (2007) found the antioxidant activity of 24–26.2% in different cultivars of amaranth and 30% in quinoa seeds.
3.5. Anti-nutritional properties
Tannin contents varied significantly (p ≤ 0.05) from 0.048 (quinoa) to 0.222% (buckwheat). Gorinstein et al. (2008) reported a tannin content of 0.322% in buckwheat and 0.05% in quinoa seeds which were comparable with the findings in the present study. Phytic acid content ranged from 1.03% (quinoa) to 1.15% (amaranth). Similar results have been observed by Egli et al. (2002). They reported a phytic acid content of 1.39% in amaranth and 0.97% in quinoa.
3.6. Mineral contents
Pseudocereals are rich sources of micronutrients, including minerals. Copper (Cu) content ranged from 6.10 (buckwheat) to 8.88 mg/kg (amaranth). Iron (Fe) content varied significantly (p ≤ 0.05) from 67.88 to 127.92 mg/kg. Amaranth contained the highest amount (127.92 mg/kg) and the lowest was found in buckwheat (67.88 mg/kg). The values of manganese (Mn) content varied significantly (p ≤ 0.05) from 14.30 (quinoa) to 31.67 mg/kg (amaranth). Guardianelli et al. (2019) reported 9.4, 178, and 38 mg/kg of Cu, Fe, and Mn content, respectively in amaranth grains. Zinc (Zn) content ranged from 28.51 (buckwheat) to 69.82 mg/kg (quinoa). Pongrac et al. (2016) reported 23.1 mg/kg of zinc and 54.3 mg/kg iron content in buckwheat which was comparable with the present study.
4. Principal component analysis
Principal component analysis (PCA) of all analytical variables was done using Minitab 16 statistical software. The results obtained are presented in Fig. 1 and Table 2.
Table 2.
Principal Component analysis and loading of first four components.
| Factor Number | 1 | 2 | 3 | 4 |
|---|---|---|---|---|
| Initial Eigen values | 18.986 | 6.014 | 0.000 | 0.000 |
| % of variance | 75.9 | 24.1 | 0.000 | 0.000 |
| Cumulative % | 75.9 | 100 | 100 | 100 |
| Factor Loadings | ||||
| Moisture (%) | −0.229 | −0.027 | −0.220 | 0.008 |
| Fat (%) | 0.194 | −0.219 | 0.139 | −0.253 |
| Fibre (%) | −0.228 | −0.047 | −0.074 | −0.026 |
| Ash (%) | 0.228 | −0.043 | −0.102 | 0.129 |
| Protein (%) | 0.194 | 0.218 | 0.010 | −0.008 |
| Carbohydrate (%) | −0.193 | 0.221 | −0.113 | −0.118 |
| Calorific Value (Kcal/100g) | 0.220 | −0.117 | 0.096 | 0.166 |
| Anti-oxidant activity (% inhibition) | −0.074 | −0.386 | 0.034 | −0.074 |
| Tannin (%) | −0.206 | 0.178 | 0.041 | 0.311 |
| Phytic acid (%) | 0.058 | 0.394 | −0.095 | 0.221 |
| Total Phenolic content (mg GAE/100g) | −0.220 | 0.116 | −0.182 | 0.005 |
| Thousand grain weight (g) | −0.220 | 0.118 | −0.072 | 0.009 |
| Bulk density (g/ml) | 0.225 | 0.082 | 0.298 | −0.218 |
| Tap density(g/ml) | 0.225 | −0.077 | −0.222 | −0.121 |
| WAC (%) | −0.228 | 0.049 | 0.074 | −0.222 |
| WSI (%) | 0.218 | 0.129 | 0.050 | −0.092 |
| OAC (%) | −0.131 | −0.334 | 0.069 | −0.140 |
| Length (mm) | −0.226 | 0.067 | −0.034 | −0.367 |
| Width (mm) | −0.228 | 0.046 | −0.098 | −0.056 |
| Thickness (mm) | −0.220 | 0.116 | −0.138 | −0.223 |
| Swelling capacity (%) | 0.224 | 0.093 | −0.141 | −0.067 |
| Cu (mg/kg) | 0.198 | 0.206 | −0.007 | −0.021 |
| Fe (mg/kg) | 0.229 | −0.008 | −0.513 | −0.504 |
| Zn (mg/kg) | 0.045 | −0.400 | −0.547 | 0.370 |
| Mn (mg/kg) | 0.146 | 0.315 | −0.286 | 0.049 |
Using the Kaiser criterion, the first three principal components (PCs), with Eigen values greater than one (18.99 & 6.014) were extracted (Table 1). The first four principal components accounted for more than 100% of the variation in the analyzed samples. The first (PC1), second (PC2), third (PC3), and fourth (PC4) principal components explained 75.9, 100, 100, and 100% of the variance, respectively. Out of the four main components obtained, the first component explained 75.9% of the variance, which was mostly dominated by Fe shown in bold in Table 1. The second component was dominated by Mn while bulk density dominated the third component and the last component was dominated by zinc. Therefore, in the present study, most of the minerals were important variables that were capable of discriminating as compared to other chemical properties. Fig. 2 showed that all samples on the upright of PC1 were linked to ash while other samples positioned on its upleft were linked to carbohydrates and tannins. Thus, minerals could be used to distinguish the samples from each other.
Table 1.
Nutritional composition of raw pseudocereals.
| Parameters | Amaranth | Buckwheat | Quinoa |
|---|---|---|---|
| Moisture (%) | 10.31 ± 0.19c | 11.56 ± 0.07a | 10.84 ± 0.40b |
| Fat (%) | 5.35 ± 0.30b | 1.40 ± 0.20c | 6.39 ± 0.22a |
| Fibre (%) | 3.83 ± 0.28c | 7.55 ± 0.10a | 5.56 ± 0.26b |
| Ash (%) | 2.32 ± 0.11a | 1.66 ± 0.10c | 2.15 ± 0.03b |
| Protein (%) | 17.40 ± 0.10a | 14.59 ± 0.27b | 14.94 ± 0.27b |
| Carbohydrate (%) | 60.79 ± 0.67b | 63.23 ± 0.29a | 60.12 ± 0.56b |
| Calorific Value (Kcal/100g) | 373.61 ± 1.60a | 336.70 ± 0.78c | 370.48 ± 0.68b |
| Anti-oxidant activity (% inhibition) | 18.75 ± 0.10c | 31.69 ± 0.68b | 46.41 ± 1.08a |
| Tannin (%) | 0.065 ± 0.006b | 0.222 ± 0.005a | 0.048 ± 0.006c |
| Phytic acid (%) | 1.15 ± 0.05a | 1.10 ± 0.01a | 1.03 ± 0.2b |
| Total Phenolic content (mg GAE/100g) | 32.68 ± 0.06c | 210.31 ± 0.28a | 48.07 ± 0.16b |
| Cu (mg/kg) | 8.88 ± 0.45a | 6.10 ± 0.13b | 6.55 ± 0.05b |
| Fe (mg/kg) | 127.92 ± 0.10a | 67.88 ± 0.58c | 107.17 ± 0.87b |
| Zn (mg/kg) | 30.50 ± 0.18b | 28.51 ± 0.76b | 69.82 ± 1.59a |
| Mn (mg/kg) | 31.67 ± 0.56a | 18.00 ± 0.46b | 14.30 ± 1.02c |
Values in the table are presented as mean ± SD; Values within rows sharing the same letters are not significantly different according to Duncan's LSD post hoc analysis at p ≤ 0.05.
5. Effect of soaking and germination on nutritional and anti-nutritional components
The pseudocereal grains after soaking and germination treatments were subjected to physico-chemical analysis to study the effect of processing treatments on nutritional and anti-nutritional components. The results obtained after physicochemical analysis of amaranth, buckwheat, and quinoas are depicted, respectively in Table 3, Table 4, Table 5 and explained under the following headings.
Table 3.
Effect of Soaking and germination at different time intervals on nutritional and anti-nutritional components of amaranth.
| Parameters | Time interval (h) |
|||||
|---|---|---|---|---|---|---|
| Soaking |
Germination |
|||||
| 0 | 12 | 24 | 24 | 48 | 72 | |
| Moisture (%) | 10.31 ± 0.19a | 10.14 ± 0.08ab | 10.10 ± 0.10b | 10.09 ± 0.01b | 9.95 ± 0.05bc | 9.79 ± 0.10c |
| Fat (%) | 5.35 ± 0.30a | 5.33 ± 0.09a | 4.23 ± 0.28c | 4.65 ± 0.11b | 3.68 ± 0.06d | 2.58 ± 0.24e |
| Fibre (%) | 3.83 ± 0.28d | 3.89 ± 0.07d | 3.93 ± 0.05d | 4.43 ± 0.10c | 5.35 ± 0.15b | 6.69 ± 0.36a |
| Ash (%) | 2.32 ± 0.11a | 2.27 ± 0.21ab | 2.24 ± 0.12ab | 2.16 ± 0.02ab | 2.15 ± 0.01ab | 2.09 ± 0.04b |
| Protein (%) | 17.40 ± 0.10d | 17.63 ± 0.10cd | 17.86 ± 0.18bc | 17.98 ± 0.10b | 18.39 ± 0.18a | 18.62 ± 0.10a |
| Carbohydrate (%) | 60.79 ± 0.67b | 61.64 ± 0.05a | 61.61 ± 0.26a | 60.71 ± 0.16b | 60.77 ± 0.47b | 60.68 ± 0.62b |
| Calorific Value (Kcal/100g) | 373.61 ± 1.60b | 377.93 ± 0.47a | 368.75 ± 2.01c | 369.21 ± 0.58c | 362.31 ± 1.73d | 352.78 ± 0.42e |
| Anti-oxidant activity (% inhibition) | 18.75 ± 0.10f | 19.47 ± 0.37e | 20.77 ± 0.16d | 23.70 ± 0.41c | 30.91 ± 0.60b | 35.15 ± 0.27a |
| Tannin (%) | 0.065 ± 0.006a | 0.059 ± 0.001ab | 0.056 ± 0.001bc | 0.053 ± 0.001cd | 0.051 ± 0.001d | 0.044 ± 0.002a |
| Phytic acid (%) | 1.15 ± 0.05a | 1.13 ± 0.01ab | 1.10 ± 0.01bc | 1.08 ± 0.01c | 0.98 ± 0.01d | 0.81 ± 0.01e |
| Total Phenolic content (mg GAE/100g) | 32.68 ± 0.06f | 45.67 ± 0.31e | 53.00 ± 1.87d | 58.34 ± 0.19c | 68.35 ± 0.49b | 74.06 ± 0.58a |
| Cu (mg/kg) | 8.88 ± 0.45d | 9.02 ± 0.03d | 9.50 ± 0.05c | 9.65 ± 0.10c | 10.05 ± 0.05b | 10.60 ± 0.08a |
| Fe (mg/kg) | 127.92 ± 0.45d | 132.92 ± 0.45c | 135.25 ± 0.09b | 135.40 ± 0.05ab | 135.70 ± 0.05ab | 135.83 ± 0.05a |
| Zn (mg/kg) | 30.50 ± 0.18f | 31.70 ± 0.05e | 32.87 ± 0.13d | 33.32 ± 0.16c | 33.66 ± 0.09b | 34.65 ± 0.08a |
| Mn (mg/kg) | 31.67 ± 0.21d | 32.05 ± 0.17c | 32.17 ± 0.08c | 32.38 ± 0.03b | 32.55 ± 0.05ab | 32.70 ± 0.05a |
Values in the table are presented as mean ± SD; Values within rows sharing the same letters are not significantly different according to Duncan's LSD post hoc analysis at p ≤ 0.05.
Table 4.
Effect of soaking and germination at different time intervals on nutritional and anti-nutritional components of Buckwheat.
| Parameters | Time interval (h) |
|||||
|---|---|---|---|---|---|---|
| Soaking |
Germination |
|||||
| 0 | 12 | 24 | 24 | 48 | 72 | |
| Moisture (%) | 11.56 ± 0.07a | 9.64 ± 0.27b | 9.09 ± 0.76b | 6.53 ± 0.35d | 7.49 ± 0.22c | 7.84 ± 0.14c |
| Fat (%) | 1.40 ± 0.20a | 1.25 ± 0.17ab | 1.24 ± 0.05ab | 1.20 ± 0.05ab | 1.18 ± 0.02b | 1.15 ± 0.03b |
| Fibre (%) | 7.55 ± 0.10d | 7.63 ± 0.09d | 7.37 ± 0.33d | 9.92 ± 0.05c | 10.92 ± 0.05b | 12.92 ± 0.05a |
| Ash (%) | 1.66 ± 0.10a | 1.40 ± 0.10a | 1.43 ± 0.06a | 1.59 ± 0.09a | 1.57 ± 0.19a | 1.45 ± 0.28a |
| Protein (%) | 14.59 ± 0.27e | 15.00 ± 0.10d | 15.12 ± 0.10d | 16.11 ± 0.18c | 16.87 ± 0.10b | 17.46 ± 0.20a |
| Carbohydrates (%) | 63.23 ± 0.29c | 65.07 ± 0.26b | 65.76 ± 0.43a | 64.65 ± 0.68b | 61.98 ± 0.18d | 59.19 ± 0.12e |
| Calorific value (Kcal/100g) | 336.70 ± 0.78c | 344.68 ± 1.56b | 347.92 ± 1.57a | 346.92 ± 1.81a | 338.49 ± 0.31c | 328.88 ± 0.73d |
| Antioxidant activity (% inhibition) | 31.69 ± 0.68e | 52.53 ± 0.76d | 55.46 ± 1.03c | 86.78 ± 0.21b | 87.77 ± 0.06ab | 88.22 ± 0.54a |
| Tannin (%) | 0.222 ± 0.005a | 0.194 ± 0.004b | 0.103 ± 0.015c | 0.099 ± 0.002cd | 0.093 ± 0.001cd | 0.089 ± 0.001d |
| Phytic acid (%) | 1.32 ± 0.01a | 1.29 ± 0.01b | 1.24 ± 0.01c | 1.22 ± 0.01d | 1.12 ± 0.01e | 1.09 ± 0.01f |
| TPC (mg GAE/100g) | 210.31 ± 0.28a | 251.87 ± 1.78b | 280.81 ± 1.81c | 341.24 ± 0.28d | 390.39 ± 1.57e | 473.87 ± 0.87f |
| Cu (mg/kg) | 6.10 ± 0.13f | 9.82 ± 0.06e | 11.87 ± 0.08d | 12.77 ± 0.20c | 13.53 ± 0.33b | 15.48 ± 0.20a |
| Fe(mg/kg) | 67.88 ± 0.58e | 68.76 ± 1.01e | 74.47 ± 0.56d | 96.80 ± 0.39c | 110.28 ± 2.80b | 134.18 ± 0.08a |
| Zn (mg/kg) | 28.51 ± 0.76f | 30.79 ± 0.25e | 34.86 ± 0.59d | 39.86 ± 0.59c | 42.76 ± 0.77b | 46.02 ± 0.48a |
| Mn (mg/kg) | 18.00 ± 0.46f | 19.77 ± 0.15e | 20.62 ± 0.53d | 21.62 ± 0.50c | 23.20 ± 0.28b | 24.25 ± 0.15a |
Values in the table are presented as mean ± SD; Values within rows sharing the same letters are not significantly different according to Duncan's LSD post hoc analysis at p ≤ 0.05.
Table 5.
Effect of soaking and germination at different time intervals on the nutritive value of Quinoa.
| Parameters | Time interval (h) |
|||||
|---|---|---|---|---|---|---|
| Soaking |
Germination |
|||||
| 0 | 12 | 24 | 24 | 48 | 72 | |
| Moisture (%) | 10.84 ± 0.40a | 10.72 ± 0.10a | 10.54 ± 0.41a | 9.71 ± 0.22b | 8.47 ± 0.16c | 8.34 ± 0.24c |
| Fat (%) | 6.39 ± 0.22a | 6.35 ± 0.05a | 6.28 ± 0.07a | 5.72 ± 0.21b | 5.62 ± 0.20b | 5.15 ± 0.06c |
| Fibre (%) | 5.56 ± 0.26d | 5.80 ± 0.27d | 6.59 ± 0.18c | 6.66 ± 0.38c | 7.43 ± 0.34b | 8.50 ± 0.16a |
| Ash (%) | 2.15 ± 0.03a | 2.10 ± 0.05ab | 2.04 ± 0.05bc | 1.99 ± 0.04cd | 1.92 ± 0.06d | 1.90 ± 0.07d |
| Protein (%) | 14.94 ± 0.27d | 15.45 ± 0.68cd | 15.74 ± 0.43c | 16.14 ± 0.47bc | 16.82 ± 0.10b | 17.88 ± 0.09a |
| Carbohydrate (%) | 60.12 ± 0.56a | 59.58 ± 0.44ab | 59.09 ± 1.12ab | 59.78 ± 1.21ab | 59.74 ± 0.38ab | 58.32 ± 0.25b |
| Calorific Value (Kcal/100g) | 370.48 ± 0.68a | 369.86 ± 1.47ab | 367.19 ± 1.41abc | 367.64 ± 1.32bc | 369.32 ± 2.15c | 363.34 ± 0.70d |
| Anti-oxidant activity (% inhibition) | 46.41 ± 1.08e | 48.02 ± 0.33d | 50.99 ± 1.12c | 57.41 ± 0.16b | 61.95 ± 0.26a | 62.60 ± 0.27a |
| Tannin (%) | 0.048 ± 0.006a | 0.042 ± 0.002b | 0.041 ± 0.001b | 0.037 ± 0.001c | 0.036 ± 0.001c | 0.035 ± 0.001c |
| Phytic acid (%) | 1.03 ± 0.2a | 1.01 ± 0.01a | 0.97 ± 0.01b | 0.82 ± 0.01c | 0.68 ± 0.01d | 0.54 ± 0.01e |
| Total Phenolic content (mg GAE/100g) | 48.07 ± 0.16f | 54.45 ± 0.25e | 56.59 ± 0.19d | 65.41 ± 0.22c | 69.11 ± 0.17b | 82.47 ± 0.19a |
| Cu (mg/kg) | 6.55 ± 0.05f | 7.08 ± 0.08e | 7.73 ± 0.08d | 8.25 ± 0.09c | 8.60 ± 0.09b | 8.87 ± 0.08a |
| Fe (mg/kg) | 107.17 ± 0.87e | 108.10 ± 0.05e | 134.82 ± 0.19d | 139.82 ± 0.19c | 150.82 ± 0.81b | 155.61 ± 0.83a |
| Zn (mg/kg) | 69.82 ± 1.59f | 73.15 ± 0.20e | 79.98 ± 0.40d | 82.63 ± 0.33c | 84.80 ± 0.28b | 88.47 ± 0.10a |
| Mn (mg/kg) | 14.30 ± 0.30c | 14.58 ± 0.54bc | 15.23 ± 0.12abc | 15.43 ± 0.50ab | 15.58 ± 0.08a | 16.2 ± 0.05a |
Values in the table are presented as mean ± SD; Values within rows sharing the same letters are not significantly different according to Duncan's LSD post hoc analysis at p ≤ 0.05.
5.1. Nutritional characteristics
The changes in physicochemical characteristics of pseudocereals were observed after soaking for 12 h (S12), 24 h (S24), and germination for 24 h (G24), 48 h (G48), and 72 h (G72). The moisture and fat content of amaranth varied significantly (p ≤ 0.05) from 9.79 to 10.31% and 2.58–5.35%, respectively. There was a significant (p ≤ 0.05) decrease in moisture content of grains subjected to soaking as well as germination treatments and further drying in a hot air oven. The moisture content was highest in raw grains (RG) (10.31%), but decreased to 9.79% after 72 h of germination. There was a 5.04% decrease in moisture content in samples germinated for 72 h. Cornejo et al. (2019) reported a decrease in moisture content in different cultivars of amaranth after germination treatment. Fat content decreased significantly (p ≤ 0.05) from 5.35% (RG) to 2.58% (G72). There was a 51.77% decrease in fat content after germination. Similar reductions were observed by Sindhu et al. (2019) during the germination of amaranth and quinoa. They observed a 46.08% decrease in fat content after 48 h of germination treatment. In the case of buckwheat, there was a significant (p ≤ 0.05) change in the moisture content of grains, and values decreased from 11.56 (RG) to 6.53% (G24). The values for fat content in buckwheat grains decreased significantly (p ≤ 0.05) from 1.40 (RG) to 1.15% (G72). Shreeja et al. (2021) reported a 17.67% reduction in fat content in buckwheat grains after germination for 48 h. In quinoa, the moisture and fat content of quinoa reduced significantly (p ≤ 0.05) from 10.84% (RG) to 8.34% (G72) and 6.39% (RG) to 5.15% (G72), respectively. There was a 19.41% reduction in fat content after germination treatment. Jan et al. (2017) observed a significant reduction in fat content in two cultivars of quinoa after the 48 h of germination. This decline in fat content can be due to its use as a source of energy during germination. According to Chauhan et al. (2015) and Xu et al. (2017), this reduction in fat content could be due to the increased lipolytic activity during germination that hydrolyzed the fat components and provided the essential energy for growth activities in the seed.
The fiber content in amaranth grains increased significantly (p ≤ 0.05) from 3.83 (RG) to 6.69% (G72) after soaking and germination. There was a 74.67% increase in fiber content after the germination process. De Ruiz and Bressani (1990) reported an 85% increase in crude fiber content after germination for 72 h and associated it to the loss of dry matter resulting from enzymatic hydrolysis of starch and significant (p ≤ 0.05) increase in the cellular structures like lignin, cellulose, and hemicelluloses during the germination. Similarly, in buckwheat, the values for fiber content increased significantly (p ≤ 0.05) from 7.55% (RG) to 12.92% (G72). There was a 71.13% increase in fiber content after the germination of buckwheat grains for 72 h. Shreeja et al. (2021) reported a 56.52% increase in fiber contents after 48 h of germination. The fiber content in quinoa increased significantly (p ≤ 0.05) from 5.56% (RG) to 8.50% (G72), resulting in a 52.88% increase when compared to the fiber content of raw grains. Jan et al. (2017) observed 28.87% increases in fiber content in quinoa grains germinated for 48 h and reported it to be due to structural modification of polysaccharides in the cell wall of the seeds, and disruption of the protein-carbohydrate interaction. This process involved increased cell wall biosynthesis resulting in the manufacture of new dietary fiber. According to Nkhata et al. (2018), the loss of dry matter resulting from hydrolysis of starch with enzymes activated during germination and breakdown of cellular materials such as fats, proteins, and carbohydrates by microorganisms could explain the increase in fiber contents observed in the germination process. Also, Giami (1993) reported a similar enhancement in crude fiber contents during germination of cowpea grains and ascribed it to be due to the synthesis of more cell wall materials to support the shoots and rootlets.
The ash and protein content of amaranth varied significantly (p ≤ 0.05) from 2.09 to 2.32% and 17.40–18.62%, respectively. There was non-significant (p ≤ 0.05) decreases in ash content after the germination process. The crude proteins increased significantly (p ≤ 0.05) from 17.40% (RG) to 18.62% (G72). There was a 7.01% increase in protein content after germination for 72h. Sindhu et al. (2019) reported a 4.81% increase in crude protein content of amaranth grain after germination for 48 h. According to Hejazi and Orsat (2016), the increase in protein content has been ascribed to the release of packed protein in the seed structure when the α-amylase breaks down the starch granule during germination. Due to increased α-amylase activity during germination, there is a breakdown of the starch granule leading to the release of packed protein in the seed structure, resulting in increased protein content of germinated grains (Hejazi and Orsat, 2016). Narsih and Harijono (2012) stated that the increased activity of protease enzyme during germination caused the breakdown of peptide components to amino acids resulting in the increased protein content of germinated grains.
In the case of buckwheat, a non-significant decrease (1.66–1.45%) in ash content was observed after the germination process. Protein contents increased significantly (p ≤ 0.05) from 14.59 (RG) to 17.46% (G72) in buckwheat. There was a 19.67% increase in protein contents in buckwheat after the germination process. Shreeja et al. (2021) reported a 21.72% increase in protein contents after 48 h of germination. Zhang et al. (2015) stated that during germination, there was activation of many enzymes involved in protein synthesis through a series of biochemical reactions. In quinoa, there was a slight but non-significant decrease in ash content and values increased from 2.15 to 1.90%. Uwaegbute et al. (2000) and Chinma et al. (2009) stated that reduction in ash content during germination could be due to leaching out of some water-sensitive soluble minerals during soaking.
There was a significant (p ≤ 0.05) increase in crude protein content from 14.94% (RG) to 17.88% (G72), resulting in a 19.68% increase in protein content after 72 h of germination. Jan et al. (2017) reported a 15.98–17.76% increase in crude protein In different cultivars of quinoa after the germination of 48 h. Bertazzo et al. (2011) associated it with the biological synthesis of new amino acids and losses of dry matter, particularly the carbohydrates, through respiration during the germination process.
Carbohydrate content and calorific value of amaranth varied significantly (p ≤ 0.05) from 60.68 (G72) to 61.64% (S12) and 352.78 Kcal/100g (G72) to 377.93 Kcal/100g (S12). Germination facilitated the conversion of complex carbohydrates into simple sugars by activation of enzymes like α-amylase resulting in improved digestibility (Oghbaei and Prakash, 2016) and release of energy for growth activities in the seed (Zhang et al., 2015). In buckwheat, there was a significant (p ≤ 0.05) decrease in carbohydrates and calorific value of germinated grains. The reduced calorific value may be associated with a lower content of carbohydrates in germinated grains. Similar to amaranth and buckwheat, there was a decrease in the values for carbohydrate and calorific value of quinoa after the germination process. The values for carbohydrate contents decreased significantly (p ≤ 0.05) in quinoa from 60.12% (RG) to 58.32% (G72) to and from 370.48 (RG) to 363.34 (G72) Kcal/100g, respectively. It may be associated with the lower content of carbohydrates in germinated grains as compared to raw grains.
5.2. Phenolic content and antioxidant activity
In the case of amaranth, phenolic content increased significantly (p ≤ 0.05) from 32.68 GAE/100g (RG) to 74.06 mg GAE/100g (G72). There was a 126.62% increase in phenolic substances after 72 h of germination. Cornejo et al. (2019) reported a 212.98% increase in phenolic content during germination of amaranth grains for 24 h. Phenolic content in buckwheat varied significantly (p ≤ 0.05) from 210.31 mg GAE/100g (RG) to 473.98 mg GAE/100g (G72). There was a 125.32% increase in phenolic contents after 72 h of germination. Results are comparable with the findings of Zhang et al. (2015), who reported a 177.89% increase in phenolic contents after 72 h of germination in buckwheat. In quinoa, the phenolic components increased significantly (p ≤ 0.05) from 48.07 (RG) to 82.47 mg GAE/100g (G72). There was a 71.56% increase in phenolic content after germination of quinoa for 72 h. Alvarez-Jubete et al. (2010) found a 105.02% increase in phenolic content after 82 h of germination in quinoa seeds. Olawoye and Gbadamosi (2017) stated that this increase in the phenolic compounds can be associated with de novo biosynthesis of the phytochemicals due to increased activity of phenylalanine ammonia-lyase (PAL) enzyme during germination.
There was an 87.47% increase in antioxidant activity in amaranth grains after the germination process and grains germinated for 72 h were observed to have the highest antioxidant activity (35.15%) and it was recorded lowest in RG (18.75%). Alvarez-Jubete et al. (2010) observed 38.27% increases in antioxidant activity during germination for 98 h. Acosta-Estrada et al. (2014) stated that this increment in antioxidant activity during germination is linked to the release of phenolic components from cell walls or interaction between protein and starch components of the seed. Similarly, there was a significant (p ≤ 0.05) increase in the antioxidant activity of buckwheat after germination. The values increased from 31.69% (RG) to 88.22% (G72) contributing to a 178.38% increase in antioxidant activity after germination. Zhang et al. (2015) reported a 287.66% increase in antioxidant activity after 72h of germination.
In the case of quinoa, the antioxidant activity increased significantly (p ≤ 0.05) from 46.41 (RG) to 62.60% (G72). There was a 34.88% increase in antioxidant activity and the results are comparable with the findings of Jan et al. (2017). They observed 26.51–29.08% increases in antioxidant activity during 48 h of germination in different cultivars of quinoa. Alvarez-Jubete et al. (2010) stated that this increase in antioxidant activity during the germination bioprocess might be the result of increased synthesis of phenolic compounds by the hydrolytic activity of endogenous enzymes. Chavan et al. (1989) stated that an increase in antioxidant activity during sprouting is one of the many metabolic changes that take place upon sprouting of seeds, mainly due to an increase in the activity of the endogenous hydrolytic enzymes.
5.3. Anti-nutritional components
In amaranth, the tannin content decreased significantly (p ≤ 0.05) from 0.065 (RG) to 0.044% (G72) resulting in a 32.31% reduction in tannin content after the germination of grains. Results are comparable with the findings of Siwatch et al. (2019), and Sindhu et al. (2019) who reported 36.25 and 56.96%, reduction in tannin content, respectively, after 48 h of germination. Shimelis and Rakshit (2007) reported a significant (p ≤ 0.05) decrease in tannins content during germination and reported it to be due to the leaching out of tannins in water during soaking. In amaranth, the phytic content decreased from 1.15% (RG) to 0.81% (G72). There was a 29.57% decrease in phytic acid content after the germination of grains for 72 h. Siwatch et al. (2019), observed a 36.43% decrease in phytic contents in germinated amaranth grains. Luo et al. (2014) hypothesized that phytic acids get reduced due to significant (p ≤ 0.05) enhancement in activity of phytase enzyme during germination leading to increased availability of minerals.
In buckwheat, the tannin content decreased from 0.222% (RG) to 0.089% (G72) leading to a 59.91% reduction after 72 h of germination. Saharan et al. (2002) stated that a decrease in tannin contents might be due to hydrophobic bonding between polyphenolic compounds with organic substances like proteins or carbohydrates present in the seed. Similarly, the values for phytic content decreased significantly (p ≤ 0.05) from 1.32% (RG) to 1.09% (G72). There was a 17.42% decrease in phytic content after the germination process. Zhang et al. (2015) found a 16.84% reduction of phytic content during the germination of buckwheat grain for 72 h. They associated it with the increased phytase activity, resulting in the hydrolysis of phytic acid to myoinositol and phosphoric acid.
In quinoa, the tannin contents decreased from 0.048% (RG) to 0.035(G72). There was a 27.08% reduction in tannin content. Modgil and Sood (2017) stated that the seed coat containing the tannin components gets ruptured during germination resulting in their losses. Moreover, new complex components are also formed and some losses are also due to the leaching of tannins in water during soaking. Similarly, the phytic acid contents reduced significantly (p ≤ 0.05) from 1.03% (RG) to 0.54% (G72). There was a 47.57% decrease in phytic acid content during the germination process of 72 h. Demir and Bilgiçli (2020) observed a similar decrease in phytic content (77.23%) during germination of grains for 72 h.
5.4. Mineral contents
Values for Zn content increased significantly (p ≤ 0.05) from 30.50 to 34.65 mg/kg after the soaking and germination treatment. The highest zinc content (34.65 mg/kg) was observed in G72 and the lowest in RG (30.50 mg/kg). The Cu content increased from 8.88 (RG) to 10.60 mg/kg (G72), Fe from 127.92 (RG) to 135.83 mg/kg (G72), and Mn content from 31.67 (RG) to 32.70 mg/kg (G72) after the soaking and germination treatment. There was a 13.61, 19.37, 3.25, and 6.18% increase in zinc, copper, manganese, and iron content, respectively after 72 h of germination of amaranth grains. Results are comparable with the Guardianelli et al. (2019) who reported the increase in Zn, Cu, and Mn contents by 17.65, 7.45, and 5.26% respectively, after germination of amaranth grains.
In the case of buckwheat, a similar increase in mineral contents was observed after germination. The Cu content increased significantly (p ≤ 0.05) from 6.10 (RG) to 15.48 mg/kg (G72) after the soaking and germination treatments. The content of Fe changed significantly (p ≤ 0.05) from 67.88 mg/kg (RG) to 134.18 mg/kg (G72). Zinc contents increased significantly (p ≤ 0.05) from 28.51 (RG) to 46.02 mg/kg (G72) after the soaking and germination treatments. Similarly, values for Mn increased from 18 (RG) to 24.25 mg/kg (G72) after the soaking and germination treatments. An increase in copper, iron, zinc, and manganese contents was observed as 153.77, 97.67, 61.42, and 34.72% respectively, after the germination treatment. Pongrac et al. (2016) reported similar augmentation in mineral contents during germination. They observed a 124.44, 82.14, and 35.45% increase in copper, iron, and manganese content, respectively which was comparable with the present study.
In quinoa grains, there was a 26.15% increase in Cu content after germination. The values increased from 6.55% (RG) to 8.87 mg/kg (G72) after the soaking and germination treatments. Iron content increased from 107.17 mg/kg (RG) to 155.61 mg/kg (G72) and Zn from 69.82 (RG) to 88.47 mg/kg (G72) after the soaking and germination treatments. There was a 45.20 and 26.71% increase in iron and zinc content, respectively after the germination process. The results are comparable to the study carried out by Demir and Bilgiçli (2020) who reported an increase of 16.92% and 55.60% in iron and zinc content respectively during the germination of quinoa grains for 72 h. The values for Mn content increased from 14.30 (raw grain) to 16.2 mg/kg (G72) after the soaking and there was a 13.29% increase in manganese content after the germination process.
6. Conclusion
Chemical evaluation of pseudocereals concluded that these are rich sources of proteins, crude fibers, and minerals components. Processing treatments such as soaking and germination does not require complicated types of equipment rendering them a simple technique to improve the nutritional and sensory characteristics of pseudocereals. The processing treatments showed effective results to increase the nutritional components such as proteins, phenolic components, and antioxidant activity significantly. Germination resulted in significant (p ≤ 0.05) changes in the biochemical as well as nutritional compositions of pseudocereals, and the total nutritional value was improved. Due to the increased lipolytic activity during germination, fats get hydrolyzed resulting in decreased fat content of germinated grains. Germinated pseudocereals are excellent nutritional sources of crude protein, crude fiber, antioxidant activity, and phenolic compounds. Leaching of tannins during soaking and their further degradation during germination and significant (p ≤ 0.05) increase in the activity of enzyme phytase resulted in the reduction of anti-nutritional components, thereby increasing mineral availability. Therefore, the use of processing techniques can enhance the nutritional value and functionality of these underutilized grins and these can prove perfect food for gluten-challenged individuals suffering from celiac diseases.
CRediT authorship contribution statement
Priyanka Thakur: Investigation, Writing – original draft. Krishan Kumar: Conceptualization, Methodology, Writing – review & editing. Naseer Ahmed: Data curation. Divya Chauhan: Helped in, Investigation. Qurat Ul Eain Hyder Rizvi: Helped in, Investigation. Sumaira Jan: Helped in, Investigation. Tajendra Pal Singh: Helped in, Investigation. Harcharan Singh Dhaliwal: Supervision.
Declaration of competing interest
The authors declare the following financial interests/personal relationships which may be considered as potential competing interests: Dr. Krishan Kumar reports writing assistance was provided by Eternal University Dr. Khem Singh Gill Akal College of Agriculture.
Acknowledgements
The authors duly acknowledge the Ministry of Food Processing Industries (MoFPI) Govt. of India's grant for infrastructural facility development (F. No. 5–11/2010-HRD), and the Vice-Chancellor, Eternal University for providing the motivation and research infrastructure.
References
- AACC Approved methods of the American association of cereal chemists. Am. Assoc. Cereal Chem. 2000;1 [Google Scholar]
- Acosta-Estrada B.A., Gutiérrez-Uribe J.A., Serna-Saldívar S.O. Bound phenolics in foods, a review. Food Chem. 2014;152:46–55. doi: 10.1016/j.foodchem.2013.11.093. [DOI] [PubMed] [Google Scholar]
- Ainsworth E.A., Gillespie K.M. Estimation of total phenolic content and other oxidation substrates in plant tissues using Folin–Ciocalteu reagent. Nat. Protoc. 2007;2(4):875–877. doi: 10.1038/nprot.2007.102. [DOI] [PubMed] [Google Scholar]
- Alencar N., de Carvalho Oliveira L. Advances in Pseudocereals: crop cultivation, food application, and consumer perception. Bioac. Mol. Food. 2019:1695–1713. [Google Scholar]
- Alvarez-Jubete L., Wijngaard H., Arendt E., Gallagher E. Polyphenol composition and in vitro antioxidant activity of amaranth, quinoa buckwheat and wheat as affected by sprouting and baking. Food Chem. 2010;119(2):770–778. doi: 10.1016/j.foodchem.2009.07.032. [DOI] [Google Scholar]
- AOAC . vol. 1. 1990. p. 684. (Official Methods of Analysis). Washington, DC. [Google Scholar]
- Bertazzo A., Comai S., Brunato I., Zancato M., Costa C.V. The content of protein and non-protein (free and protein-bound) tryptophan in Theobroma cacao beans. Food Chem. 2011;124(1):93–96. doi: 10.1016/j.foodchem.2010.05.110. [DOI] [Google Scholar]
- Bouaziz M., Fki I., Jemai H., Ayadi M., Sayadi S. Effect of storage on refined and husk olive oils composition: stabilization by addition of natural antioxidants from Chemlali olive leaves. Food Chem. 2008;108(1):253–262. doi: 10.1016/j.foodchem.2007.10.074. [DOI] [Google Scholar]
- Chauhan A., Saxena D., Singh S. Total dietary fibre and antioxidant activity of gluten free cookies made from raw and germinated amaranth (Amaranthus spp.) flour. LWT - Food Sci. Technol. (Lebensmittel-Wissenschaft -Technol.) 2015;63(2):939–945. doi: 10.1016/j.lwt.2015.03.115. [DOI] [Google Scholar]
- Chavan J., Kadam S., Beuchat L.R. Nutritional improvement of cereals by sprouting. Crit. Rev. Food Sci. Nutr. 1989;28(5):401–437. doi: 10.1080/10408398909527508. [DOI] [PubMed] [Google Scholar]
- Cheik A.O., Aly S., Yaya B., Alfred T.S., et de la Terre V. A comparative study on nutritional and technological quality of fourteen (14) cultivars of pearl millets (Pennisetum glaucum (L) Leeke) in Burkina Faso. Pakistan J. Nutr. 2006;5(6):512–521. [Google Scholar]
- Chinma C.E., Adewuyi O., Abu J.O. Effect of germination on the chemical, functional and pasting properties of flour from brown and yellow varieties of tigernut (Cyperus esculentus) Food Res. Int. 2009;42(8):1004–1009. doi: 10.1016/j.foodres.2009.04.024. [DOI] [Google Scholar]
- Collar C., Angioloni A. Pseudocereals and teff in complex breadmaking matrices: impact on lipid dynamics. J. Cereal. Sci. 2014;59(2):145–154. doi: 10.1016/j.jcs.2013.12.008. [DOI] [Google Scholar]
- Cornejo F., Novillo G., Villacrés E., Rosell C.M. Evaluation of the physicochemical and nutritional changes in two amaranth species (Amaranthus quitensis and Amaranthus caudatus) after germination. Food Res. Int. 2019;121:933–939. doi: 10.1016/j.foodres.2019.01.022. [DOI] [PubMed] [Google Scholar]
- De Ruiz A.C., Bressani R. Effect of germination on the chemical composition and nutritive value of amaranth grain. Cereal Chem. 1990;67(6):519–522. [Google Scholar]
- Demir B., Bilgiçli N. Changes in chemical and anti-nutritional properties of pasta enriched with raw and germinated quinoa (Chenopodium quinoa Willd.) flours. J. Food Sci. Technol. 2020;57(10):3884–3892. doi: 10.1007/s13197-020-04420-7. [DOI] [PMC free article] [PubMed] [Google Scholar]
- Di Cairano M., Condelli N., Caruso M.C., Marti A., Cela N., Galgano F. Functional properties and predicted glycemic index of gluten free cereal, pseudocereal and legume flours. LWT - Food Sci. Technol. (Lebensmittel-Wissenschaft -Technol.) 2020;133:109860. doi: 10.1016/j.lwt.2020.109860. [DOI] [Google Scholar]
- Egli I., Davidsson L., Juillerat M., Barclay D., Hurrell R. The influence of soaking and germination on the phytase activity and phytic acid content of grains and seeds potentially useful for complementary feedin. J. Food Sci. 2002;67(9):3484–3488. doi: 10.1111/j.1365-2621.2002.tb09609.x. [DOI] [Google Scholar]
- Embaby H.E.S. Effect of heat treatments on certain antinutrients and in vitro protein digestibility of peanut and sesame seeds. Food Sci. Technol. Res. 2010;17(1):31–38. doi: 10.3136/fstr.17.31. [DOI] [Google Scholar]
- Gao Y., Shang C., Maroof M., Biyashev R., Grabau E., Kwanyuen P., Burton J., Buss G. A modified colorimetric method for phytic acid analysis in soybean. Crop Sci. 2007;47(5):1797–1803. doi: 10.2135/cropsci2007.03.0122. [DOI] [Google Scholar]
- Giami S.Y. Effect of processing on the proximate composition and functional properties of cowpea (Vigna unguiculata) flour. Food Chem. 1993;47(2):153–158. doi: 10.1016/0308-8146(93)90237-A. [DOI] [Google Scholar]
- Gimenez-Bastida J.A., Zielinski H. Buckwheat as a functional food and its effects on health. J. Agric. Food Chem. 2015;63(36):7896–7913. doi: 10.1021/acs.jafc.5b02498. [DOI] [PubMed] [Google Scholar]
- Gimplinger D., Dobos G., Schonlechner R., Kaul H. Yield and quality of grain amaranth (Amaranthus sp.) in Eastern Austria. Plant Soil Environ. 2007;53(3):105. [Google Scholar]
- Gorinstein S., Lojek A., Číž M., Pawelzik E., Delgado‐Licon E., Medina O.J., Moreno M., Salas I.A., Goshev I. Comparison of composition and antioxidant capacity of some cereals and pseudocereals. Int. J. Food Sci. Technol. 2008;43(4):629–637. doi: 10.1111/j.1365-2621.2007.01498.x. [DOI] [Google Scholar]
- Gorinstein S., Vargas O.J.M., Jaramillo N.O., Salas I.A., Ayala A.L.M., Arancibia-Avila P., Toledo F., Katrich E., Trakhtenberg S. The total polyphenols and the antioxidant potentials of some selected cereals and pseudocereals. Eur. Food Res. Technol. 2007;225(3):321–328. doi: 10.1007/s00217-006-0417-7. [DOI] [Google Scholar]
- Guardianelli L.M., Salinas M.V., Puppo M.C. Chemical and thermal properties of flours from germinated amaranth seeds. J. Food Meas. Charact. 2019;13(2):1078–1088. doi: 10.1007/s11694-018-00023-1. [DOI] [Google Scholar]
- Hejazi S.N., Orsat V. Malting process optimization for protein digestibility enhancement in finger millet grain. J. Food Sci. Technol. 2016;53(4):1929–1938. doi: 10.1007/s13197-016-2188-x. [DOI] [PMC free article] [PubMed] [Google Scholar]
- Hotz C., Gibson R.S. Traditional food-processing and preparation practices to enhance the bioavailability of micronutrients in plant-based diets. J. Nutr. 2007;137(4):1097–1100. doi: 10.1093/jn/137.4.1097. [DOI] [PubMed] [Google Scholar]
- Huang S., Shiau C., Liu T., Chu C., Hwang D.-F. Effects of rice bran on sensory and physico-chemical properties of emulsified pork meatballs. Meat Sci. 2005;70(4):613–619. doi: 10.1016/j.meatsci.2005.02.009. [DOI] [PubMed] [Google Scholar]
- Jan R., Saxena D., Singh S. Effect of germination on nutritional, functional, pasting, and microstructural properties of chenopodium (Chenopodium album) flour. J. Food Process. Preserv. 2017;41(3) doi: 10.1111/jfpp.12959. [DOI] [Google Scholar]
- Jones D., Chinnaswamy R., Tan Y., Hanna M. Physiochemical properties of ready-to-eat breakfast cereals. Cereal Foods World. 2000;45(4):164–168. [Google Scholar]
- Kajihausa O., Fasasi R., Atolagbe Y. Effect of different soaking time and boiling on the proximate composition and functional properties of sprouted sesame seed flour. Niger. Food J. 2014;32(2):8–15. doi: 10.1016/S0189-7241(15)30112-0. [DOI] [Google Scholar]
- Kaur M., Sandhu K.S., Arora A., Sharma A. Gluten free biscuits prepared from buckwheat flour by incorporation of various gums: physicochemical and sensory properties. LWT-Food Sci. Technol. 2015;62(1):628–632. doi: 10.1016/j.lwt.2014.02.039. [DOI] [Google Scholar]
- Kuo F.E., Faber Taylor A. A potential natural treatment for attention-deficit/hyperactivity disorder: evidence from a national study. Am. J. Publ. Health. 2004;94(9):1580–1586. doi: 10.2105/AJPH.94.9.1580. [DOI] [PMC free article] [PubMed] [Google Scholar]
- Li S.q., Zhang Q.H. Advances in the development of functional foods from buckwheat. Crit. Rev. Food Sci. Nutr. 2001;41(6):451–464. doi: 10.1080/20014091091887. [DOI] [PubMed] [Google Scholar]
- Luo Y.w., Xie W.H., Jin X.X., Wang Q., He Y.J. Effects of germination on iron, zinc, calcium, manganese, and copper availability from cereals and legumes. CyTA - J. Food. 2014;12(1):22–26. doi: 10.1080/19476337.2013.782071. [DOI] [Google Scholar]
- Mburu M., Gikonyo N., Kenji G., Mwasaru A. Nutritional and functional properties of a complementary food based on Kenyan amaranth grain (Amaranthus cruentus) Afr. J. Food Nutr. Sci. 2012;12(2):5959–5977. [Google Scholar]
- Modgil R., Sood P. Effect of roasting and germination on carbohydrates and anti-nutritional constituents of indigenous and exotic cultivars of pseudo-cereal (Chenopodium) J. Life Sci. 2017;9(1):64–70. doi: 10.1080/09751270.2017.1336020. [DOI] [Google Scholar]
- Narsih Y., Harijono The study of germination and soaking time to improve nutritional quality of sorghum seed. Int. Food Res J. 2012;19(4):1429–1432. [Google Scholar]
- Njoki J., Sila D., Onyango A. Impact of processing techniques on nutrient and anti-nutrient content of grain amaranth (A. albus) Food Sci. Qual. Manag. 2014;25:10–17. [Google Scholar]
- Nkhata S.G., Ayua E., Kamau E.H., Shingiro J.B. Fermentation and germination improve nutritional value of cereals and legumes through activation of endogenous enzymes. Food Sci. Nutr. 2018;6(8):2446–2458. doi: 10.1002/fsn3.846. [DOI] [PMC free article] [PubMed] [Google Scholar]
- Oghbaei M., Prakash J. Effect of primary processing of cereals and legumes on its nutritional quality: a comprehensive review. Cogent Food Agric. 2016;2(1):1136015. doi: 10.1080/23311932.2015.1136015. [DOI] [Google Scholar]
- Olawoye B.T., Gbadamosi S.O. Effect of different treatments on in vitro protein digestibility, antinutrients, antioxidant properties and mineral composition of Amaranthus viridis seed. Cogent Food Agric. 2017;3(1):1296402. doi: 10.1080/23311932.2017.1296402. [DOI] [Google Scholar]
- Pal R., Bhartiya A., ArunKumar R., Kant L., Aditya J., Bisht J. Impact of dehulling and germination on nutrients, antinutrients, and antioxidant properties in horsegram. J. Food Sci. Technol. 2016;53(1):337–347. doi: 10.1007/s13197-015-2037-3. [DOI] [PMC free article] [PubMed] [Google Scholar]
- Pandey S., Senthil A., Fatema K. Effect of hydrothermal treatment on the nutritional and functional properties of husked and dehusked buckwheat. J. Food Process. Technol. 2015;6(7):461–467. [Google Scholar]
- Pongrac P., Potisek M., Fraś A., Likar M., Budič B., Myszka K., Boros D., Nečemer M., Kelemen M., Vavpetič P. Composition of mineral elements and bioactive compounds in tartary buckwheat and wheat sprouts as affected by natural mineral-rich water. J. Cereal. Sci. 2016;69:9–16. doi: 10.1016/j.jcs.2016.02.002. [DOI] [Google Scholar]
- Ranganna S. Tata McGraw-Hill Education; 1986. Handbook of Analysis and Quality Control for Fruit and Vegetable Products. [Google Scholar]
- Saharan K., Khetarpaul N., Bishnoi S. Antinutrients and protein digestibility of fababean and ricebean as affected by soaking, dehulling and germination. J. Food Sci. Technol. 2002;39(4):418–422. [Google Scholar]
- Saxena V., Mishra G., Saxena A., Vishwakarma K. A comparative study on quantitative estimation of tannins in Terminalia chebula, Terminalia belerica, Terminalia arjuna and Saraca indica using spectrophotometer. Asian J. Pharmaceut. Clin. Res. 2013;6(3):148–149. [Google Scholar]
- Shimelis E.A., Rakshit S.K. Effect of processing on antinutrients and in vitro protein digestibility of kidney bean (Phaseolus vulgaris L.) varieties grown in East Africa. Food Chem. 2007;103(1):161–172. doi: 10.1016/j.foodchem.2006.08.005. [DOI] [Google Scholar]
- Shreeja K., Devi S.S., Suneetha W.J., Prabhakar B.N. Effect of germination on nutritional composition of common buckwheat (Fagopyrum esculentum Moench) Int. Res. J. Pure Appl. Chem. 2021:1–7. doi: 10.9734/irjpac/2021/v22i130350. [DOI] [Google Scholar]
- Sindhu R., Beniwal S.K., Devi A. Effect of grain processing on nutritional and physico-chemical, functional and pasting properties of amaranth and quinoa flours. Indian J. Tradit. Knowl. 2019;18(3):500–507. [Google Scholar]
- Singh A., Punia D. Characterization and nutritive values of amaranth seeds. Current J. Appl. Sci. Technol. 2020;39(3):27–33. [Google Scholar]
- Singh B., Singh J.P., Shevkani K., Singh N., Kaur A. Bioactive constituents in pulses and their health benefits. J. Food Sci. Technol. 2017;54(4):858–870. doi: 10.1007/s13197-016-2391-9. [DOI] [PMC free article] [PubMed] [Google Scholar]
- Siwatch M., Yadav R., Yadav B. Chemical, physicochemical, pasting and microstructural properties of amaranth (Amaranthus hypochondriacus) flour as affected by different processing treatments. Qual. Assur. Saf. Crop Foods. 2019;11(1):3–13. doi: 10.3920/QAS2017.1226. [DOI] [Google Scholar]
- Sosulski F. The centrifuge method for determining flour absorption in hard red spring wheats. Cereal Chem. 1962;39:344–350. [Google Scholar]
- Stojceska V., Ainsworth P., Plunkett A., İbanoğlu E., İbanoğlu Ş. Cauliflower by-products as a new source of dietary fibre, antioxidants and proteins in cereal based ready-to-eat expanded snacks. J. Food Eng. 2008;87(4):554–563. doi: 10.1016/j.jfoodeng.2008.01.009. [DOI] [Google Scholar]
- Tanwar B., Lamsal N., Goyal A., Kumar V. Functional and physicochemical characteristics of raw, roasted and germinated buckwheat flour. Asian J. Dairy Food Res. 2019;38(2):140–144. [Google Scholar]
- Thakur P., Kumar K., Dhaliwal H.S. Nutritional facts, bio-active components and processing aspects of pseudocereals: A comprehensive review. Food Biosci. 2021 doi: 10.1016/j.fbio.2021.101170. [DOI] [Google Scholar]
- Urbano G., Aranda P., Vılchez A., Aranda C., Cabrera L., Porres J.M., López-Jurado M.A. Effects of germination on the composition and nutritive value of proteins in Pisum sativum. L. Food Chemistry. 2005;93(4):671–679. doi: 10.1016/j.foodchem.2004.10.045. [DOI] [Google Scholar]
- Uwaegbute A., Iroegbu C., Eke O. Chemical and sensory evaluation of germinated cowpeas (Vigna unguiculata) and their products. Food Chem. 2000;68(2):141–146. doi: 10.1016/S0308-8146(99)00134-X. [DOI] [Google Scholar]
- WHO . WHO Technical Report Series no. 522 and FAO Nutrition Meeting Report Series no. 52. Geneva: World Health Organization; 1973. Energy and protein requirements. [PubMed] [Google Scholar]
- Xu L., Chen L., Ali B., Yang N., Chen Y., Wu F., Jin Z., Xu X. Impact of germination on nutritional and physicochemical properties of adlay seed (Coixlachryma-jobi L.) Food Chem. 2017;229:312–318. doi: 10.1016/j.foodchem.2017.02.096. [DOI] [PubMed] [Google Scholar]
- Zhang G., Xu Z., Gao Y., Huang X., Zou Y., Yang T. Effects of germination on the nutritional properties, phenolic profiles, and antioxidant activities of buckwheat. J. Food Sci. 2015;80(5):H1111–H1119. doi: 10.1111/1750-3841.12830. [DOI] [PubMed] [Google Scholar]