

SUMMARY
The gut microbiome exhibits extreme compositional variation between hominid hosts. However, it is unclear how this variation impacts host physiology across species and whether this effect can be mediated through microbial regulation of host gene expression in interacting epithelial cells. Here, we characterize the transcriptional response of human colonic epithelial cells in vitro to live microbial communities extracted from humans, chimpanzees, gorillas, and orangutans. We find that most host genes exhibit a conserved response, whereby they respond similarly to the four hominid microbiomes. However, hundreds of host genes exhibit a divergent response, whereby they respond only to microbiomes from specific host species. Such genes are associated with intestinal diseases in humans, including inflammatory bowel disease and Crohn’s disease. Last, we find that inflammation-associated microbial species regulate the expression of host genes previously associated with inflammatory bowel disease, suggesting health-related consequences for species-specific host-microbiome interactions across hominids.
Graphical abstract
In brief
Muehlbauer et al. investigate how variation between different hominid microbiomes drives host gene expression in colonic epithelial cell cultures. They find that host genes that respond only to microbiomes from a specific hominid species are linked to gastrointestinal diseases, suggesting implications for understanding how the microbiome can impact human health.
INTRODUCTION
The microbiome of the primate gastrointestinal tract plays an important role in host physiology and health. Extreme variation in the gut microbiome has been observed between healthy human individuals; this variation is even more pronounced between different species of great apes (Human Microbiome Project Consortium, 2012; Nishida and Ochman, 2019). Microbiome composition is strongly correlated with the species of the host, a pattern known as co-diversification. Within hominids and other nonhuman primates, co-diversification between host and microbial symbionts has led to overall microbiome composition clustering along the expected phylogenetic relationships of the host species, including bacterial, archeal, and eukaryotic groups within the gut microbiome (Ochman et al., 2010; Moeller et al., 2012; Raymann et al., 2017; Mann et al., 2020; Amato et al., 2019a. However, reports show that these phylogenetic constraints are flexible, depending on diet and subsistence strategy (Gomez et al., 2019). For example, compared with industrialized human groups, small scale rural or agricultural human populations share a greater number of gut microbiome traits with wild nonhuman primates (Gomez et al., 2019; Amato et al., 2019b.
Different hominid species harbor many of the same bacterial phyla in the gastrointestinal tract, but in varying abundances. For example, both the human and chimpanzee guts are primarily colonized by Bacteroidetes and Firmicutes, but the chimpanzee gut also harbors higher abundances of microbial phyla that are relatively rare in humans, including Actinobacteria, Euryarcheaota, Tenericutes, and Verrucomicrobia (Ochman et al., 2010; Nishida and Ochman, 2019). Gorillas, besides also displaying the presence of these rare taxa, harbor greater abundances of Chloroflexi, Tenericutes, and Fibrobacteres (Gomez et al., 2015, 2016b; Hicks et al., 2018). Although the orangutan microbiome has not been characterized as thoroughly, a previous report has shown that orangutan guts harbor higher diversity in archaeal lineages compared to other great apes, in addition to similar microbial phyla as gorillas and chimpanzees (Raymann et al., 2017; Delsuc et al., 2014). At lower microbial taxonomic levels, very different microbial species are present in human and chimpanzee microbiomes, resulting in greater divergence (Nishida and Ochman, 2019).
Overall gut microbiome composition is shaped by a combination of host genetics, host physiology, and environmental factors. Studies have shown that host genetic variation influences microbiome composition within humans, but has yet to be studied in other hominids (Blekhman et al., 2015; Goodrich et al., 2014). Among environmental influences, diet has a large impact on the primate gut microbiome (Nagpal et al., 2018; Hicks et al., 2018; Gomez et al., 2016b. Most non-human great ape species in the wild and in captivity subsist on a primarily plant-based diet of fruit and vegetation that is occasionally supplemented by animal protein, such as meat or insects (Vogel et al., 2015; Tutin and Fernandez, 1993; Watts et al., 2012). In contrast, human diets are usually omnivorous and highly variable depending on cultural influences, agricultural practices, geographic location, and individual dietary preferences (Wu et al., 2011; Lang et al., 2018). Other environmental factors that can influence microbiome composition between primates include variation in geography, seasonality, and other social behaviors such as grooming (Tung et al., 2015; Grieneisen et al., 2019). In addition, physiological differences between primate species, such as differences in gut morphology and digestive processes, also contribute to differences in microbiome composition Amato et al., 2019a. Although a large effort has been made to characterize the factors that influence variation in the microbiome, it is unclear how variation in microbiome composition between great ape species can impact relevant host phenotypes.
A likely mechanism by which the microbiome can affect host physiology is through regulating the expression of host genes in interacting intestinal epithelial cells (Luca et al., 2018; Richards et al., 2016, 2019). Studies in animal models have demonstrated that gut microbiota can drive changes in host gene expression by altering epigenetic programming, such as histone modification, transcription factor binding, and methylation (Qin et al., 2018; Camp et al., 2014; Pan et al., 2018; Krautkramer et al., 2016). For example, Camp et al. (2014) found that the microbiome drives the differential expression of transcription factors enriched in accessible binding sites. In addition, Pan et al. (2018) found that the microbiome can alter DNA methylation in the gut epithelial cells of mice. Moreover, in cell culture, inter-individual variation in microbiome composition can drive differential responses in host gene expression at the intestinal level (Richards et al., 2019). However, we do not know how interspecies variation in the microbiome affects gene regulation in host cells. When considering microbiota variation among great ape species and their influences on host gene expression, in vivo studies in experimental animal models are limited. Furthermore, in vivo experiments can be confounded by a multitude of factors, such as differences in diet between the animal model species and the primate species of interest, microbiota colonization history of the animal model, and inherent differences in the genetic backgrounds between the animal model and the primate species (Luca et al., 2018).
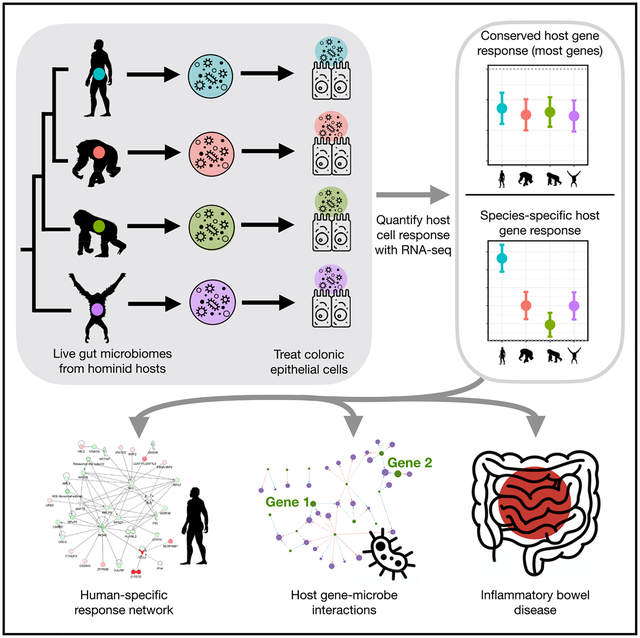
Here, we use an in vitro experimental system (Richards et al., 2019, 2016) to assess host gene expression changes in response to diverse gut microbiota from four great ape species: humans (Homo sapiens), and captive chimpanzees (Pan troglodytes), gorillas (Gorilla gorilla gorilla), and orangutans (Pongo abelii). We collected microbiomes from four humans, three chimpanzees, six gorillas, and three orangutans as biological replicates. In each of the non-human primate groups, one of the individuals donated two samples, bringing the total number of samples to four human, four chimpanzee, seven gorilla, and four orangutan samples. This experimental design allows us to determine causal relationships between gut microbiome composition and gene expression changes in colonic epithelial cells that are induced by the microbiome while controlling for potentially confounding environmental and technical effects (Richards et al., 2016, 2019). We have leveraged this design to ascertain how host genes respond to between-species variation in microbiome composition across hominids, characterize the function of host genes that respond to microbiota from each great ape species, and identify microbial taxa and pathways that likely drive expression of specific host genes.
RESULTS
To assess how host genes respond to variation in the microbiome, we extracted live microbiota from 19 fecal samples from 16 individuals from four hominid species (4 humans, 3 chimpanzees, 6 gorillas, and 3 orangutans), and treated human colonic epithelial cells (colonocytes) with the extracted microbiota using an experimental technique from a previously published method (Table S1) (Richards et al., 2016, 2019). Briefly, colonocytes are treated with live primate microbiota for 2 h, after which we quantify changes in gene expression in the colonocytes using RNA sequencing (RNA-seq) (Figure 1A; see STAR Methods). Additionally, we used 16S rRNA sequencing and shotgun metagenomics to characterize the composition of the microbiome in these samples. A principal coordinate analysis of Bray-Curtis dissimilarities shows that the microbiome samples do not change during the treatment, due to the short culturing time. Importantly, microbiome samples cluster by primate host species of origin (Figures 1B and S1A). This observation is consistent with previous findings showing that the phylogenetic relationship between primate host species is reflected in their microbiomes (Ochman et al., 2010), and indicates that interspecies microbiome distinctions between wild apes is maintained in the captive individuals included in our study. We note that in a comparison of our captive chimpanzees and gorillas samples with publicly available data from wild chimpanzees and gorillas (Campbell et al., 2020), we find that, as expected, captive microbiomes differ from their wild counterparts (Figure S1B). However, the clear clustering of the microbiomes used in our study by species (Figure 1B) indicates that strong interspecies distinctions in the gut microbiome persist in these captive individuals.
Figure 1. Experimental design and gut microbiome composition.

(A) Schematic of the experimental design. Live microbiomes were extracted from fecal samples from humans (n = 4, blue) chimpanzees (n = 4, orange), gorillas (n = 7, green), and orangutans (n = 4; purple), and were sequenced with metagenomic shotgun sequencing. Microbes were incubated with human colonic epithelial cells for 2 h, after which host response was profiled through RNA-seq on the epithelial cells, and the microbiome was profiled via 16S rRNA sequencing. See also Table S1.
(B) PCOA plot showing the Bray-Curtis dissimilarity of all the microbiome samples from all four primate species (represented by the same colors in A) at different stages of the experiment. Here, “Raw” refers to the microbiomes of raw fecal samples; “Prepared” refers to microbiome samples that have been prepared (see STAR Methods) but have not been cultured with colonocytes; “Colonocytes” refers to microbiomes after incubation with colonocytes; “Control” refers to microbiomes that have been incubated without colonocytes. See also Figure S1A.
(C) Relative abundances of microbial phyla from shotgun metagenomic sequencing for each hominid fecal sample, sequenced before being cultured with colonocytes. The legend on the right indicates the colors corresponding to each phylum. See also Figures S1B and S1C.
(D) Examples of microbial species (from shotgun metagenomics sequencing) with various patterns of abundance across hominid species. In each panel, the x axis indicates the primate host species, whereas the y axis indicates the relative abundance of the microbial species. Each dot represents the abundance of the microbial species in a hominid individual host. Bacteroides ovatus (top left) shows a high abundance in humans relative to the other hominid species. Phascolarctobacterium succinatutens is highly abundant in the non-human hominids but not present in the human microbiomes. Faecalibacterium prausnitzii is highly abundant in all four hominid species. Prevotella copri is highly abundant in chimpanzees and gorillas, has a lower abundance in orangutans, and is not present in the human samples. See also Figure S1C and Table S2.
The bacterial composition of the samples confirmed clear distinctions between hominid species at the phylum level (Figures 1C and S1C), with nine of the most abundant microbial phyla showing significantly different levels between hominid species (Table S2; Kruskal-Wallis test, Benjamini-Hochberg false discovery rate [FDR] <0.1). The human microbiome samples have a high relative abundance of Bacteroidetes and Firmicutes, which have both been previously identified as dominant phyla in the human gut (Human Microbiome Project Consortium, 2012; Turnbaugh et al., 2007). In addition, Actinobacteria abundance is significantly different between hominid species (Kruskal-Wallis test, Benjamini-Hochberg q-value = 0.00567; ANOVA, Benjamini-Hochberg q-value = 3.82 × 10⁻⁹), with chimpanzees showing the greatest abundance (see Figure 1C). Furthermore, we identified 21 microbial species that are differentially abundant between hominid host species (Table S2; Kruskal-Wallis, Benjamini-Hochberg FDR <0.1). Examples of several microbes that have variable abundance across species, including Bacteroides ovatus, which shows higher abundance in humans compared to other hominids; Phascolarctobacterium succinatutens, which shows lower abundance in humans compared to other hominids; and Prevotella copri, which has higher abundance in gorilla and orangutan, are shown in Figure 1D.
To characterize the host response to the microbiome, we used likelihood ratio tests combined with a negative binomial model (DESeq2) to identify host genes that change their expression after inoculation with microbiomes from the four hominid host species (see STAR Methods). We identified 4,329 host genes that respond to the microbiome of at least one hominid species (Figure 2A, Benjamini-Hochberg FDR <0.1). The majority of differentially expressed genes (2,261 genes, 52%) respond to the microbiomes of all four hominids (Figures 2A and 2B; Table S3, full dataset available; STAR Methods). Despite this overall consistent response, we find 164 host genes that respond in a species-specific manner; namely, respond to the microbiome of one hominid species but not the other three. For example, SHROOM3 responds to the human microbiome, but shows no response to the chimpanzee, gorilla, and orangutan microbiomes (Figure 2C). Similarly, B3GAT2, DUSP11, and DARS2 respond in a species-specific manner to the chimpanzee, gorilla, and orangutan microbiomes, respectively (Figure 2C). We also find 394 host genes that respond to microbiomes from two hominid species (e.g., CBR1 responds to orangutan and gorilla microbiomes) (Figure 2C). Likewise, 1,313 host genes respond to microbiomes from three hominid species, and 13,531 genes show no response to any of the hominid microbiomes (e.g., INVS) (Figure 2C).
Figure 2. Patterns of host gene expression change in response to hominid microbiome treatment.

(A) Heatmap showing the log2 fold change for all differentially expressed host genes (rows), grouped by expression pattern. Each row in the heatmap represents a host gene and each column represents one of the four hominid species. The colored bar on the right hand side indicates the hominid microbiome to which these genes respond (Benjamini-Hochberg FDR < 0.1). See also Table S13.
(B) UpSet plot visualizing the intersections among the sets of host genes that respond to hominid microbiomes. The x axis indicates the hominid species (or combination of hominid species) considered in the intersection and is represented by colored dots underneath the x axis (each color depicts a hominid species as in Figure 1). The y axis indicates the number of genes in the intersection. The bars in the lower left indicate the total number of differentially expressed genes by hominid species. For example, the leftmost bar shows that 2,261 genes are differentially expressed in response to microbiomes from all four hominid species, and the rightmost bar shows that 12 genes are differentially expressed in response to only orangutan microbiomes. See also Table S3.
(C) Examples of expression patterns of eight differentially expressed genes. Each panel represents a single host gene, labeled at the top of the plot. The x axis represents the four hominid species, and the y axis represents the log2 fold change in expression of the gene. Each dot represents the log2 fold change in response to the microbiomes of each hominid, with error bars indicating the SE. The gray dotted line is at zero and denotes no differential expression. See also Tables S3 and S13.
To understand how genes with a host species-specific response may interact with each other, we visualized interaction networks for differentially expressed host genes that respond to microbiomes from each hominid species (Krämer et al., 2014) (Ingenuity Pathway Analysis, https://www.qiagenbioinformatics.com) (Figures 3A, 3B, S2A, and S2B; STAR Methods). The most significant interaction network of host genes that respond only to human microbiomes is enriched with functional categories related to cancer, cell death and survival, and organismal injuries and abnormalities (Figure 3A; Table S4). This is consistent with previous studies showing that the microbiome may influence host disease through changes in host gene regulation, but also suggests that this effect may be specific to human microbiomes (Qin et al., 2018; Camp et al., 2014; Pan et al., 2018; Krautkramer et al., 2016). By comparison, the most significant interaction network of genes that respond specifically to orangutan microbiomes is enriched for functional categories related to carbohydrate metabolism, lipid metabolism, and small molecule biochemistry (Figure 3B; Table S4). This is consistent with the observation that orangutan diets, compared to that of gorillas or chimpanzees, could incorporate a greater proportion of ripe fruits and highly digestible/simple sugars in peak seasons (up to 100% dependence on fruit) (Remis, 1997; Taylor, 2006). In addition, previous reports point to a highly diverse archeal community in orangutans compared to other apes, which could be associated with an increased capacity to metabolize highly fermentable plant materials (Raymann et al., 2017). See Table S4 for functions enriched in the most significant networks for genes that respond only to gorilla microbiomes and only to chimpanzee microbiomes.
Figure 3. Interaction networks and functional enrichment categories for host genes responding to hominid gut microbiomes.
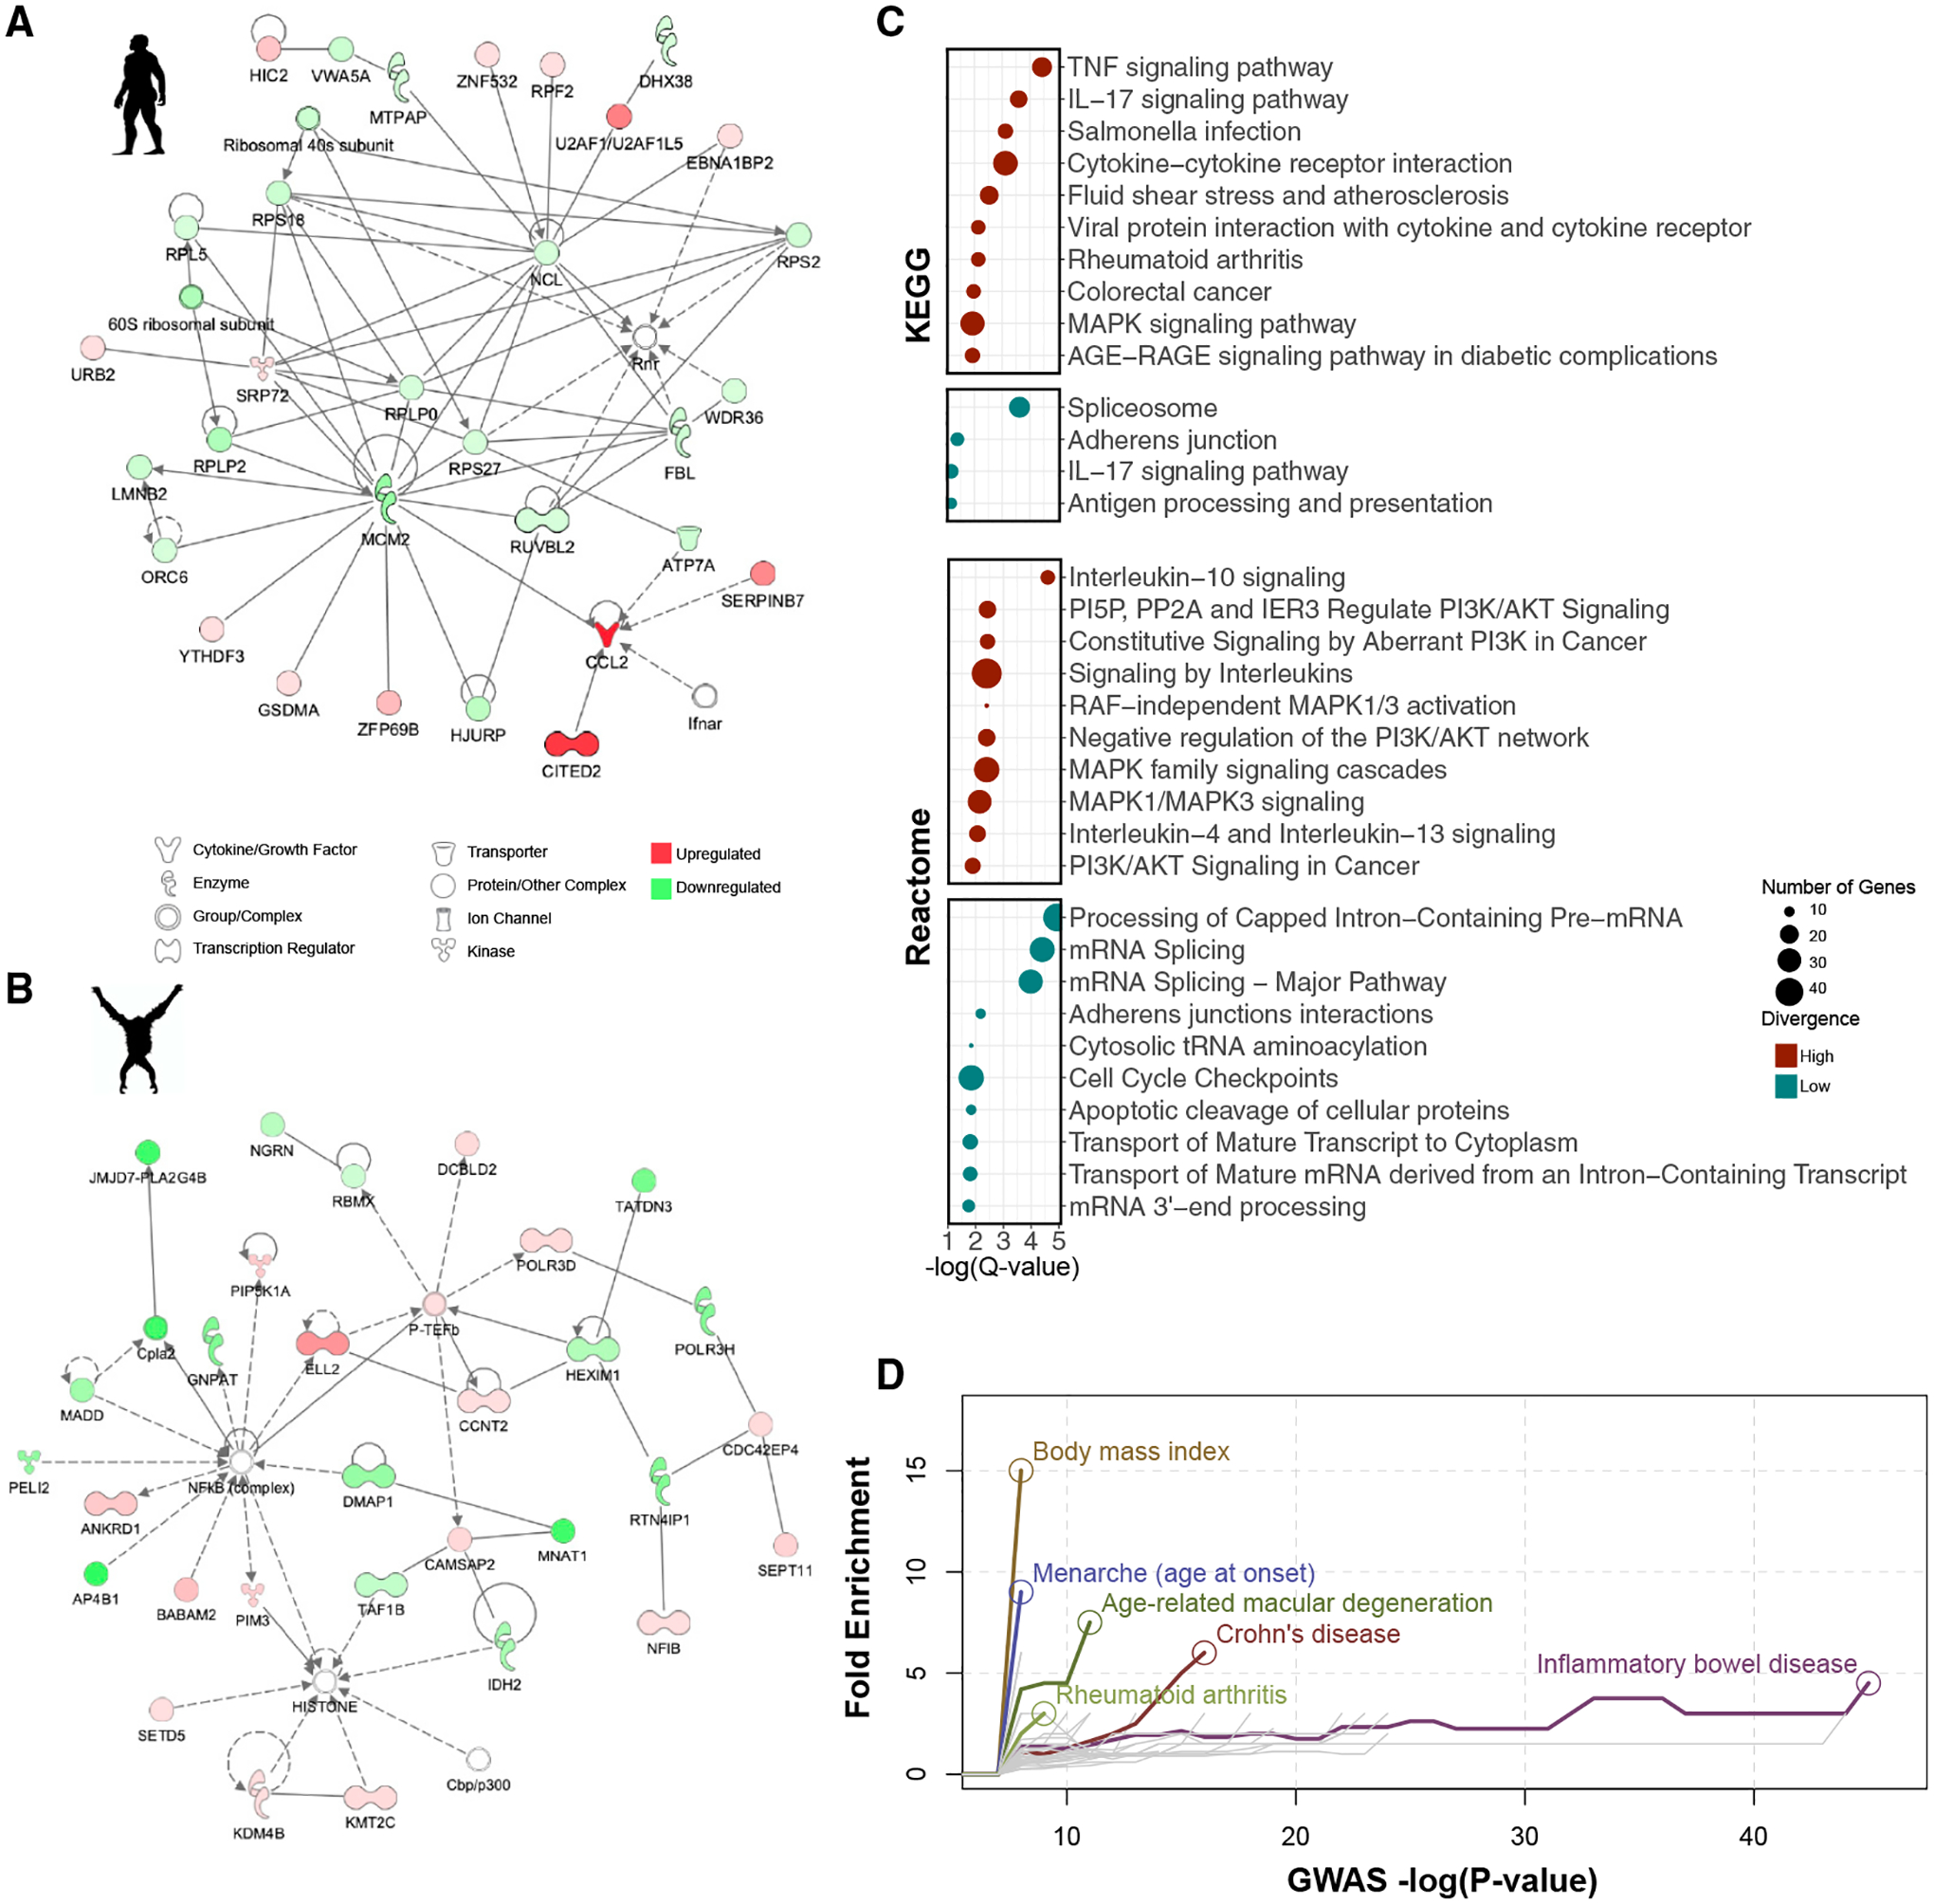
(A) Interaction network showing host genes that respond only to human microbiomes, generated using Ingenuity Pathway Analysis. Each node indicates a gene, and the color of the node indicates whether the gene is upregulated (red) or downregulated (green). The shape of each node represents a specific function as depicted in the legend. A line indicates a direct interaction, and a dashed line indicates an indirect interaction. See also Figure S2.
(B) Similar to (A), but with host genes that respond only to orangutan microbiomes.
(C) Functional categories in the KEGG (top) and Reactome (bottom) databases enriched among high-divergence genes (red) and low-divergence genes (blue). The x axis indicates the statistical significance of enrichment, and the circle size corresponds to the number of genes in each category, as shown in the legend (Benjamini-Hochberg FDR < 0.1). See also Figure S3 and Table S6.
(D) Complex disease enriched among genes that respond to hominid microbiomes. Fold enrichment (y axis) is shown for a given p value threshold (x axis) to define genes that are associated with each complex disease in the GWAS catalog. Each colored line represents a complex disease with a statistically significant enrichment after multiple test correction (using Fisher’s exact test, FDR < 0.1; see STAR Methods), with a circle indicating the most significant p value threshold. Diseases that did not reach significance are shown in gray lines.
To further characterize the biological functions represented by host genes that respond to variation in hominid microbiomes, we categorized differentially expressed genes into two groups: low-divergence genes, which show a similar magnitude and direction of response to the four hominid microbiomes, and high-divergence genes, which show a highly variable response to the four hominid microbiomes (following the approach of Hagai et al. [2018]) (Table S5; STAR Methods). We find that low-divergence genes, namely, differentially expressed genes that show a similar response to microbiomes from all four primate species, tend to be enriched for functions related to basic cell processes, such as RNA processing, cell cycle, and RNA metabolic processing (Figure 3C, Benjamini-Hochberg FDR <0.1; Table S6). This suggests that these genes are likely involved in basic host responses to bacterial cells, rather than response to specific microbial features. Interestingly, high-divergence genes, namely, genes that respond differently to the microbiomes from the four primate host species, tend to be enriched for categories related to disease, inflammation, and cancer (Figures 3C, S3A, and S3B). Of note, colorectal cancer, rheumatoid arthritis, and Salmonella infection functional categories are enriched among high-divergence genes and have all been associated with gut microbiome composition in previous studies (Dahmus et al., 2018; Scher and Abramson, 2011; Ferreira et al., 2011). Moreover, when considering host genes that have been previously associated with complex human traits through genome-wide association studies (GWAS) using data in the GWAS catalog (Buniello et al., 2019), we find that high-divergence genes are enriched with traits and diseases that have also been linked to the microbiome, such as Crohn’s disease (CD), inflammatory bowel disease (IBD), and body mass index (Figure 3D; STAR Methods). This might indicate that these complex disease phenotypes may be modulated by differences in composition of the gut microbial community through the regulation of these key host genes.
Next, we sought to identify genes whose response is directly correlated with the abundance of specific microbial taxa. To do so, we used mixed linear models that integrated host response transcriptomic data (via RNA-seq) and microbial species abundance information data (via shotgun metagenomics; see STAR Methods). We identified 25 microbial species that drive the expression of 80 differentially expressed host genes across the four hominids (Figure 4A; Table S7, 162 host gene-microbial taxon pairs in total, Benjamini-Hochberg FDR <0.05). A heatmap of the interactions reveals two roughly defined major clusters, one of which includes a subcluster of host genes that are downregulated by microbial taxa that are rare or absent in humans but present in the other hominids, such as Prevotella copri, Methanobrevibacter (unclassified), and Phascolarctobacterium succinatutens (highlighted in Figure 4A; also see Figure 1D for P. copri and P. succinatutens abundances across hominids). Genes that are downregulated in the presence of these microbial species are significantly enriched for several immune-related pathways, such as cytokine activity, interleukin (IL)-7 signaling, malaria, Legionellosis, and tumor necrosis factor (TNF) signaling (Table S8). Using a similar method, we identified 89 microbial pathways that drive the expression of 310 unique host genes for a total of 2,061 significant microbial pathway-host gene interactions (Benjamini-Hochberg FDR <0.05). For simplicity, we focused on the top 48 microbial pathways that drive the expression of the top 44 unique host genes (Figure 4B; Table S9), with a total of 216 microbial pathway-host gene pairs (examples of specific interactions can be found in Figure S4A). Clustering of this interaction data revealed three main clusters (I, II, and III), with genes in cluster II associated with pathways that are more abundant in humans compared to other hominid microbiomes. These host genes are enriched in functional categories related to inflammation and infectious disease, including Legionellosis, malaria, and pertussis, and overlap with genes found in the cluster described above in the species-level analysis (Table S10).
Figure 4. Relationship between host gene expression and specific microbiome features.
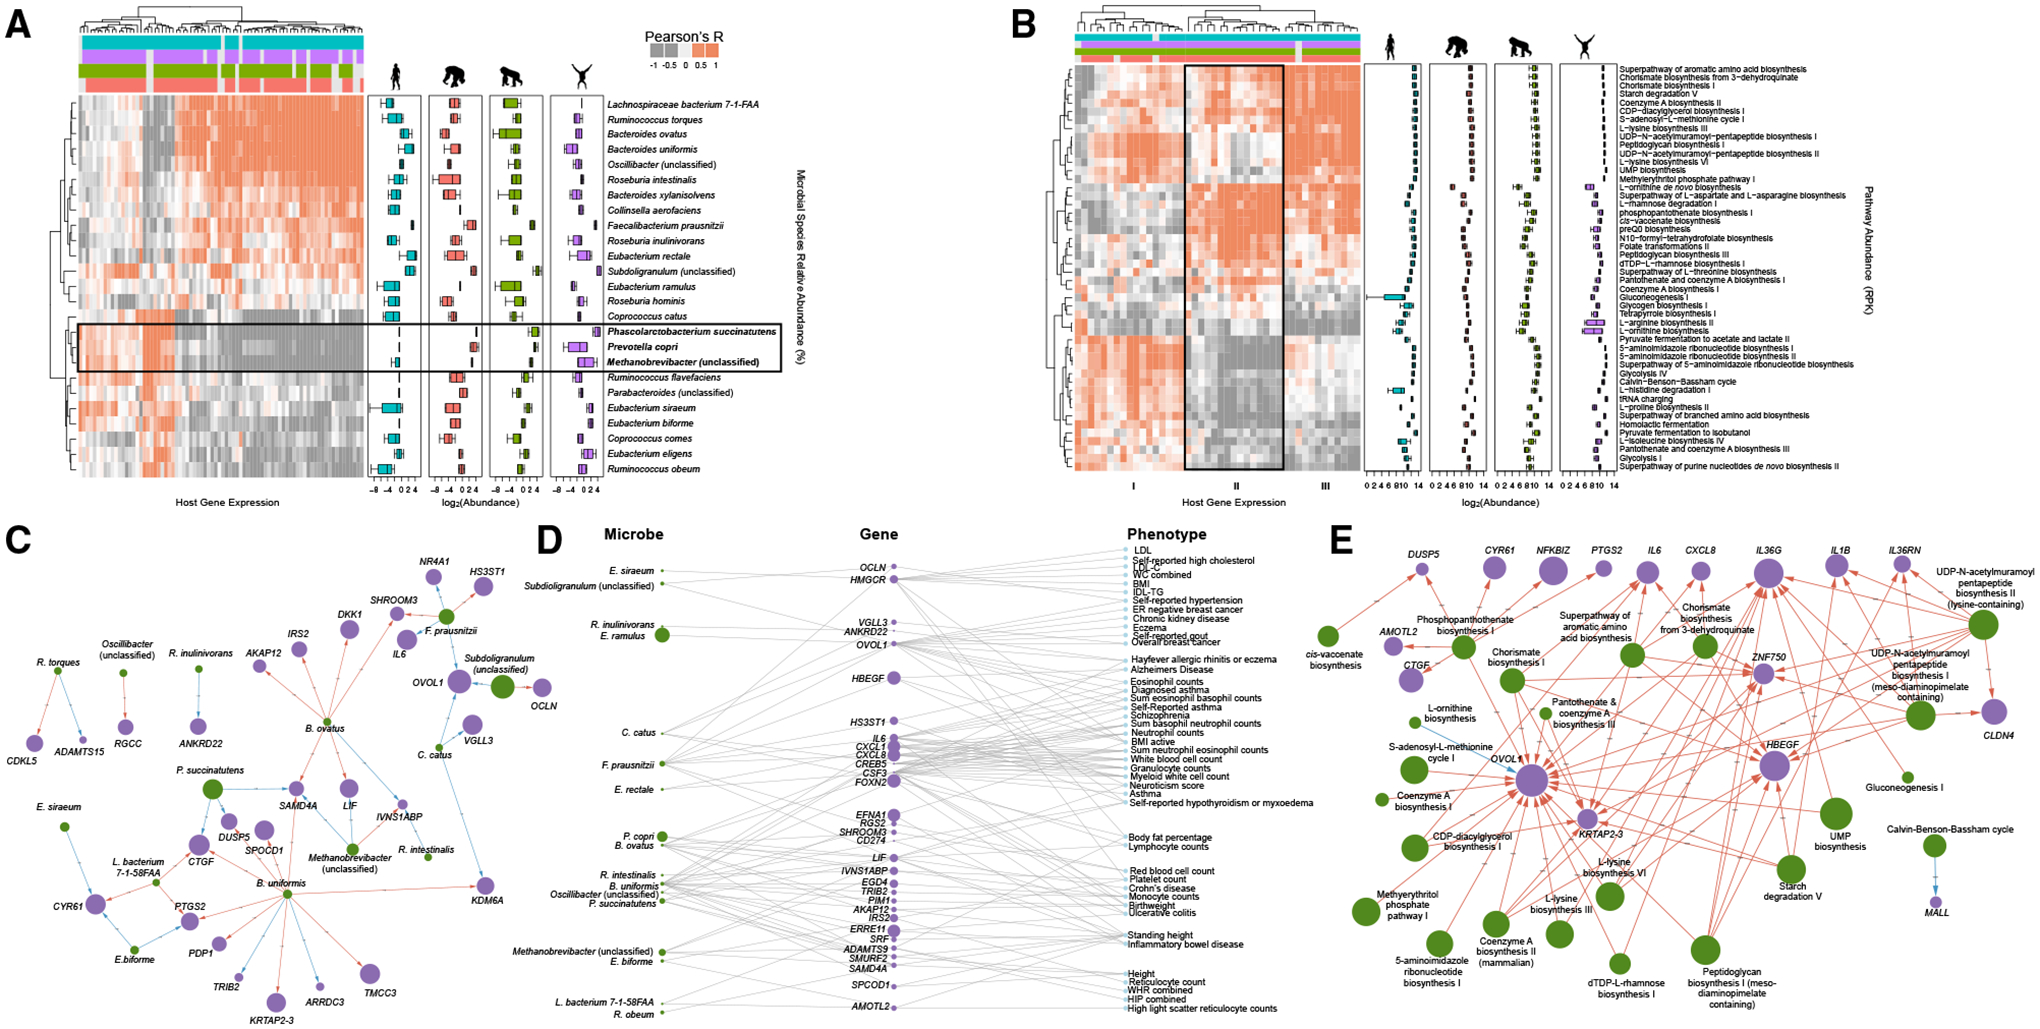
(A) Heatmap showing correlations between abundance of microbial species from metagenomics sequencing data (rows) and host gene expression response (columns) (Benjamini-Hochberg FDR < 0.05). The colored bars at the top indicate to which hominid microbiome (or combination of hominid microbiomes) a gene responds, with blue, orange, green, and purple bars depicting the human, chimpanzee, gorilla, and orangutan microbiomes, respectively. Boxplots to the right show the abundance of each microbial species in each hominid microbiome (microbial abundance transformed by log2) using the same color scheme. See also Figure S4 and Table S7.
(B) Similar to (A), but showing the abundance of microbial pathways instead of microbial species (Benjamini-Hochberg FDR < 0.05). See also Figure S4 and Table S9.
(C) Network visualization of high-divergence host genes (purple nodes) and microbial species (green nodes) to which these host genes respond (shown as arrows). The node size of microbial species corresponds to abundance, and the node size of host genes corresponds to log2 fold change of the differential expression in response to microbiome exposure. Arrow colors indicate whether a microbial species increases (blue) or decreases (red) the expression of the connected host gene. See also Table S8.
(D) Three-tier network showing microbial species (left column), the host genes they each regulate (middle column), and the TWAS phenotypes these genes are associated with (right column). Microbial species and host gene node size indicate microbial abundance and differential expression, respectively, correlated with high-divergence genes and TWAS phenotypes. See also Table S11.
(E) Similar to (C), but showing microbial pathways instead of microbial species. See also Table S10.
To investigate specific host gene-microbe interactions, we considered the network of all high-divergence host genes for which expression is driven by microbial species (28 host genes and 14 microbial species; Benjamini-Hochberg FDR <0.01). We find that certain microbial taxa are represented in highly connected nodes and likely control the regulation of several high-divergence host genes (Figure 4C). For example, two Bacteroides species, B. ovatus and B. uniformis, drive the expression of several host genes, including LIF and DUSP5 respectively, both of which have been previously associated with inflammation (Yue et al., 2015; Habibian et al., 2017). Bacteroides is a highly abundant microbial genus in the human gut and is known to have mixed effects on human health (Wexler, 2007). Notably, B. ovatus is highly abundant in the human microbiome samples, but is at low abundances in the orangutan gut microbiomes and entirely absent in the chimpanzee and gorilla microbiomes (Figure 1D, FDR <0.1).
To explore the possible phenotypic consequences of host genes for which expression is driven by certain microbial species, we integrated gene-trait associations identified through transcription-wide association study (TWAS). TWAS identifies associations between gene expression and complex traits by considering genetically predicted gene expression from expression quantitative trait locus (eQTL) studies and SNP-trait associations from GWAS. We considered genes implicated in 114 complex traits through Probabilistic TWAS (Zhang et al., 2020) and found that expression of 44 out of 57 high-divergence host genes is associated with 43 complex phenotypes (Figure 4D). These include diseases and phenotypes previously linked to the gut microbiome, including CD, IBD, ulcerative colitis, body mass index, body fat percentage, and schizophrenia (Figure 4D; Table S11). We found several microbial taxa that have higher abundance in the non-human microbiomes, including P. copri and P. succinatutens, which have previously been hypothesized to have protective effects, downregulate the expression of host gene LIF, which has been linked to ulcerative colitis, IBD, and CD in our TWAS analysis (Figures 4C and 4D) (De Vadder et al., 2016; Morgan et al., 2012). These results are consistent with findings from the enrichment analysis reported in Figures 3C and 3D, where we found phenotypes related to inflammation were driven by high-divergence genes. Furthermore, we find that Eubacterium rectale and B. ovatus, microbes that have higher abundance in humans and that have been previously associated with IBD (Zhang et al., 2017; Noor et al., 2010), upregulate the expression of CSF3, which has been reported as upregulated in ulcerative colitis patients (Hotte et al., 2012; de Lange and Barrett, 2015)
To investigate specific host gene-pathway interactions, we constructed a network of the most significant interactions between microbial pathways and high-divergence host genes as described above (Figure 4E; see STAR Methods). We find that nine of these 17 host genes, including DUSP5, CYR61, NFKBIZ, PTGS2, IL6, CXCL8, IL36G, IL1B, and IL36RN (all displayed at the top layer in Figure 4E) have been implicated in immune function or inflammation (Habibian et al., 2017; Emre and Imhof, 2014; Hörber et al., 2016; Müller et al., 2018; Cox et al., 2004; Rincon, 2012; Gales et al., 2013; Wang et al., 2017; Ren and Torres, 2009; Onoufriadis et al., 2011). We found that these genes are associated with several microbial pathways, including phosphopanthothenate biosynthesis I, chorismate biosynthesis, UDP-N-acetylmuramoyl pentapeptide biosynthesis II (lysine-containing), and UDP-N-acetylmuramoyl pentapeptide biosynthesis I (meso-diaminopimelate containing).
DISCUSSION
Interactions between hominid hosts and their microbiomes have been an underexplored area of research, and the complexity of the host-microbiome relationship makes identifying the specific microbial features that causally impact the host phenotype inherently challenging. Here, we use an in vitro model to assess how gut microbiomes from different host species impact gene regulation, which is a likely mechanism for microbes to drive changes in host phenotype and health. Inoculating host colonic epithelial cells with live gut microbiome communities from four great ape species, we find that most host genes are regulated similarly by microbiomes from all four hominid microbiomes. However, some host genes are regulated only by microbiomes from a single hominid; these genes are enriched with immunity functions and are involved in the development of IBD.
Chimpanzees, gorillas, and orangutans are our closest extant relatives, making these species an important study system for understanding human evolution as well as the genetic and environmental etiology of human-specific diseases. Distinct physiological, cognitive, and behavioral differences between primate species are hypothesized to be the result of changes in host gene regulation (Gilad et al., 2006; King and Wilson, 1975; Britten and Davidson, 1971; Enard et al., 2002). Indeed, studies have identified genes showing a species-specific expression pattern and genes for which regulation likely evolves under natural selection (Blekhman et al., 2008; Brawand et al., 2011). Here, we show that microbiomes of different hominid species elicit different gene expression responses in the same type of intestinal epithelial cells (human colonocytes). Although we show that most host genes respond to microbiomes from different hominids in a similar manner, we also identified genes that exhibit a species-specific response. Thus, it may be tempting to hypothesize that some of the species-specific differences in gene expression observed previously are driven by interactions with the gut microbiome. These species-specific microbiome-regulated host genes might facilitate host-specific adaptations to physiological or dietary constraints; for example, our analysis indicates that genes with a response to only orangutan microbiomes are enriched for carbohydrate metabolism, lipid metabolism, and small molecule biochemistry, which suggests that the interaction of the orangutan microbiome and colonic epithelial cells may aid in digestion of specific macronutrients, especially those associated with diets rich in high-energy, highly digestible plant sources (e.g., ripe fruit).
In addition to environmental adaptations, species-specific responses to the microbiota may indicate tightly controlled symbiotic relationships that may result in disease phenotypes when altered. We find that high-divergence genes—namely, genes that respond discordantly to microbiomes from different hominid species—are enriched for traits associated with disease, such as inflammation and aberrant apoptosis. This suggests that genes with a response highly sensitive to the variation across hominid microbiomes may possibly play a role in host disease traits. These genes are also significantly associated with relevant disease traits in the GWAS catalog and in our TWAS analysis, including CD and IBD. Significant distinctions exist in gut microbiome composition and diversity across apes with marked differences in subsistence strategies: for instance, industrialized human societies and primates in captivity have lower gut microbiome diversity and show higher incidences of noncommunicable diseases than small-scale human populations and wild non-human primates, respectively Gomez et al., 2016a; Clayton et al., 2016). Thus, one hypothesis is that these unique features of the microbiome are causal for the development of diseases common in humans living in industrialized areas, but not in non-industrialized human populations or in non-human wild primates, such as IBD. Our results are consistent with this hypothesis, and further suggest that a mechanism by which the microbiome can affect disease risk is through regulating the expression of host genes in interacting colonic epithelial cells. For example, we found that several microbes that have lower abundance in humans compared to the other hominids, including P. copri and P. succinatutens, downregulate the expression of the gene LIF, which has been associated with IBD (Figure S4B). This suggests that these microbes may confer a protective effect through regulation of host genes, and their absence in humans is possibly detrimental. Conversely, we found that microbes that have higher abundance in humans compared to the other hominids, including B. ovatus and E. rectale, upregulate the expression of CSF3, which has been associated with IBD (Figure S4B). This suggests that these microbes may have a human-specific pathogenic effect. Moreover, some of the genes we found to be regulated by the microbiome in a species-specific manner, such as IL1B, IL6, IL36G, IL36RN, and CXCL8, have been previously implicated in IBD (Schulze et al., 2008; Khor et al., 2011; Parisinos et al., 2018; Gijsbers et al., 2004; Russell et al., 2016; Müller et al., 2018), whereas others, such as DUSP5, CYR61, NFKBIZ, and PTGS2, have rules in immune response (Habibian et al., 2017; Emre and Imhof, 2014; Hörber et al., 2016; Cox et al., 2004).
In conclusion, we find that gut microbial communities from different hominids mostly elicit a conserved regulatory response in host cells, whereby most host genes respond similarly to hominid microbiomes. However, we also find that some host genes show a divergent response, and a number of host genes respond only to microbiomes from one hominid species and not the others. These genes are enriched in functional categories related to immunity and inflammation and are over-represented in pathways involved in autoinflammatory diseases, such as IBD and CD. These results represent an important step toward understanding the causal relationships between variation in the gut microbiome across hominids and the regulation of intestinal epithelial cells. We hope that future studies will expand on this work using organoid culture or animal models to understand microbial regulation of host genes in more complex systems. Moreover, we expect that testing specific isolates or manipulating the composition of the microbiome will allow characterizing the contribution of specific microbes to the development of disease through regulation of host genes.
Limitations of study
Our ability to interpret these results in a comparative evolutionary context is limited by the unavailability of colonocytes from the non-human hominids in the study. In addition, the non-human hominids in the study are all captive, and our comparison of these samples to publicly available data indicates that the captive chimpanzee and gorilla microbiomes in our study differ from their wild counterparts; nevertheless, the microbiomes used in this study still cluster by host species identity, and preserve clear between-species variation in microbiome composition. Another limitation of our analysis is that the taxonomic profiling of metagenomic shotgun sequencing data relies on databases that are biased toward microbes residing in human microbiomes and might impact our ability to detect and accurately quantify certain microbes in the non-human samples. Moreover, the in vitro approach used here represents a simplified version of the complex interactions occurring at the organismal level. Nevertheless, our approach allows for tightly controlled experimental conditions that can be tailored to the specific question of interest, by focusing on the relevant host cell type and microbiomes, and massively reducing confounding effects of cellular composition and the environment. Indeed, our approach allows controlling for various factors that may affect both the microbiome and host gene regulation, such as organismal-level variables (e.g., infection and hormones), host genetic variation, environmental factors (e.g., host diet), and oscillations and circadian dynamics in the microbiome and host gene expression.
STAR★METHODS
RESOURCE AVAILABILITY
Lead contact
Further information and requests for resources and reagents should be directed to and will be fulfilled by the Lead Contact, Ran Blekhman (blekhman@umn.edu)
Materials availability
This study did not generate new unique reagents.
Data and code availability
All sequencing data (RNA-seq, metagenomic shotgun, and 16S rRNA) have been deposited at the Sequence Read Archive (SRA) and are publicly available as of the date of publication, under BioProject accession number SRA: PRJNA661048. Accession numbers are listed in the Key Resources Table.
KEY RESOURCES TABLE
All original code has been deposited on Github (https://github.com/blekhmanlab/Primates) and on Zenodo and is publicly available as of the date of publication. DOIs are listed in the Key Resources Table.
Any additional information required to reanalyze the data reported in this paper is available from the lead contact upon request.
EXPERIMENTAL MODEL AND SUBJECT DETAILS
Sample acquisition and live microbiota extraction
See Table S1 for full details about the human and non-human primate fecal samples used in this analysis. Non-human fecal samples from gorillas and orangutans were collected from captive animals immediately after defecation. One orangutan who donated two samples was on a low dose of antibiotics for chronic colitis. Samples were collected as soon as possible (within an hour of defecation) into a 50mL conical tube containing 20mL of cryoprotectant solution consisting of a 50:50 mixture of glycerol and saline solution. The cryoprotectant was filter sterilized through a 0.22μm filter. Samples were shaken vigorously to distribute the cryoprotectant. Gorilla and orangutan samples were stored at −80°C within 1 hour after collection and shipped to the lab on dry ice. Chimpanzee samples were stored at −20°C within 1 hour of collection and then shipped to the U.S. lab on dry ice within one day. Human fecal samples were purchased from OpenBiome and arrived frozen on dry ice. The following briefly describes the protocol by which OpenBiome processes stool samples. The sample is collected by OpenBiome and given to a technician within 1 hour of defecation. The mass of the sample is measured and transferred to a sterile biosafety cabinet. The stool sample is put into a sterile filter bag, and a sterile filtered dilutant of 12.5% glycerol is added with a normal saline buffer (0.90% [wt/vol] NaCl in water). The sample solution is then introduced to a homogenizer blender for 60 s and aliquoted into sterile bottles. The bottles are then immediately frozen at −80°C. Any sample not fully processed within 2 hours of passage is destroyed.
To extract fecal microbiota from the non-human primate samples, inside a sterile low-oxygen cabinet we placed fecal material into a sterilized disposable standard commercial blender cup, and added 20mL glycerol to reach approximately 30mL glycerol and 200mL normal saline buffer (0.90% [wt/vol] NaCl in water). Fecal material was blended until fully homogenized (about 1–2 min). Blended material was transferred to the same side of the membrane in a 330-micron filter bag and the liquid suspension of the bacterial community was collected on the other side of the filter. The resulting microbiota suspension was then mixed and aliquoted into small tubes and stored at −80°C.
The research and sample collection in this study complied with protocols approved through the University of Minnesota Institutional Animal Care and Use Committee.
Colonic Epithelial Cell Line and Growth Conditions
Experiments were conducted using primary human colonic epithelial cells (HCoEpiC, lot: 9763), hereby called colonocytes (ScienCell Research Laboratories, Carlsbad, California, USA, 2950). The cells were cultured on plates or flasks coated with poly-l-lysine (PLL), according to the supplier’s specifications (ScienCell 0413). Colonocytes were cultured in colonic epithelial cell medium supplemented with colonic epithelial cell growth supplement and penicillin-streptomycin according to the manufacturer’s protocol (ScienCell 2951) at 37°C with 5% CO2. At 24 hours before treatment, cells were changed to antibiotic-free medium and moved to an incubator at 37°C, 5% CO2, and a reduced 5% O2.
METHOD DETAILS
Colonocyte with hominid-derived microbiota treatment experiment
The experimental protocol used for the treatment of colonocytes with microbiota has previously been described in Richards et al. (2016). Fecal microbiota were not thawed until the day of the experiment. Prior to treatment, the microbiota was thawed at 30°C, and the microbial density (OD600) was assessed via a spectrophotometer (Bio-Rad SmartSpec 3000). Medium was removed from the colonocytes and fresh antibiotic-free medium was added to the cells, with a final microbial ratio of 10:1 microbe:colonocyte in each well. Additional wells containing only colonocytes were also cultured in the same 24-well plate for use as controls.
After 2 hours, the wells were scraped on ice, pelleted, and washed with cold phosphate-buffered saline (PBS) and then resuspended in lysis buffer (Dynabeads mRNA Direct kit, ThermoFisher Scientific, Waltham, Massachusetts, USA) and stored at −80°C until extraction of colonocyte RNA for RNA-seq. We conducted both metagenomic shotgun sequencing and 16S rRNA sequencing on the microbiomes at four points: before preparation (raw), after preparation (prepared), cultured with colonocytes (colonocytes) and cultured without colonocytes (control). Previous experiments have shown that microbiome composition does not change drastically over the 2 hour co-culture period (Richards et al., 2019). Human fecal microbiome samples were purchased as “prepared” from Openbiome and therefore were not sequenced raw.
RNA-seq experiment and data processing
Poly-adenylated mRNA was isolated from thawed cell lysates using the Dynabeads mRNA Direct Kit (Ambion) following the manufacturer’s instructions. RNA-seq libraries were prepared using a protocol modified from the NEBNext Ultradirectional (NEB) library preparation protocol to use Barcodes from BIOO Scientific added by ligation, as described in Richards et al. (2019). The libraries were then pooled and sequenced on two lanes of the Illumina Next-seq 500 in the Luca/Pique-Regi laboratory using the high output kits for 75 cycles to obtain paired-end reads. Reads were 80 bp in length. Read counts ranged between 12,632,223 and 36,747,968 reads per sample, with a mean of 18,726,038 and median of 16,993,999 reads per sample.
FastQC was used to determine the quality of reads from raw data (FastQC, version 0.11.5). Trimmomatic was used to trim adapters. FastQC was again used to determine the quality of reads after trimming of adapters (Trimmomatic version 0.33). Transcripts were aligned to database GRCh38 using HISAT2 (HISAT2 version 2.0.2) (Kim et al., 2019). After alignment, read counts ranged between 10,817,737 and 33,592,529 aligned reads per sample, with a mean of 17,142,585.72 and a median of 15,542,693.5 aligned reads per sample. Overall, the average alignment rate was ~70% across samples (Figure S5). The R ‘Subread’ package with the ‘featureCounts’ program was used to make the transcript abundance file (R version 3.3.3, Subread version 1.4.6).
16S rRNA sequencing
Sequencing on the 16S rRNA V4 region was performed at the University of Minnesota Genomics Center using the protocol described in Gohl et al. (2016). DNA isolated from fecal samples was quantified with qPCR and the V4 region of the 16S rRNA gene was amplified using PCR with barcodes for multiplexing.
The forward indexing primer sequence is - AATGATACGGCGACCACCGAGATCTACAC[i5]TCGTCGGCAGCGTC and the reverse indexing primer sequence is - CAAGCAGAAGACGGCATACGAGAT[i7]GTCTCGTGGGCTCGG (where the bolded regions are the p5 and p7 flow cell adapters and [i5] and [i7] refer to the index sequence codes used by Illumina). The qPCR step starts with an initial denaturing step at 95°C for 5 min followed by 35 cycles of denaturation (20 s at 98°C), annealing (15 s at 66°C) and elongation (1 min at 72°C). After qPCR, samples are normalized to 167,000 molecules/μl. This is based on the volume of sample used for PCR1 (3μl), so 500,000 molecules is roughly 10x the target sequencing coverage. The next PCR (PCR1) step is similar to the qPCR step, except with only 25 cycles of denaturation, annealing, and elongation. After the first round of amplification, PCR1 products are diluted 1:100 and 5μl of 1:100 PCR1 is used in the second PCR reaction. The next step (PCR2) is similar to the previous two PCR protocols, except with only 10 cycles of denaturation, annealing, and elongation. Next, pooled samples were denatured with NaOH, diluted to 8 pM in Illumina’s HT1 buffer, spiked with 15% PhiX, and heat denatured at 96°C for 2 minutes immediately prior to loading. A MiSeq 600 cycle v3 kit was used to sequence the sample. The following Nextera adaptor sequences for post-run trimming are also used. For read 1 - CTGTCTCTTATACACATCTCCGAGCCCACGAGACNNNNNNNNATCTCGTATGCCGTCTTCTGCTTG and for read 2 - CTGTCTCTTATACACATCTGACGCTGCCGACGANNNNNNNNGTGTAGATCTCGGTGGTCGCCGTATCATT
Metagenomic shotgun sequencing
Metagenomic shotgun sequencing on prepared microbiota samples was performed at the University of Minnesota Genomics Center (UMGC). DNA samples were quantified using a fluorimetric PicoGreen assay gDNA samples were converted to Illumina sequencing libraries using Illumina’s NexteraXT DNA Sample Preparation Kit (Cat. # FC-130-1005). 1 ng of gDNA was simultaneously fragmented and tagged with a unique adaptor sequence. This “tagmentation” step is mediated by a transposase. The tagmented DNA was simultaneously indexed and amplified with 12 PCR cycles. Final library size distribution was validated using capillary electrophoresis and quantified using fluorimetry (PicoGreen). Truseq libraries were hybridized to a NextSeq. Base call (.bcl) files for each cycle of sequencing were generated by Illumina Real Time Analysis (RTA) software. The base call files were demultiplexed and then converted to index specific fastq files using the MiSeq Reporter software on-instrument.
QUANTIFICATION AND STATISTICAL ANALYSIS
Characterizing microbiota
To identify microbial features from the metagenomic shotgun sequencing data, including taxa and pathway abundances, we used the HUMAnN2 pipeline with Metaphlan2 (HUMAnN2 v0.11.1, Metaphlan2 v0.2.6.0) (Truong et al., 2015; Franzosa et al., 2018). FastQC v0.11.7 was used to determine the quality of sequencing reads before trimming. Sequencing adapters were trimmed from the raw reads using Trimmomatic (Trimmomatic v0.33) (Bolger et al., 2014). FastQC v0.11.7 was again used to determine quality of sequencing reads after trimming the sequencing adapters from the reads (Figure S6). Metaphlan2 was used to assign taxonomy at all taxonomic levels to the sequencing reads in each sequencing file, and in particular to get relative abundances of microbial taxa for each sample. The HUMAnN2 pipeline utilizes bowtie v0.2.2 for read alignment (Langmead and Salzberg, 2012), DIAMOND v0.8.22 for high throughput protein alignment (Buchfink et al., 2015), MinPath (Ye and Doak, 2009) for pathway reconstruction from protein family predictions. The UniRef90 database was used for determining gene family abundances (Suzek et al., 2015). We found a total of 166 named microbial species detected in at least one sample (Figure S7).
Principal Coordinate Analysis of Samples
Using the 16S rRNA data from the fecal microbiota samples, we used the R package ‘DADA2′ (DADA2, version 1.2.2) to identify amplicon sequence variants (ASVs) from the reads (Callahan et al., 2016). DADA2 was used to filter and trim sequences from raw reads. Forward reads were trimmed to position 240 and reverse reads were trimmed to position 160. Reads were truncated at the first quality score less than or equal to 2. Reads with more than two errors were discarded after truncation. Amplicon sequences were dereplicated using the function ‘derepFastq.’ Sample composition was inferred using the ‘dada’ function. Chimeras were removed using ‘removeBimeraDenovo.’ We assigned taxonomy to the resulting ASVs using ‘assignTaxonomy.’ Using the R package ‘vegan’ (version 2.5–3), we calculated Bray-Curtis dissimilarities and plotted these as a principal coordinate analysis plot (Figure 1B).
Comparison of microbiome composition between captive and wild gorillas and chimpanzees
Previous studies have shown differences in composition between wild and captive primate microbiomes (Clayton et al., 2016). To compare our captive primate samples to their wild counterparts, we downloaded the processed ASV table from Campbell et al. (2020), which sequenced gut microbiomes from wild chimpanzees and wild gorillas. Campbell et al. (2020) sequenced wild gorilla and chimpanzee fecal microbiome samples using the Illumina MiSeq, targeting the V4 region of the 16S rRNA gene. Campbell et al. (2020) processed their data using DADA2, v1.8, and assigned taxonomy on the resulting ASVs using the Greengenes database. The data in our study was sequenced on the same region and processed with DADA2, v1.2.2, and also assigned taxonomy using Greengenes. Using the R package ‘phyloseq’, we combined the two datasets and created a stacked barplot showing the taxonomic relative abundances at the phylum level for each of the samples, with captive and wild individuals from each species (Figure S1B).
Species-specific differential expression analysis
We filtered the RNA-seq counts table so that we only consider protein coding genes, reducing the number of considered genes from 60,674 to 19,715. Host genes were filtered for only protein coding genes using the R package ‘biomaRt’ with ensembl build 37. Within DESeq2 (DESeq2 version 1.14.1), RNA-seq counts were further filtered such that each gene had to be present at least once over all the samples, leaving 17,860 tested genes (Love et al., 2014). DESeq2 uses a negative binomial model to model the count data while it also estimates an appropriate size factor to normalize each sample by its sequencing depth. Additionally, the overdispersion parameter governing the negative binomial distribution is estimated per each gene and using a regularization approach that can monitor outliers and adjust for the mean-variance dependency. The parameter governing the mean gene expression after adjusting to its sequencing depth is modeled as a linear combination that incorporates known batch effects (i.e., plate) and the effect of the biological variable of interest (i.e., each microbiome):
or, in mathematical terms:
Where Ynj represents the internal DEseq parameter for mean gene expression for gene j and experiment n, Mnsis the treatment indicator (control or microbiome for species s), and the is the microbiome effect for each species. To model plate as a known batch effect we use Pnp and for the plate indicator variable and its effect on gene expression.
For four hominid microbiomes, 24 = 16 effect configurations are possible (for each species combination of which parameters , and we ran a likelihood test for each configuration Li: a gene can respond to a single primate microbiome (chimp, gorilla, human, or orangutan), a gene can respond to two of the four primate microbiomes (chimp-gorilla, chimp-human, chimp-orangutan, gorilla-human, gorilla-orangutan, human-orangutan), a gene can respond to three of the four primate microbiomes (chimp-gorilla-human, chimp-human-orangutan, chimp-gorilla-orangutan, or gorilla-human-orangutan), a gene can respond to all four primate microbiomes, or a gene can show no response to any of the four primate microbiomes. The no-response case is considered the base case, or null model for all the likelihood ratio tests performed.
To identify genes that respond to microbiomes from a specific primate species and to detect the total number of differentially expressed genes that respond to each of the fifteen possible non null combinations of primate microbiomes we ran a likelihood ratio test against the base model, which assumes that the host gene shows no response:
and all the coefficients are zero. After determining across all genes and configurations which were statistically significant at FDR < 10%. We used the likelihood statistics Lji for each gene j and configuration i to calculate the most probable configuration .
Simplified models for pairwise comparisons of primate microbiomes
We performed an additional analysis to determine which genes are differentially expressed between each of the pairwise combinations of hominids. We ran the following DESeq2 model:
Where Species is a vector indicating which hominid species the microbiome sample originated from. We filtered the RNA-seq counts so that only genes that are present in at least 3 individuals with count > 0 are considered in the model. We ran contrasts in DESeq2 for all six of the pairwise comparisons between hominids: Chimpanzee-Gorilla, Chimpanzee-Human, Chimpanzee-Orangutan, Gorilla-Human, Gorilla-Orangutan, and Human-Orangutan (Figure S8; Table S12).
Enrichment analysis
Enrichment analysis was performed using Ingenuity Pathway Analysis (IPA, QIAGEN Inc., https://digitalinsights.qiagen.com/products/ingenuity-pathway-analysis). We analyzed genes that show a response to microbiomes from a specific primate species. Here, we define those genes as genes that are upregulated or downregulated in response to a specific primate host species, or that show no response to microbiomes from that primate species and show a response to the other three primate host species. For example, genes that show a response only to human microbiomes will be upregulated or downregulated in response to human microbiomes, or show no response to human microbiomes and a response to chimpanzee, gorilla, and orangutan microbiomes. Genes that show a response to three species but not the fourth are also showing a species specific response to the fourth primate species.
We further validated these results using the R package ‘ClusterProfiler’ for enrichment analysis using all detected genes present in at least one sample as the background set (ClusterProfiler v3.2.14) (Figure 3C) (Yu et al., 2012). We used ENRICHR for enrichment analysis of the high and low-divergence genes and extracted the top ten response categories from the GO Biological, GO Molecular, KEGG, and Reactome databases) (Figure S3) (Kuleshov et al., 2016; Chen et al., 2013).
To identify enrichment of high-divergence genes among genes that were previously found to be associated with complex human disease and traits, we used data from the GWAS catalog (Buniello et al., 2019). Since each GWAS has a different distribution of p values and significance cutoffs, we chose to use a set of −log10(p value) cutoffs in the range of 8–50 (plotted along the x axis in Figure 3D). For a given trait, we identified the overlap between the genes significantly associated with the disease at each cutoff and high-divergence genes, and calculated a fold enrichment (plotted along the y axis in Figure 3D), defined as the ratio of observed/expected overlap between the two gene sets. We used a Fisher’s Exact Test to calculate a p value for each cutoff, and traits for which this value was significant after multiple test correction (FDR = 0.1) were marked with a colored line in Figure 3D.
K-means clustering was performed using the ‘kmeans’ function in base R (version 3.3.3) on the cluster of microbes P. copri, Methanobrevibacter and P. succinatutens for the genes in Figure 4A. Enrichment analysis was performed using ENRICHR on the two clusters of genes. A k-means clustering analysis was also performed on the full set of microbial pathway-host gene correlations in Figure 4B to produce three clusters of genes.
Log fold change of genes by primate species
To calculate the fold changes for each gene for each of the four primate species, we used a similar DESeq2 model to the one described above:
or, in mathematical terms:
Here, Species is a vector indicating which primate species the microbiome sample originated from, and ExperimentPlate controls for the batch effect as before, but we just test the marginal effect of each species-specific parameter being not different than the untreated control . We use the contrast argument in DESeq2 to extract comparisons of each primate species against the control. Thus, this resulted in log fold change calculations for each gene as it responds to each of the four primate species’ microbiomes. These values are available in Table S13.
Divergence scores for differentially expressed, conserved genes
Using DESeq2, we identified genes that responded to microbiome treatment. We used the following he model to determine whether a gene responds to treatment:
Where ExperimentPlate controls for the batch effect of the experiment, and Treatment is a binary vector indicating whether the colonocytes are treated with a microbiome or act as a control for the experiment. Mathematically:
Where Ynj represents the internal DEseq mean gene expression parameter for gene j and experiment n as before, Tnis the treatment indicator (control = 0 or microbiome = 1), and the parameter is the microbiome effect. Plate effects are modeled as before. To model plate as a known batch effect we used Pnp and for the plate indicator variable and its effect on gene expression.
Log fold changes for each gene were calculated as described above, and then used to calculate a divergence metric for each gene. We used a similar divergence calculation as described in Hagai et al. (2018). Namely, for the genes identified as responding to treatment with microbiomes, we used the log fold changes for each species in the following equation:
Following Hagai et al. (2018), the top 25% of genes were assigned a “high-divergence” status, and the lowest 25% of genes were assigned a “low-divergence” status. These genes were used in the enrichment analyses described below.
The rest of the genes are considered “medium divergence” genes. These genes are used in the enrichment analysis as a background set (Figures 3A and 3C).
Pairwise correlations between host genes and microbial species and pathways
Using the microbial species abundances calculated from the metagenomic shotgun sequencing, we ran correlation analysis between genes that are differentially expressed with respect to treatment with microbiota and abundances of microbial species. Within DESeq2 (DESeq2 version 1.14.1), RNA-seq counts were further filtered such that each gene had to be present at least twenty times leaving 15,855 tested genes (Love et al., 2014) Metaphlan2 reports microbial species as a proportion of the total microbial community per sample. Microbial species were filtered such that only microbial species present in at least half of the samples and that reached a total summed relative abundance of 9% were included in the analysis, leaving 36 microbial species. We applied a center log-ratio transformation to the filtered microbial species abundance data. Microbial pathways were filtered such that the total of each pathway had to be greater than a summed threshold of 8000 reads per kilobase (RPK), leaving 95 microbial pathways to be included in the analysis. Microbial pathways were normalized using the centered log ratio transformation in a similar manner to the microbial species.
Using DESeq2, we identified which microbial species or pathways are associated with differentially expressed genes using the following model:
Mathematically:
Where Ynj represents the internal DEseq parameter for gene expression for gene j and experiment n as before, Tnis the treatment indicator (control = 0 or microbiome = 1), and the parameter is the microbiome effect. Plate effects are modeled as before. The parameter is used to model the effect of the microbiome feature (i.e., microbial species or pathway) f on gene expression. We statistically test effect in a separate DESeq model run for each feature f. We used an FDR correction on the combined results from all models. The microbial species abundance is a continuous numeric value that represents that center log ratio transformed relative abundance of the microbial feature f Afn for each sample n.
TWAS analysis
To directly investigate whether discovered effects on gene expression may contribute to complex traits, we considered PTWAS gene-trait associations for 114 traits from Zhang et al. (2020). PTWAS utilizes probabilistic eQTL annotations derived from multivariant Bayesian fine-mapping analysis of eQTL data across 49 tissues from GTEx v8 to detect associations between gene expression levels and complex trait risk. Using the host genes that were highly correlated with a microbial species and fell into the high-divergence category (FDR < 0.05), we overlapped the significant results with genes causally implicated in complex traits across all tissues by Zhang et al. (2020) (PTWAS scan, 5% FDR). We repeated the same analysis with the host genes that were highly correlated with a microbial pathway (FDR < 0.01) and fell into the high-divergence category.
Supplementary Material
Highlights.
Gut microbiota from humans, chimpanzees, gorillas, and orangutans regulate host genes
Most host genes respond to all hominid microbiomes in the same way
Some host genes respond only to microbiomes from a specific hominid species
Genes with such species-specific response are linked to human intestinal diseases
ACKNOWLEDGMENTS
We would like to thank the primate zookeepers at the Ostrava Zoo, and especially Jana Pluhackova, for their help with chimpanzee fecal sample collection. We would also like to thank the primate zookeepers at the Como Park Zoo and Conservatory for their help with gorilla and orangutan fecal sample collection. Finally, we would like to thank Blekhman lab members, and especially Rich Ab-dill, Beth Adamovicz, Laura Grieneisen, and Sambhawa Priya, for their comments and advice on the manuscript. This work is supported by NIH (R35-GM128716 to R.B. and R01-GM109215 to F.L. and R.P.-R.). Partial funding was provided by the Czech-American Scientific cooperation (LH15175) supported by the Ministry of Education, Youth and Sports of the Czech Republic (to K.P.). This work was carried out, in part, by resources provided by the Minnesota Supercomputing Institute.
Footnotes
DECLARATION OF INTERESTS
The authors declare no competing interests.
SUPPLEMENTAL INFORMATION
Supplemental information can be found online at https://doi.org/10.1016/j.celrep.2021.110057.
REFERENCES
- Amato KR, Sanders JG, Song SJ, Nute M, Metcalf JL, Thompson LR, Morton JT, Amir A, McKenzie VJ, Humphrey G, et al. (2019a). Evolutionary trends in host physiology outweigh dietary niche in structuring primate gut microbiomes. ISME J. 13, 576–587. [DOI] [PMC free article] [PubMed] [Google Scholar]
- Amato KR, Mallott EK, McDonald D, Dominy NJ, Goldberg T, Lambert JE, Swedell L, Metcalf JL, Gomez A, Britton GAO, et al. (2019b). Convergence of human and Old World monkey gut microbiomes demonstrates the importance of human ecology over phylogeny. Genome Biol. 20, 201. [DOI] [PMC free article] [PubMed] [Google Scholar]
- Blekhman R, Oshlack A, Chabot AE, Smyth GK, and Gilad Y (2008). Gene regulation in primates evolves under tissue-specific selection pressures. PLoS Genet. 4, e1000271. [DOI] [PMC free article] [PubMed] [Google Scholar]
- Blekhman R, Goodrich JK, Huang K, Sun Q, Bukowski R, Bell JT, Spector TD, Keinan A, Ley RE, Gevers D, and Clark AG (2015). Host genetic variation impacts microbiome composition across human body sites. Genome Biol. 16, 191. [DOI] [PMC free article] [PubMed] [Google Scholar]
- Bolger AM, Lohse M, and Usadel B (2014). Trimmomatic: a flexible trimmer for Illumina sequence data. Bioinformatics 30, 2114–2120. [DOI] [PMC free article] [PubMed] [Google Scholar]
- Brawand D, Soumillon M, Necsulea A, Julien P, Csárdi G, Harrigan P, Weier M, Liechti A, Aximu-Petri A, Kircher M, et al. (2011). The evolution of gene expression levels in mammalian organs. Nature 478, 343–348. [DOI] [PubMed] [Google Scholar]
- Britten RJ, and Davidson EH (1971). Repetitive and non-repetitive DNA sequences and a speculation on the origins of evolutionary novelty. Q. Rev. Biol 46, 111–138. [DOI] [PubMed] [Google Scholar]
- Buchfink B, Xie C, and Huson DH (2015). Fast and sensitive protein alignment using DIAMOND. Nat. Methods 12, 59–60. [DOI] [PubMed] [Google Scholar]
- Buniello A, MacArthur JAL, Cerezo M, Harris LW, Hayhurst J, Malangone C, McMahon A, Morales J, Mountjoy E, Sollis E, et al. (2019). The NHGRI-EBI GWAS Catalog of published genome-wide association studies, targeted arrays and summary statistics 2019. Nucleic Acids Res 47 (D1), D1005–D1012. [DOI] [PMC free article] [PubMed] [Google Scholar]
- Callahan BJ, McMurdie PJ, Rosen MJ, Han AW, Johnson AJ, and Holmes SP (2016). DADA2: High-resolution sample inference from Illumina amplicon data. Nat. Methods 13, 581–583. [DOI] [PMC free article] [PubMed] [Google Scholar]
- Camp JG, Frank CL, Lickwar CR, Guturu H, Rube T, Wenger AM, Chen J, Bejerano G, Crawford GE, and Rawls JF (2014). Microbiota modulate transcription in the intestinal epithelium without remodeling the accessible chromatin landscape. Genome Res 24, 1504–1516. [DOI] [PMC free article] [PubMed] [Google Scholar]
- Campbell TP, Sun X, Patel VH, Sanz C, Morgan D, and Dantas G (2020). The microbiome and resistome of chimpanzees, gorillas, and humans across host lifestyle and geography. ISME J 14, 1584–1599. [DOI] [PMC free article] [PubMed] [Google Scholar]
- Chen EY, Tan CM, Kou Y, Duan Q, Wang Z, Meirelles GV, Clark NR, and Ma’ayan A (2013). Enrichr: interactive and collaborative HTML5 gene list enrichment analysis tool. BMC Bioinformatics 14, 128. [DOI] [PMC free article] [PubMed] [Google Scholar]
- Clayton JB, Vangay P, Huang H, Ward T, Hillmann BM, Al-Ghalith GA, Travis DA, Long HT, Tuan BV, Minh VV, et al. (2016). Captivity humanizes the primate microbiome. Proc. Natl. Acad. Sci. USA 113, 10376–10381. [DOI] [PMC free article] [PubMed] [Google Scholar]
- Cox DG, Pontes C, Guino E, Navarro M, Osorio A, Canzian F, and Moreno V; Bellvitge Colorectal Cancer Study Group (2004). Polymorphisms in prostaglandin synthase 2/cyclooxygenase 2 (PTGS2/COX2) and risk of colorectal cancer. Br. J. Cancer 91, 339–343. [DOI] [PMC free article] [PubMed] [Google Scholar]
- Dahmus JD, Kotler DL, Kastenberg DM, and Kistler CA (2018). The gut microbiome and colorectal cancer: a review of bacterial pathogenesis. J. Gastrointest. Oncol 9, 769–777. [DOI] [PMC free article] [PubMed] [Google Scholar]
- de Lange KM, and Barrett JC (2015). Understanding inflammatory bowel disease via immunogenetics. J. Autoimmun 64, 91–100. [DOI] [PubMed] [Google Scholar]
- De Vadder F, Kovatcheva-Datchary P, Zitoun C, Duchampt A, Bäckhed F, and Mithieux G (2016). Microbiota-Produced Succinate Improves Glucose Homeostasis via Intestinal Gluconeogenesis. Cell Metab 24, 151–157. [DOI] [PubMed] [Google Scholar]
- Delsuc F, Metcalf JL, Wegener Parfrey L, Song SJ, González A, and Knight R (2014). Convergence of gut microbiomes in myrmecophagous mammals. Mol. Ecol 23, 1301–1317. [DOI] [PubMed] [Google Scholar]
- Emre Y, and Imhof BA (2014). Matricellular protein CCN1/CYR61: a new player in inflammation and leukocyte trafficking. Semin. Immunopathol 36, 253–259. [DOI] [PubMed] [Google Scholar]
- Enard W, Khaitovich P, Klose J, Zöllner S, Heissig F, Giavalisco P, Nieselt-Struwe K, Muchmore E, Varki A, Ravid R, et al. (2002). Intra- and interspecific variation in primate gene expression patterns. Science 296, 340–343. [DOI] [PubMed] [Google Scholar]
- Ferreira RB, Gill N, Willing BP, Antunes LC, Russell SL, Croxen MA, and Finlay BB (2011). The intestinal microbiota plays a role in Salmonella-induced colitis independent of pathogen colonization. PLoS ONE 6, e20338. [DOI] [PMC free article] [PubMed] [Google Scholar]
- Franzosa EA, McIver LJ, Rahnavard G, Thompson LR, Schirmer M, Weingart G, Lipson KS, Knight R, Caporaso JG, Segata N, and Huttenhower C (2018). Species-level functional profiling of metagenomes and meta-transcriptomes. Nat. Methods 15, 962–968. [DOI] [PMC free article] [PubMed] [Google Scholar]
- Gales D, Clark C, Manne U, and Samuel T (2013). The Chemokine CXCL8 in Carcinogenesis and Drug Response. ISRN Oncol 2013, 859154. [DOI] [PMC free article] [PubMed] [Google Scholar]
- Gijsbers K, Van Assche G, Joossens S, Struyf S, Proost P, Rutgeerts P, Geboes K, and Van Damme J (2004). CXCR1-binding chemokines in inflammatory bowel diseases: down-regulated IL-8/CXCL8 production by leukocytes in Crohn’s disease and selective GCP-2/CXCL6 expression in inflamed intestinal tissue. Eur. J. Immunol 34, 1992–2000. [DOI] [PubMed] [Google Scholar]
- Gilad Y, Oshlack A, Smyth GK, Speed TP, and White KP (2006). Expression profiling in primates reveals a rapid evolution of human transcription factors. Nature 440, 242–245. [DOI] [PubMed] [Google Scholar]
- Gohl DM, Vangay P, Garbe J, MacLean A, Hauge A, Becker A, Gould TJ, Clayton JB, Johnson TJ, Hunter R, et al. (2016). Systematic improvement of amplicon marker gene methods for increased accuracy in microbiome studies. Nat. Biotechnol 34, 942–949. [DOI] [PubMed] [Google Scholar]
- Gomez A, Petrzelkova K, Yeoman CJ, Vlckova K, Mrázek J, Koppova I, Carbonero F, Ulanov A, Modry D, Todd A, et al. (2015). Gut microbiome composition and metabolomic profiles of wild western lowland gorillas (Gorilla gorilla gorilla) reflect host ecology. Mol. Ecol 24, 2551–2565. [DOI] [PubMed] [Google Scholar]
- Gomez A, Petrzelkova KJ, Burns MB, Yeoman CJ, Amato KR, Vlckova K, Modry D, Todd A, Jost Robinson CA, Remis MJ, et al. (2016a). Gut Microbiome of Coexisting BaAka Pygmies and Bantu Reflects Gradients of Traditional Subsistence Patterns. Cell Rep 14, 2142–2153. [DOI] [PubMed] [Google Scholar]
- Gomez A, Rothman JM, Petrzelkova K, Yeoman CJ, Vlckova K, Umaña JD, Carr M, Modry D, Todd A, Torralba M, et al. (2016b). Temporal variation selects for diet-microbe co-metabolic traits in the gut of Gorilla spp. ISME J 10, 514–526. [DOI] [PMC free article] [PubMed] [Google Scholar]
- Gomez A, Sharma AK, Mallott EK, Petrzelkova KJ, Jost Robinson CA, Yeoman CJ, Carbonero F, Pafco B, Rothman JM, Ulanov A, et al. (2019). Plasticity in the Human Gut Microbiome Defies Evolutionary Constraints. MSphere 4, e00271, 19. [DOI] [PMC free article] [PubMed] [Google Scholar]
- Goodrich JK, Waters JL, Poole AC, Sutter JL, Koren O, Blekhman R, Beaumont M, Van Treuren W, Knight R, Bell JT, et al. (2014). Human genetics shape the gut microbiome. Cell 159, 789–799. [DOI] [PMC free article] [PubMed] [Google Scholar]
- Grieneisen LE, Charpentier MJE, Alberts SC, Ran B, Gideon B, Jenny T, and Archie EA (2019). Genes, geology and germs: gut microbiota across a primate hybrid zone are explained by site soil properties, not host species. Proc. R. Soc. B 286, 20190431. [DOI] [PMC free article] [PubMed] [Google Scholar]
- Habibian JS, Jefic M, Bagchi RA, Lane RH, McKnight RA, McKinsey TA, Morrison RF, and Ferguson BS (2017). DUSP5 functions as a feedback regulator of TNFα-induced ERK1/2 dephosphorylation and inflammatory gene expression in adipocytes. Sci. Rep 7, 12879. [DOI] [PMC free article] [PubMed] [Google Scholar]
- Hagai T, Chen X, Miragaia RJ, Rostom R, Gomes T, Kunowska N, Henriksson J, Park JE, Proserpio V, Donati G, et al. (2018). Gene expression variability across cells and species shapes innate immunity. Nature 563, 197–202. [DOI] [PMC free article] [PubMed] [Google Scholar]
- Hicks AL, Lee KJ, Couto-Rodriguez M, Patel J, Sinha R, Guo C, Olson SH, Seimon A, Seimon TA, Ondzie AU, et al. (2018). Gut microbiomes of wild great apes fluctuate seasonally in response to diet. Nat. Commun 9, 1786. [DOI] [PMC free article] [PubMed] [Google Scholar]
- Hörber S, Hildebrand DG, Lieb WS, Lorscheid S, Hailfinger S, Schulze-Osthoff K, and Essmann F (2016). The Atypical Inhibitor of NF-κB, IκBζ, Controls Macrophage Interleukin-10 Expression. J. Biol. Chem 291, 12851–12861. [DOI] [PMC free article] [PubMed] [Google Scholar]
- Hotte NSC, Salim SY, Tso RH, Albert EJ, Bach P, Walker J, Dieleman LA, Fedorak RN, and Madsen KL (2012). Patients with inflammatory bowel disease exhibit dysregulated responses to microbial DNA. PLoS ONE 7, e37932. [DOI] [PMC free article] [PubMed] [Google Scholar]
- Human Microbiome Project Consortium (2012). Structure, function and diversity of the healthy human microbiome. Nature 486, 207–214. [DOI] [PMC free article] [PubMed] [Google Scholar]
- Khor B, Gardet A, and Xavier RJ (2011). Genetics and pathogenesis of inflammatory bowel disease. Nature 474, 307–317. [DOI] [PMC free article] [PubMed] [Google Scholar]
- Kim D, Paggi JM, Park C, Bennett C, and Salzberg SL (2019). Graph-based genome alignment and genotyping with HISAT2 and HISAT-genotype. Nat. Biotechnol 37, 907–915. [DOI] [PMC free article] [PubMed] [Google Scholar]
- King MC, and Wilson AC (1975). Evolution at two levels in humans and chimpanzees. Science 188, 107–116. [DOI] [PubMed] [Google Scholar]
- Krämer A, Green J, Pollard J Jr., and Tugendreich S (2014). Causal analysis approaches in Ingenuity Pathway Analysis. Bioinformatics 30, 523–530. [DOI] [PMC free article] [PubMed] [Google Scholar]
- Krautkramer KA, Kreznar JH, Romano KA, Vivas EI, Barrett-Wilt GA, Rabaglia ME, Keller MP, Attie AD, Rey FE, and Denu JM (2016). Diet-Microbiota Interactions Mediate Global Epigenetic Programming in Multiple Host Tissues. Mol. Cell 64, 982–992. [DOI] [PMC free article] [PubMed] [Google Scholar]
- Kuleshov MV, Jones MR, Rouillard AD, Fernandez NF, Duan Q, Wang Z, Koplev S, Jenkins SL, Jagodnik KM, Lachmann A, et al. (2016). Enrichr: a comprehensive gene set enrichment analysis web server 2016 update. Nucleic Acids Res 44 (W1), W90–7. [DOI] [PMC free article] [PubMed] [Google Scholar]
- Lang JM, Pan C, Cantor RM, Tang WHW, Garcia-Garcia JC, Kurtz I, Hazen SL, Bergeron N, Krauss RM, and Lusis AJ (2018). Impact of Individual Traits, Saturated Fat, and Protein Source on the Gut Microbiome. MBio 9, e01604, 18. [DOI] [PMC free article] [PubMed] [Google Scholar]
- Langmead B, and Salzberg SL (2012). Fast Gapped-Read Alignment with Bowtie 2. Nat. Methods 9, 357–359. [DOI] [PMC free article] [PubMed] [Google Scholar]
- Love MI, Huber W, and Anders S (2014). Moderated estimation of fold change and dispersion for RNA-seq data with DESeq2. Genome Biol 15, 550. [DOI] [PMC free article] [PubMed] [Google Scholar]
- Luca F, Kupfer SS, Knights D, Khoruts A, and Blekhman R (2018). Functional Genomics of Host-Microbiome Interactions in Humans. Trends Genet 34, 30–40. [DOI] [PMC free article] [PubMed] [Google Scholar]
- Mann AE, Mazel F, Lemay MA, Morien E, Billy V, Kowalewski M, Di Fiore A, Link A, Goldberg TL, Tecot S, et al. (2020). Biodiversity of protists and nematodes in the wild nonhuman primate gut. ISME J 14, 609–622. [DOI] [PMC free article] [PubMed] [Google Scholar]
- Moeller AH, Degnan PH, Pusey AE, Wilson ML, Hahn BH, and Ochman H (2012). Chimpanzees and humans harbour compositionally similar gut enterotypes. Nat. Commun 3, 1179. [DOI] [PMC free article] [PubMed] [Google Scholar]
- Morgan XC, Tickle TL, Sokol H, Gevers D, Devaney KL, Ward DV, Reyes JA, Shah SA, LeLeiko N, Snapper SB, et al. (2012). Dysfunction of the intestinal microbiome in inflammatory bowel disease and treatment. Genome Biol 13, R79. [DOI] [PMC free article] [PubMed] [Google Scholar]
- Müller A, Hennig A, Lorscheid S, Grondona P, Schulze-Osthoff K, Hailfinger S, and Kramer D (2018). IκBζ is a key transcriptional regulator of IL-36-driven psoriasis-related gene expression in keratinocytes. Proc. Natl. Acad. Sci. USA 115, 10088–10093. [DOI] [PMC free article] [PubMed] [Google Scholar]
- Nagpal R, Shively CA, Appt SA, Register TC, Michalson KT, Vitolins MZ, and Yadav H (2018). Gut Microbiome Composition in Non-human Primates Consuming a Western or Mediterranean Diet. Front. Nutr 5, 28. [DOI] [PMC free article] [PubMed] [Google Scholar]
- Nishida AH, and Ochman H (2019). A great-ape view of the gut microbiome. Nat. Rev. Genet 20, 195–206. [DOI] [PubMed] [Google Scholar]
- Noor SO, Ridgway K, Scovell L, Kemsley EK, Lund EK, Jamieson C, Johnson IT, and Narbad A (2010). Ulcerative colitis and irritable bowel patients exhibit distinct abnormalities of the gut microbiota. BMC Gastroenterol 10, 134. [DOI] [PMC free article] [PubMed] [Google Scholar]
- Ochman H, Worobey M, Kuo C-H, Ndjango J-BN, Peeters M, Hahn BH, and Hugenholtz P (2010). Evolutionary relationships of wild hominids recapitulated by gut microbial communities. PLoS Biol 8, e1000546. [DOI] [PMC free article] [PubMed] [Google Scholar]
- Onoufriadis A, Simpson MA, Pink AE, Di Meglio P, Smith CH, Pullabhatla V, Knight J, Spain SL, Nestle FO, Burden AD, et al. (2011). Mutations in IL36RN/IL1F5 are associated with the severe episodic inflammatory skin disease known as generalized pustular psoriasis. Am. J. Hum. Genet 89, 432–437. [DOI] [PMC free article] [PubMed] [Google Scholar]
- Pan W-H, Sommer F, Falk-Paulsen M, Ulas T, Best P, Fazio A, Kachroo P, Luzius A, Jentzsch M, Rehman A, et al. (2018). Exposure to the gut microbiota drives distinct methylome and transcriptome changes in intestinal epithelial cells during postnatal development. Genome Med 10, 27. [DOI] [PMC free article] [PubMed] [Google Scholar]
- Parisinos CA, Serghiou S, Katsoulis M, George MJ, Patel RS, Hemingway H, and Hingorani AD (2018). Variation in Interleukin 6 Receptor Gene Associates With Risk of Crohn’s Disease and Ulcerative Colitis. Gastroenterology 155, 303–306.e2. [DOI] [PMC free article] [PubMed] [Google Scholar]
- Qin Y, Roberts JD, Grimm SA, Lih FB, Deterding LJ, Li R, Chrysovergis K, and Wade PA (2018). An obesity-associated gut microbiome reprograms the intestinal epigenome and leads to altered colonic gene expression. Genome Biol 19, 7. [DOI] [PMC free article] [PubMed] [Google Scholar]
- Raymann K, Moeller AH, Goodman AL, and Ochman H (2017). Unexplored Archaeal Diversity in the Great Ape Gut Microbiome. MSphere 2, e00026–17. [DOI] [PMC free article] [PubMed] [Google Scholar]
- Remis MJ (1997). Western lowland gorillas (Gorilla gorilla gorilla) as seasonal frugivores: use of variable resources. Am. J. Primatol 43, 87–109. [DOI] [PubMed] [Google Scholar]
- Ren K, and Torres R (2009). Role of interleukin-1beta during pain and inflammation. Brain Res. Brain Res. Rev 60, 57–64. [DOI] [PMC free article] [PubMed] [Google Scholar]
- Richards AL, Burns MB, Alazizi A, Barreiro LB, Pique-Regi R, Blekhman R, and Luca F (2016). Genetic and transcriptional analysis of human host response to healthy gut microbiota. mSystems 1, e00067–16. [DOI] [PMC free article] [PubMed] [Google Scholar]
- Richards AL, Muehlbauer AL, Alazizi A, Burns MB, Findley A, Messina F, Gould TJ, Cascardo C, Pique-Regi R, Blekhman R, and Luca F (2019). Gut Microbiota Has a Widespread and Modifiable Effect on Host Gene Regulation. mSystems 4, e00323–18. [DOI] [PMC free article] [PubMed] [Google Scholar]
- Rincon M (2012). Interleukin-6: from an inflammatory marker to a target for inflammatory diseases. Trends Immunol 33, 571–577. [DOI] [PubMed] [Google Scholar]
- Russell SE, Horan RM, Stefanska AM, Carey A, Leon G, Aguilera M, Statovci D, Moran T, Fallon PG, Shanahan F, et al. (2016). IL-36a expression is elevated in ulcerative colitis and promotes colonic inflammation. Mucosal Immunol 9, 1193–1204. [DOI] [PubMed] [Google Scholar]
- Scher JU, and Abramson SB (2011). The microbiome and rheumatoid arthritis. Nat. Rev. Rheumatol 7, 569–578. [DOI] [PMC free article] [PubMed] [Google Scholar]
- Schulze HA, Häsler R, Mah N, Lu T, Nikolaus S, Costello CM, and Schreiber S (2008). From model cell line to in vivo gene expression: disease-related intestinal gene expression in IBD. Genes Immun 9, 240–248. [DOI] [PubMed] [Google Scholar]
- Suzek BE, Wang Y, Huang H, McGarvey PB, and Wu CH; UniProt Consortium (2015). UniRef clusters: a comprehensive and scalable alternative for improving sequence similarity searches. Bioinformatics 31, 926–932. [DOI] [PMC free article] [PubMed] [Google Scholar]
- Taylor AB (2006). Feeding behavior, diet, and the functional consequences of jaw form in orangutans, with implications for the evolution of Pongo. J. Hum. Evol 50, 377–393. [DOI] [PubMed] [Google Scholar]
- Truong DT, Franzosa EA, Tickle TL, Scholz M, Weingart G, Pasolli E, Tett A, Huttenhower C, and Segata N (2015). MetaPhlAn2 for enhanced metagenomic taxonomic profiling. Nat. Methods 12, 902–903. [DOI] [PubMed] [Google Scholar]
- Tung J, Barreiro LB, Burns MB, Grenier J-C, Lynch J, Grieneisen LE, Altmann J, Alberts SC, Blekhman R, and Archie EA (2015). Social networks predict gut microbiome composition in wild baboons. eLife 4, e05224. [DOI] [PMC free article] [PubMed] [Google Scholar]
- Turnbaugh PJ, Ley RE, Hamady M, Fraser-Liggett CM, Knight R, and Gordon JI (2007). The human microbiome project. Nature 449, 804–810. [DOI] [PMC free article] [PubMed] [Google Scholar]
- Tutin CEG, and Fernandez M (1993). Composition of the Diet of Chimpanzees and Comparisons with that of Sympatric Lowland Gorillas in the Lopé Reserve, Gabon. Am. J. Primatol 30, 195–211. [DOI] [PubMed] [Google Scholar]
- Vogel ER, Harrison ME, Zulfa A, Bransford TD, Alavi SE, Husson S, Morrogh-Bernard H, Santiano, Firtsman T, Utami-Atmoko SS, et al. (2015). Nutritional Differences between Two Orangutan Habitats: Implications for Population Density. PLoS ONE 10, e0138612. [DOI] [PMC free article] [PubMed] [Google Scholar]
- Wang W, Yu X, Wu C, and Jin H (2017). IL-36γ inhibits differentiation and induces inflammation of keratinocyte via Wnt signaling pathway in psoriasis. Int. J. Med. Sci 14, 1002–1007. [DOI] [PMC free article] [PubMed] [Google Scholar]
- Watts DP, Potts KB, Lwanga JS, and Mitani JC (2012). Diet of chimpanzees (Pan troglodytes schweinfurthii) at Ngogo, Kibale National Park, Uganda, 1. Diet composition and diversity. Am. J. Primatol 74, 114–129. [DOI] [PubMed] [Google Scholar]
- Wexler HM (2007). Bacteroides: the good, the bad, and the nitty-gritty. Clin. Microbiol. Rev 20, 593–621. [DOI] [PMC free article] [PubMed] [Google Scholar]
- Wu GD, Chen J, Hoffmann C, Bittinger K, Chen Y-Y, Keilbaugh SA, Bewtra M, Knights D, Walters WA, Knight R, et al. (2011). Linking long-term dietary patterns with gut microbial enterotypes. Science 334, 105–108. [DOI] [PMC free article] [PubMed] [Google Scholar]
- Ye Y, and Doak TG (2009). A parsimony approach to biological pathway reconstruction/inference for genomes and metagenomes. PLoS Comput. Biol 5, e1000465. [DOI] [PMC free article] [PubMed] [Google Scholar]
- Yu G, Wang L-G, Han Y, and He Q-Y (2012). clusterProfiler: an R package for comparing biological themes among gene clusters. OMICS 16, 284–287. [DOI] [PMC free article] [PubMed] [Google Scholar]
- Yue X, Wu L, and Hu W (2015). The regulation of leukemia inhibitory factor. Cancer Cell Microenviron 2, e877. [DOI] [PMC free article] [PubMed] [Google Scholar]
- Zhang S-L, Wang S-N, and Miao C-Y (2017). Influence of Microbiota on Intestinal Immune System in Ulcerative Colitis and Its Intervention. Front. Immunol 8, 1674. [DOI] [PMC free article] [PubMed] [Google Scholar]
- Zhang Y, Quick C, Yu K, Barbeira A, Luca F, Pique-Regi R, Im HK, and Wen X; GTEx Consortium (2020). Investigating Tissue-Relevant Causal Molecular Mechanisms of Complex Traits Using Probabilistic TWAS Analysis. Genome Biol 21, 232. [DOI] [PMC free article] [PubMed] [Google Scholar]
Associated Data
This section collects any data citations, data availability statements, or supplementary materials included in this article.
Supplementary Materials
Data Availability Statement
All sequencing data (RNA-seq, metagenomic shotgun, and 16S rRNA) have been deposited at the Sequence Read Archive (SRA) and are publicly available as of the date of publication, under BioProject accession number SRA: PRJNA661048. Accession numbers are listed in the Key Resources Table.
KEY RESOURCES TABLE
All original code has been deposited on Github (https://github.com/blekhmanlab/Primates) and on Zenodo and is publicly available as of the date of publication. DOIs are listed in the Key Resources Table.
Any additional information required to reanalyze the data reported in this paper is available from the lead contact upon request.