Abstract
The current dogma in agonist-stimulated PI3K/Akt signaling indicates that PI 3-kinase is activated at the plasma membrane where receptors are activated and PI4,5P2 is concentrated. Challenging this dogma, we show that PI3,4,5P3 generation and activated Akt are largely confined to endomembrane upon receptor tyrosine kinase activation. This is regulated by microtubule-associated protein 4 (MAP4), an interacting partner of PI3Kα that controls localization of membrane vesicle-associated PI3Kα to microtubules. The microtubule-binding domain (MTBD) of MAP4 binds directly to the C2 domain of the p110α catalytic subunit. MAP4 controls the interaction of PI3Kα with activated receptors at endosomal compartments along microtubules. Loss of MAP4 culminates in the loss of PI3Kα targeting and loss of PI3K/Akt signaling downstream of multiple agonists. The MAP4-PI3Kα assembly defines a mechanism for spatial control of agonist-stimulated PI3K/Akt signaling at internal membrane compartments linked to the microtubule network.
Keywords: PI3Kα; MAP4; PI3,4,5P3; Akt; Microtubule; Vesicles; Endosomes
INTRODUCTION
PI3K/Akt signaling is one of the most extensively studied signaling pathways fundamental to most biological processes1, 2 and commonly targeted for cancer therapeutics3, 4. In the classical pathway of class IA PI3K/Akt signaling, PI 3-kinase (PI3K) catalytic subunits (p110α, p110β, and p110δ) via the p85 adaptor subunit are directly or indirectly recruited to activated receptor tyrosine kinases at the plasma membrane enabling catalytic subunit phosphorylation of PI4,5P2 into PI3,4,5P3 and Akt activationt5–10.
As PI3Ks control Akt signaling, it is crucial to define precisely where and how PI3Ks are activated within cells for PI3,4,5P3 generation upon agonist stimulation. Early studies indicated PI3K localization along microtubules close to the microtubule-organizing center11, 12. Biochemical studies suggested growth factor-stimulated PI3K activity in a low-density intracellular membrane fraction (enriched in endosomes), with less contribution from the plasma membrane11, with PI3,4,5P3 generation largely on endomembranes13. These decades-old studies hint that agonist-stimulated PI3K/Akt signaling occurs at intracellular compartments rather than the plasma membrane. A recent study indicates that the tumor suppressor PTEN antagonizes PI3K/Akt signaling via recruitment to endosomes along microtubules14. Although the prevailing dogma links the activation of PI3K/Akt signaling exclusively at the plasma membrane2, 5, there is a little data demonstrating the spatial and temporal generation of PI3,4,5P3 and Akt activation at the plasma membrane15–17. Similarly, unlike receptor tyrosine kinases, there are no studies demonstrating spatial targeting of PI3K to the plasma membrane in response to growth factor stimulation.
In an attempt to resolve this dilemma, we began investigating the contribution of PI3Kα (the primary isoform activated downstream of receptor tyrosine kinases and mutated in cancer) to the spatial generation of PI3,4,5P3 upon agonist stimulation2. PI3Kα localized at vesicular compartments in proximity to microtubules, irrespective of the mutational status of PI3Kα and the cell type examined. We discovered the ubiquitously expressed microtubule-associated protein 4 (MAP4) as a binding partner of the p110α catalytic subunit of PI3Kα. MAP4 decorates the microtubule network and plays a role in microtubule assembly and endosomal vesicle trafficking along microtubule tracks18. As microtubules serve as a track for endosomal trafficking of receptors (constitutive and stimulated) to and from endo-membranes and the plasma membrane, the interaction of PI3Kα with MAP4 provides a platform for PI3Kα distribution along microtubules and PI3Kα association with activated receptors at endosomes. Thus, microtubule-associated scaffolding molecule MAP4 provides a crucial clue for spatial activation of PI3K/Akt signaling at internal membrane compartments and a platform for potential therapeutic targeting of PI3K/Akt signaling in cancer and other diseases.
RESULTS
Agonist stimulated PI3,4,5P3 Generation and Akt Activation Occurs at Internal Membrane Compartments along Microtubules
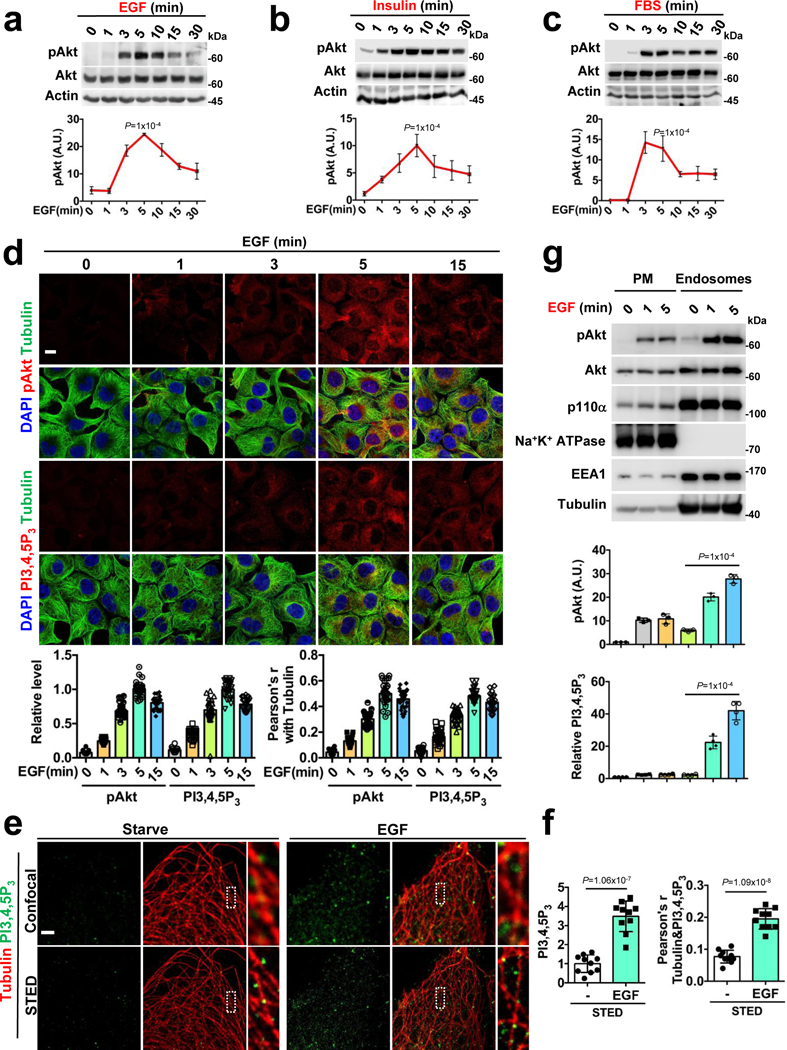
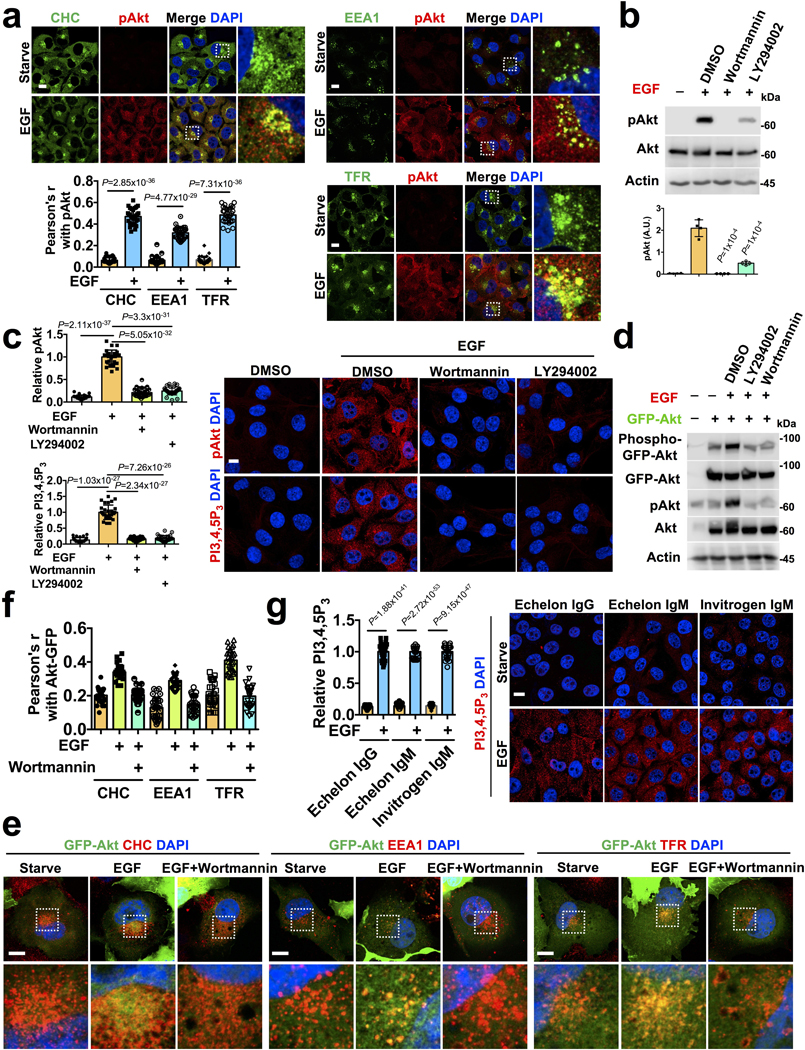
PI3K/Akt signaling is rapidly initiated upon stimulation of cells with multiple agonists and the peak of Akt activation was at ~5-minutes (Fig. 1a, b, c). The spatial localization of activated Akt was largely in vesicular structures along microtubules (Fig. 1d) that also co-localized with endosomal markers (Extended Data Fig. 1a). The inhibition of PI3K abolished the vesicular localization of activated Akt (Extended Data Fig. 1b, c). Furthermore, we observed increased activation and the co-localization of GFP-tagged Akt1 with clathrin vesicles, and PI3K inhibitor blocked this localization (Extended Data Fig. 1d, e, f) indicating the spatial and temporal activation of Akt is predominantly on intracellular endosomal compartments upon agonist stimulation.
FIGURE 1: Agonist-stimulated Akt Activation and PI3,4,5P3 Generation at Internal Membranes.
a, b, c, Activation of Akt upon agonist stimulation. The activation of Akt in MDA-MB-231 cells at different time points following EGF or insulin or FBS stimulation were examined by immunoblotting using phospho-Akt antibody. Error bars denote mean±SD; n=4 independent experiments
d, Spatial localization of activated Akt and PI3,4,5P3 upon EGF stimulation. MDA-MB-231 cells were fixed at different time points following EGF stimulation. Localization of activated Akt and PI3,4,5P3 along microtubules was examined by immunostaining with antibodies specific to phospho-Akt and PI3,4,5P3 respectively. The immunofluorescence signals of activated Akt and PI3,4,5P3 at different time points were quantified. Similarly, the co-localization of activated Akt and PI3,4,5P3 with tubulin were quantified by Pearson’s r. Scale bar, 5 μm; Error bars denote mean±SD; n=30 cells from representative experiments
e, f Super-resolution microscopy revealing spatial localization of PI3,4,5P3. MDA-MB-231 cells upon EGF stimulation were immuno-stained for PI3,4,5P3 and tubulin and processed by STED microscopy. PI3,4,5P3 signal was quantified in control vs. EGF stimulated cells. The relative level of PI3,4,5P3 signal and co-localization with tubulin quantified. Scale bar, 1 μm; Error bars denote mean±SD; n=10 cells from representative experiments.
g, Quantification of activated Akt and PI3,4,5P3 in plasma membrane and endosomes. MDA-MB-231 cells after EGF stimulation were harvested for subcellular fractionation. The activated Akt and PI3,4,5P3 were quantified in the plasma membrane and endosomal fractions by immunoblotting and ELISA, respectively, as described in “Methods”. Error bars denote mean±SD; n=3 independent experiments
Unprocessed_Western_Blots_Fig1; Statistical_Source_Data_Fig1
Consistent with Akt activation, the PI3,4,5P3 generation peaked at ~5-minutes and the PI3,4,5P3 was also localized to vesicular compartments along microtubules (Fig. 1d). Super-resolution STED microscopy also showed PI3,4,5P3 along microtubules (Fig. 1e, f) and PI3K inhibitors abolished the EGF-induced PI3,4,5P3 generation (Extended Data Fig. 1c). The use of two other antibodies specific for PI3,4,5P3 showed a similar pattern of PI3,4,5P3 (Extended Data Fig. 1g). Using a subcellular fractionation approach, we demonstrated induced PI3,4,5P3 generation and activated Akt in endosomal fractions of EGF-stimulated cells (Fig. 1g).
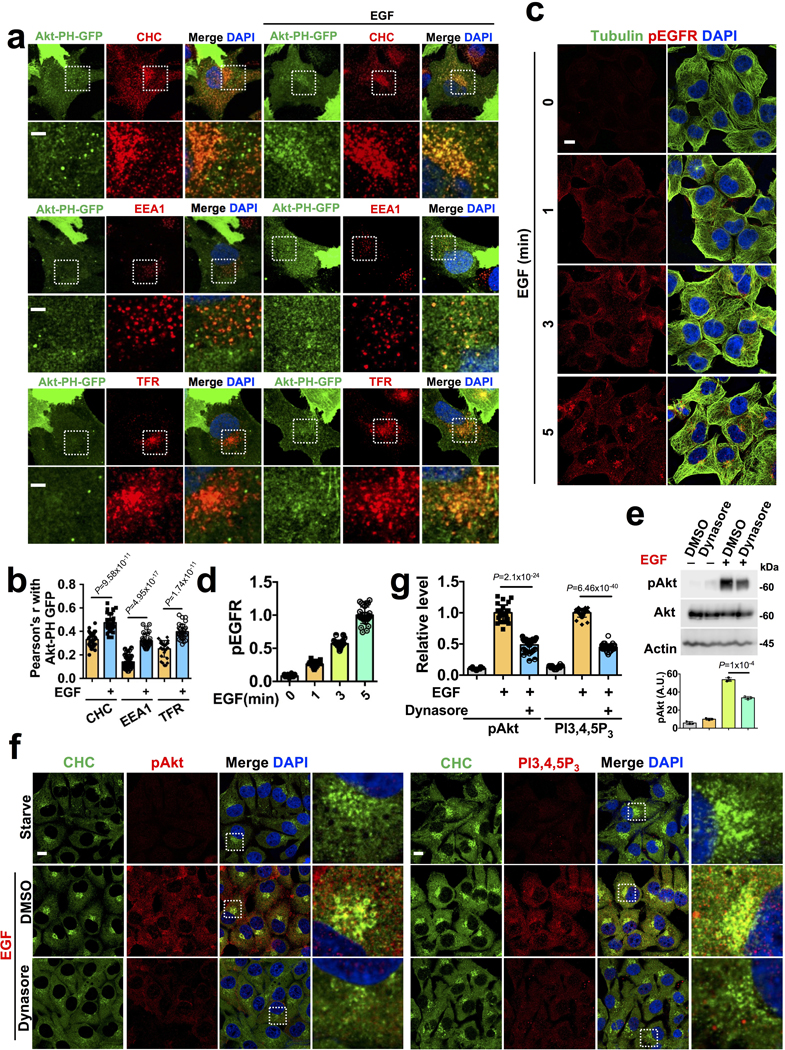
Pleckstrin homology (PH) domain-based fluorescence probes show the spatial generation of PI3,4,5P3 at the plasma membrane to a varying extent depending upon the modification of the PH domain19. We monitored PI3,4,5P3 generation using stably expressed GFP-PH domain of Akt1. Although, the plasma membrane recruitment of the GFP-PH domain upon EGF treatment was not clear, the co-localization with endosomal markers was obvious following EGF treatment (Extended Data Fig. 2a, b). These results indicate that PI3,4,5P3 generation upon agonist stimulation takes place predominantly at internal endosomal compartments.
Following EGF stimulation, the majority of activated EGFR was found in endosomal compartments at the 5-minute time point coinciding with the peak of PI3,4,5P3 generation and Akt activation (Extended Data Fig. 2c, d). PI3Kα also shows an increased association with EGFR (Fig. 4e). As multiple receptor tyrosine kinases including EGFR remain activated at endomembrane after their internalization20, the inhibition of activated EGFR endocytosis by dynamin inhibitor (Dynasore) inhibited Akt activation and blocked PI3,4,5P3 generation and co-localization with clathrin compartments (Extended Data Fig. 2e, f, g), indicating that PI3K/Akt signaling downstream of activated EGFR is dependent on PI3,4,5P3 generated at internal membrane compartments.
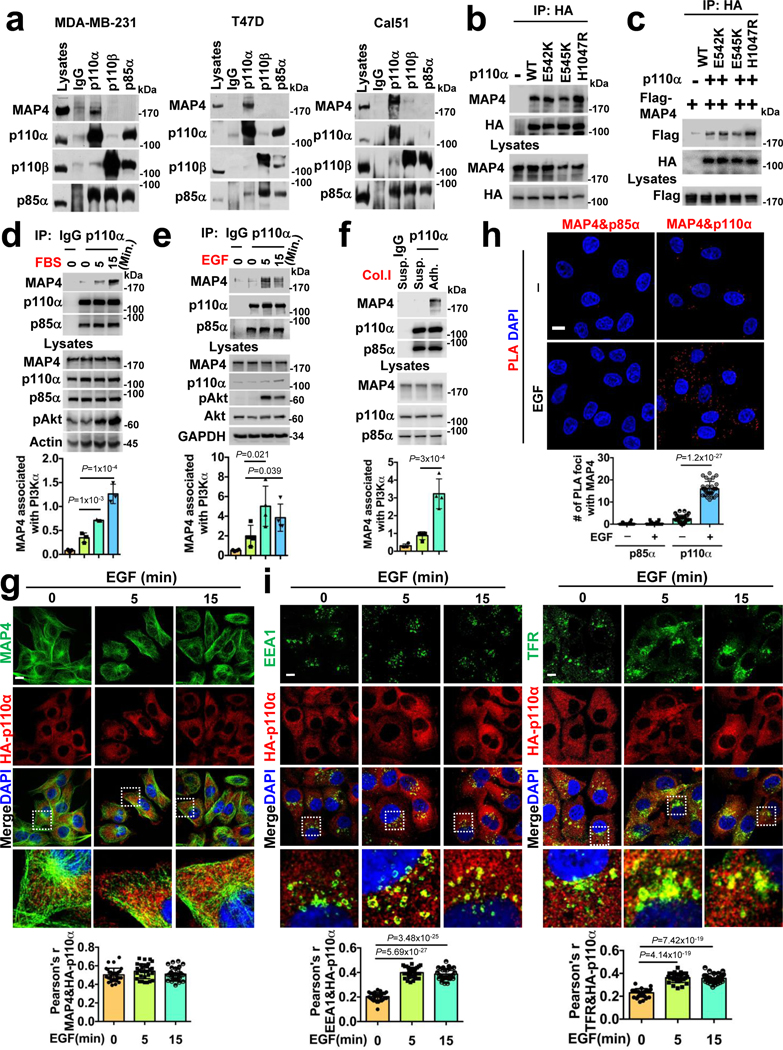
FIGURE 4: Agonists Stimulated in vivo Association of MAP4 and PI3Kα.
a, in vivo association of PI3Kα with MAP4. Antibodies specific to p110α or p110β or p85α were used to immunoprecipitate wild type (MDA-MB-231) or mutant forms of PI3Kα (T47D and Cal51) and co-immunoprecipitated MAP4 examined by immunoblotting. The immunoblot shown is the representative of multiple experiments.
b, Wild type or mutant forms of p110α equally co-immunoprecipitate MAP4. Stably expressed HA-p110α was immunoprecipitated using an anti-HA antibody followed by the examination of co-immunoprecipitated endogenous MAP4 by immunoblotting. The immunoblot shown is the representative of reproducible experiments.
c, Association between the ectopically expressed p110α and MAP4. HA-tagged p110α and Flag-tagged MAP4 were transiently co-expressed into HEK293 cells. Co-immunoprecipitated Flag-tagged MAP4 was examined by immunoblotting. The immunoblot shown is the representative of reproducible experiments.
d, e, Association between PI3Kα and MAP4 upon FBS or EGF stimulation. PI3Kα were immunoprecipitated using a p110α specific antibody and co-immunoprecipitated MAP4 examined by immunoblotting. Error bars denote mean±SD; n=3 (d), n=4 (e) independent experiments
f, Association between PI3Kα and MAP4 upon adhesion to Col.I. MDA-MB-231 cells suspended in serum-free medium were seeded into culture plates coated with type I collagen (Col.I). After harvesting the cells, PI3Kα were immunoprecipitated followed by examination of co-immunoprecipitated MAP4 by immunoblotting. Error bars denote mean±SD; n=4 independent experiments
g, PI3Kα distribution and co-localization with MAP4 upon EGF stimulation. MDA-MB-231 cells stably expressing HA-p110α were either serum-starved or stimulated with EGF before immunostaining with an anti-HA and MAP4 antibodies. The co-localization of MAP4 and HA-p110α were examined and quantified by Pearson’s r. Scale bar, 5 μm; Error bars denote mean±SD; n=30 cells from representative experiments
h, PLA demonstrates an increased association between PI3Kα and MAP4 upon EGF stimulation. EGF stimulated MDA-MB-231 cells were co-immunostained with antibodies specific to MAP4 and p85α or p110α and processed for PLA as described in “Methods”. Scale bar, 5 μm; Error bars denote mean±SD; n=30 cells from representative experiments
i, EGF stimulation promotes a subtle increase in PI3Kα localization in endosomes. MDA-MB-231 cells stably expressing HA-p110α were stimulated with EGF. Cells were fixed at different time points and immunostained using anti-HA and EEA1 or TFR antibodies. The co-localization of EEA1/TFR and HA-p110α was quantified by Pearson’s r. Scale bar, 5 μm; Error bars denote mean±SD; n=30 cells from representative experiments
Unprocessed_Western_Blots_Fig4; Statistical_Source_Data_Fig4
PI3Kα Localizes to Endosomal Compartments along Microtubules and is Activated by Receptor Tyrosine Kinase
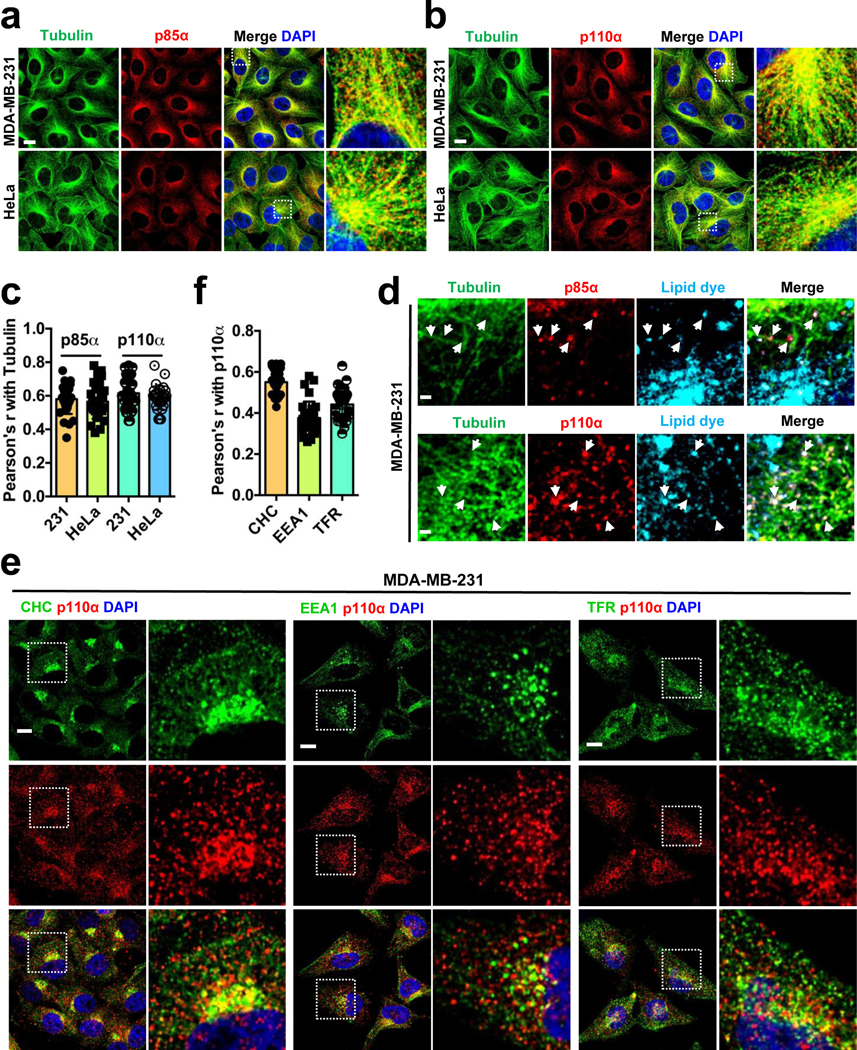
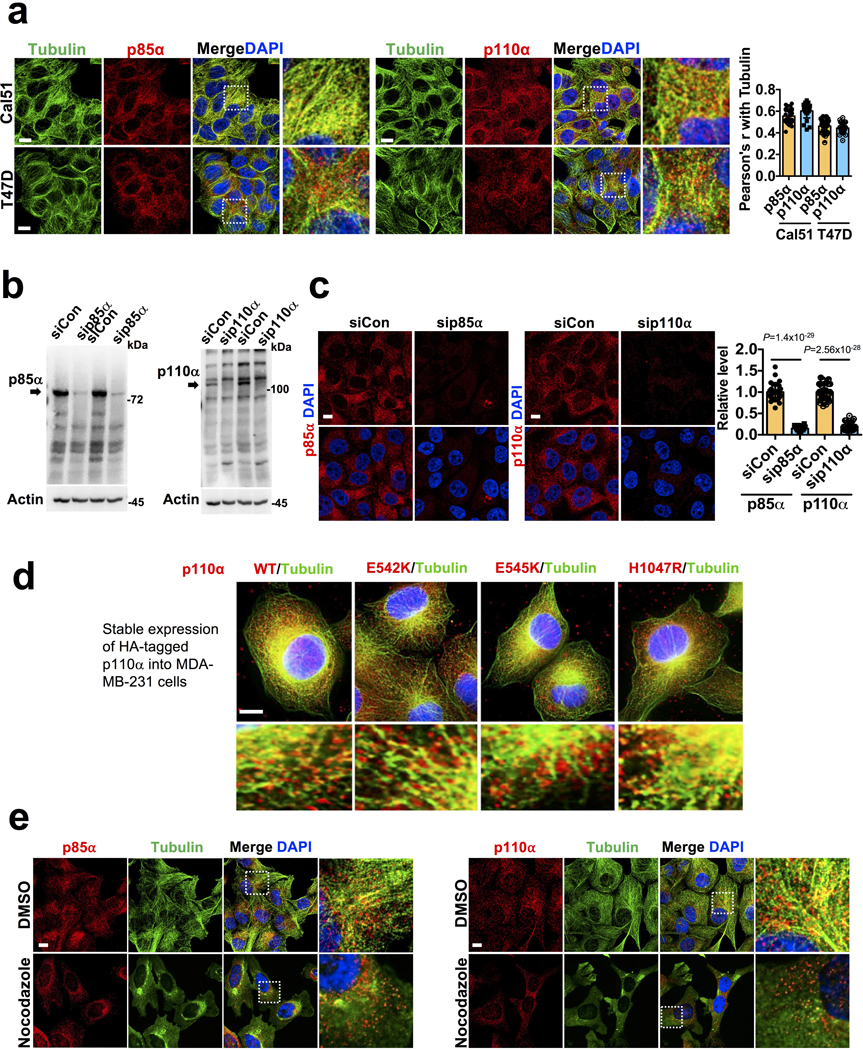
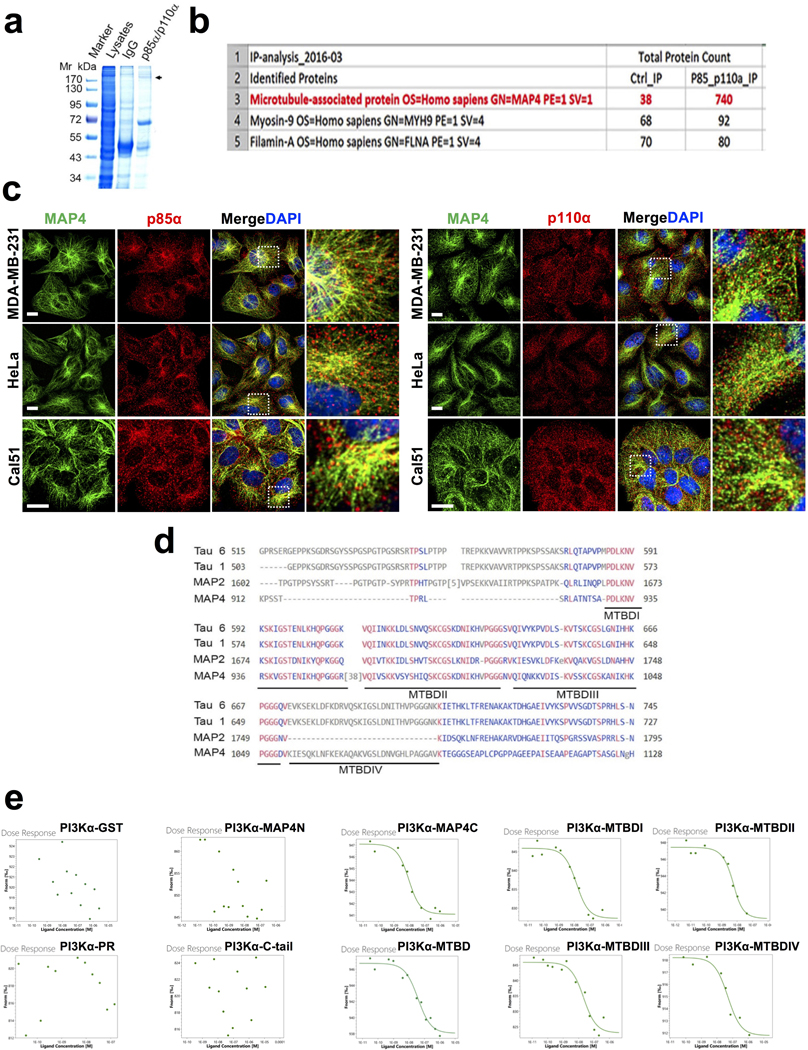
In class IA PI3K, PI3Kα is the primary isoform targeted and activated downstream of receptor tyrosine kinases2, 6. The investigation of the subcellular localization of PI3Kα by immunofluorescence microscopy using antibodies specific for p85α or p110α showed that PI3Kα localized to vesicular structures throughout the cell but concentrated around the microtubule-organizing center in different cell types examined (Fig. 2a, b, c; Extended Data Fig. 3a). Antibody specificity was validated after knocking down p85α or p110α (Extended Data Fig. 3b, c). These results are consistent with the localization of PI3K in fibroblasts12 and the endosomal localization of PTEN along microtubule tracts14. The ectopically expressed wild type or mutant form of p110α (HA-tagged) also showed the same localization (Extended Data Fig. 3d) in alignment with the localization of the endogenous PI3Kα.
FIGURE 2: PI3K〈 Localizes in Endosomal Vesicles along Microtubules.
a, b, c, Immunostaining of MDA-MB-231 and HeLa with p85α or p110α specific antibodies show the PI3Kα enzyme in small vesicle-like structures distributed along the microtubules. Cells growing on glass coverslips were fixed and processed for immunofluorescence study using either an anti-p85α or anti-p110α antibody as described in “Methods”. The co-localization of PI3Kα vesicles with tubulin was quantified by Pearson’s r. Scale bar, 5 μm; Error bars denote mean±SD; n=30 cells from representative experiments
d, Vesicles positive for p85α and p110α co-localize with membrane dye. Cells were labelled with membrane labeling lipophilic dye before seeding onto glass coverslips as described in “Methods”. Cells were processed for immunofluorescence staining for p85α or p110α as described above. Scale bar, 1 μm; The image shown is from representative experiments.
e, f, Vesicles positive for p110α staining co-stain with endosomal vesicle markers. MDA-MB-231 Cells were fixed and processed for immunofluorescence study using anti-p110α and CHC/EEA1/TFR antibodies as described in “Methods”. The co-localization of p110α vesicles with CHC/EEA1/TFR was quantified by Pearson’s r. Scale bar, 5 μm; Error bars denote mean±SD; n=30 cells from representative experiments
Statistical_Source_Data_Fig2
Cells labelled with a lipophilic dye to stain membranes demonstrated co-localization of p85α and p110α with a membrane vesicle location of PI3Kα (Fig. 2d). A fraction of PI3Kα vesicles also co-localized with markers including clathrin, EEA1 (early endosomes), and TFR (recycling endosomes) (Fig. 2e, f) suggesting PI3Kα association with endosomal vesicles and PI3Kα may be activated in these compartments by receptors that are internalized and progressing through endosomal compartments. Disruption of microtubule tracts resulted in PI3Kα reorganization around microtubule-organizing centers indicating that the integrity of microtubules is required for localization of PI3Kα (Extended Data Fig. 3e).
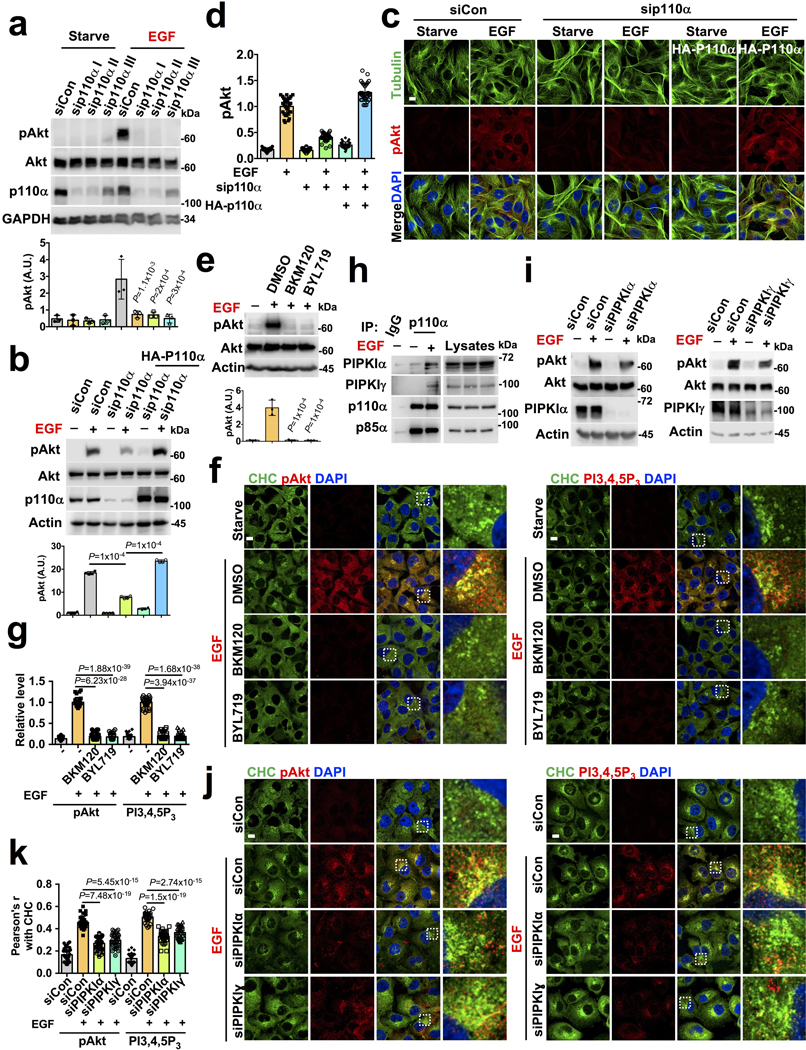
The contribution of PI3Kα in agonist-stimulated PI3K/Akt signaling was demonstrated by showing impaired EGF-stimulated Akt activation in PI3Kα knockdown cells (Extended Data Fig. 4a). The specificity of siRNA knockdown on Akt activation was validated by the rescue experiments with HA-tagged wild type p110α (Extended Data Fig. 4b, c, d). PI3Kα inhibitors (BKM120 and BYL719) impaired the EGF-stimulated Akt activation and the co-localization of activated Akt and PI3,4,5P3 with clathrin (Extended Data Fig. 2e, f, g) establishing PI3Kα role in PI3K/Akt signaling at an endomembrane system.
The amount of PI3,4,5P3 lipid messenger generated from PI4,5P2, even in stimulated conditions, is less than 2–4% of total PI4,5P2 indicating that a minor pool of PI4,5P2 or de novo synthesized PI4,5P2 would be sufficient for PI3,4,5P3 generation to drive endosomal PI3K/Akt signaling21, 22. As demonstrated previously, all components of the PI3K/Akt signaling pathway can also be assembled by IQGAP1, a molecular scaffold, to accomplish a concerted generation of PI3,4,5P321, 23 (see below). Different isoforms of type I PIP5K e.g. PIP5KIγ are present in endosomes via their interaction with clathrin-coated adaptor protein AP-1/AP-2, sorting nexin 4 and 5 (SNX4/SNX5), and the exocyst complex24. Consistently, an increased association of PI3Kα with PIP5KIα and PIP5KIγ upon EGF stimulation indicates PI3Kα function with PI4,5P2-generating enzymes in PI3K/Akt signaling (Extended Data Fig. 4h). PIPKIα or PIPKIγ knockdown partially phenocopied the that of the PI3Kα knockdown with diminished PI3,4,5P3 generation and Akt activation at clathrin vesicular compartments upon EGF stimulation (Extended Data Fig. 4i, j, k).
Microtubule-associated Protein 4 (MAP4) is an Interacting Partner of PI3Kα
The localization of PI3Kα and PI3,4,5P3 generation to internal vesicles within proximity of microtubules suggests a potential for PI3Kα interactors that could link PI3Kα to internal vesicles along the microtubules. The mass spectrometry analysis of PI3Kα immunoprecipitates (Extended Data Fig. 5a) identified microtubule-associated protein 4 (MAP4) (Extended Data Fig. 5b), a ubiquitously expressed non-neuronal microtubule-associated protein as an interacting partner of PI3Kα25. MAP4 decorates microtubules and regulates microtubule assembly and endosomal trafficking along microtubules18, 26.
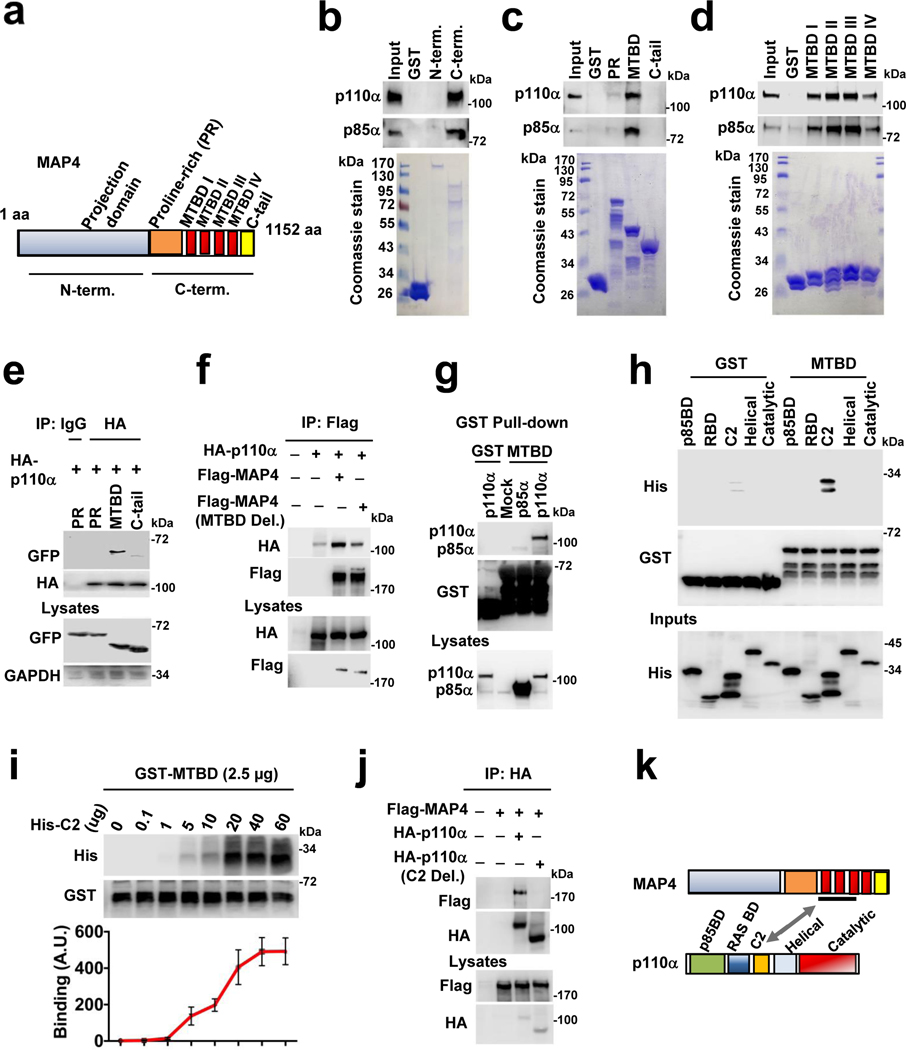
MAP4 contains an amino-terminal projection domain and a carboxyl-terminal domain that is divided into a proline-rich region (PR), microtubule-binding domain (MTBD), and tail region (C-tail) (Fig. 3a)27. The projection domain protrudes from the microtubule surface, whereas the carboxyl-terminal regions contain four microtubule-binding site repeats25. PI3Kα vesicles co-localize with MAP4 along the microtubules in all cell lines examined (Extended Data Fig. 5c). An in vitro binding assay utilizing a GST-fusion protein containing the projection domain or carboxyl-terminal domain of MAP4 and purified recombinant PI3Kα enzyme showed that the carboxyl-terminal domain directly interacted with PI3Kα (Fig. 3b). In vitro binding assay with different domains of the carboxy-terminal region showed that the MTBD is responsible for the PI3Kα interaction (Fig. 3c). The MTBD of MAP4, Tau, and MAP2 are highly conserved and contain 3–4 consecutive repeats of about 25 amino acids designated as MTBD I-IV (Extended Data Fig. 5d). The MTBD of MAP4 contains four repeats, and these repeats individually interact with PI3Kα (Fig. 3d) indicating that PI3K〈 binds multiple MTBD repeats of MAP4. Direct in vitro binding was also demonstrated by a microscale thermophoresis (MST) assay and a Kd value for each of these interactions was determined (Extended Data Fig. 3e; Supplementary Table 1 and 2). Next, we demonstrated the co-immunoprecipitation of the GFP-fusion protein of MTBD of MAP4 with HA-tagged p110α when co-expressed in HEK293 cells (Fig. 3e) and a MAP4 mutant deficient in the MTBD domain lost the association with p110α (Fig. 3f).
FIGURE 3: Microtubule-associated Protein 4 (MAP4) is an Interacting Partner of PI3Kα.
a, Schematic diagram of MAP4 protein showing N-terminal projection domain and C-terminal part that contains proline-rich (PR) region, MTBD and C-tail.
b, in vitro binding between MAP4 and PI3Kα. The in vitro binding assay by incubating purified GST-fusion protein of MAP4 with purified PI3Kα protein. PI3Kα protein associated with GST-fusion protein was detected by immunoblotting. The immunoblot shown is from representative experiments.
c, MTBD of MAP4 binds with PI3Kα. The in vitro binding of purified PI3Kα protein with GST-fusion protein of either PR, MTBD or C-tail binding was examined by immunoblotting. The immunoblot shown is from representative experiments.
d, Individual repeats of the MTBD of MAP4 participate in PI3Kα binding. The in vitro of purified PI3Kα protein with individual MTBD repeats was examined by immunoblotting. The immunoblot shown is the representative of multiple experiments.
e, GFP-tagged MTBD of MAP4 is co-immunoprecipitated with p110α. HEK293 cells were co-transfected with HA-tagged p110α and GFP-tagged PR or MTBD or C-tail of MAP4 and co-immunoprecipitated GFP-MTBD with immunoprecipitated p110α was examined by immunoblotting. The immunoblot shown is the representative of multiple experiments.
f, Loss of MTBD impairs MAP4 association with PI3Kα. HEK293 cells were co-transfected with Flag-tagged WT MAP4 or MTBD deletion mutant MAP4 along with HA-tagged p110α and co-immunoprecipitated HA-p110α with immunoprecipitated WT MAP4 or MTBD deletion mutant of MAP4 was examined by immunoblotting. The immunoblot shown is the representative of multiple experiments.
g, GST-pulldown assay demonstrates pulldown of p110α catalytic subunit by MTBD of MAP4. The GST or GST-fusion protein of MTBD of MAP4 was incubated with cell lysates prepared from HEK293 cells transfected with either Flag-tagged p85α or p110α and their pulldown by GST MTBD protein examined by immunoblotting. The immunoblot shown is the representative of multiple experiments.
h, C2 domain of p110α interacts with MTBD of MAP4 in vitro. The in vitro binding of different domains of p110α (p85BD, RBD, C2, helical, and catalytic) with GST MTBD was examined by immunoblotting. The immunoblot shown is the representative of reproducible experiments.
i, C2 domain and MTBD show saturation of binding. GST MTBD protein incubated with increasing concentration of His-tagged C2 domain with MTBD was examined by immunoblotting. Error bars denote mean±SD; n=3 independent experiments
j, Loss of C2 domain impairs p110α association with MAP4. HEK293 cells were co-transfected with HA-tagged WT p110α or C2 deletion mutant along with Flag-tagged MAP4 and co-immunoprecipitated MAP4 with immunoprecipitated p110α was examined by immunoblotting. The immunoblot shown is the representative of multiple experiments.
k, Schematic diagram demonstrating MTBD and C2 domain as interaction sites between MAP4 and PI3Kα.
Unprocessed_Western_Blots_Gel_Images_Fig3; Statistical_Source_Data_Fig3
PI3Kα is a heterodimer of the p85α adaptor and p110α catalytic subunits. GST-MTBD protein incubated with lysates prepared from Flag-p85α or Flag-p110α-transfected HEK293 cells co-isolated Flag-p110α more efficiently compared to Flag-p85α (Fig. 3g) indicating that p110α catalytic subunit is largely responsible for the interaction with MAP4. In vitro binding using His-tagged protein encompassing individual domains of p110α (p85BD, RAS, C2, helical, and catalytic) showed that C2 domain bound the MAP4 MTBD (Fig. 3h) and the interaction between GST-MTBD and His-C2 domain was saturable (Fig. 3i). The C2 domain in p110α is also a contact site for the p85 iSH2 domain28, 29. A p110α deletion mutant lacking the C2 domain lost the association with the MAP4 protein in co-immunoprecipitation assays (Fig. 3j), indicating that MAP4 interacts with PI3Kα via MTBD domain in MAP4 and C2 domain in the p110α catalytic subunit (Fig. 3k).
Regulation of the MAP4 and PI3Kα Interaction at Endosomal Compartments
In vivo association between MAP4 and PI3Kα was examined in cells expressing wild type or mutant p110α by co-immunoprecipitation with antibodies specific for p110α or p110β or p85α (Fig. 4a). The lack of MAP4 co-immunoprecipitation by p85α antibody may be due to a steric issue or preference of MAP4 for p110α over p85α. Further, wild type or mutant forms of p110α stably expressed in MDA-MB-231 cells all co-immunoprecipitated the endogenous MAP4 (Fig. 4b). The Flag-tagged MAP4 and HA-tagged wild type or mutant p110α all co-immunoprecipitated confirming that the MAP4 association with PI3Kα was independent of p110α mutational status (Fig. 4c).
The regulation of the MAP4 and PI3Kα association by agonist stimulation was examined by stimulation with FBS, EGF, and upon adhesion to type I collagen (Col I) all of which stimulate PI3K/Akt signaling and the interaction (Fig. 4d–f). To gain insights into the spatial localization of PI3Kα and MAP4 upon agonist stimulation, the subcellular distribution of PI3Kα and MAP4 were examined after EGF stimulation. MAP4 and PI3Kα were largely concentrated around the microtubule-organizing center and along the microtubule tracts, and we could not observe any change in the distribution or co-localization of PI3Kα with MAP4 by conventional immunofluorescence microscopy (Fig. 4g). Yet, a proximity ligation assay (PLA) detected a dramatic increase in the interaction between MAP4 and the PI3Kα p110α but not the p85 subunit that may be too distant (Fig. 4h). There was also increased PI3Kα co-localization with endosomal markers (EEA1 and TFR) upon EGF stimulation (Fig. 4i). These data indicate that a fraction of PI3Kα vesicles localize with endosomes putatively interacting with MAP4 upon activation by agonist stimulation.
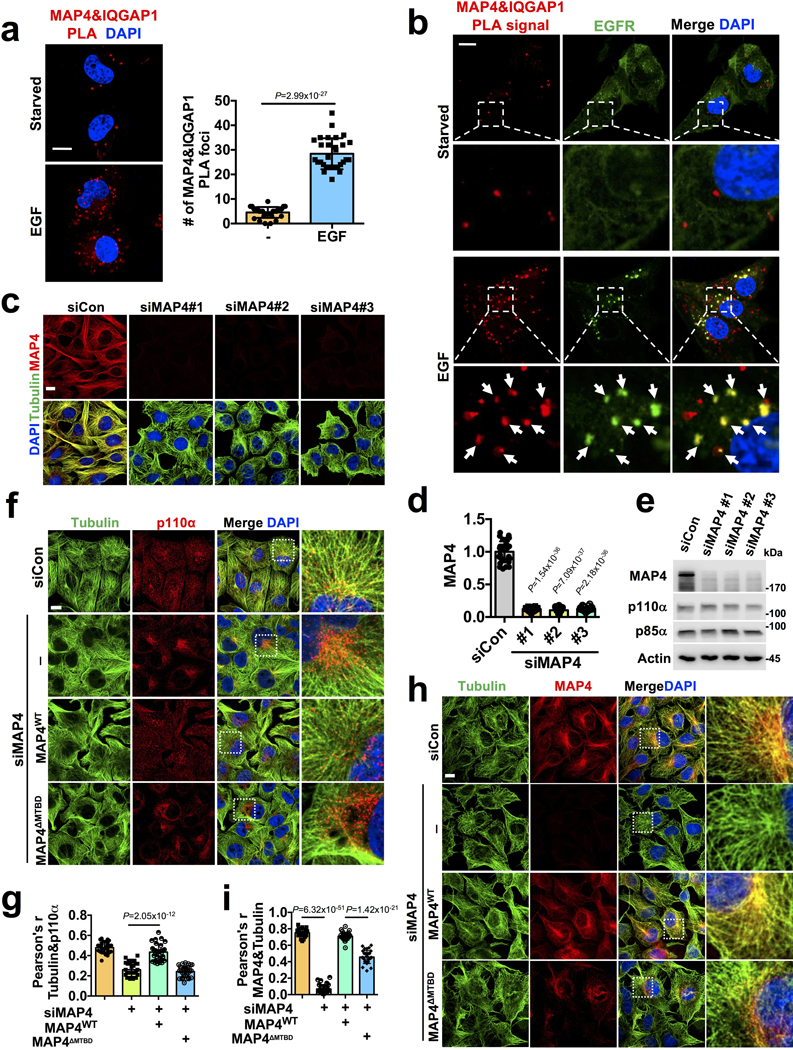
EGF stimulation also promoted MAP4 association with the scaffold IQGAP1 that directly associates with PIP5KIα and PIP5KIγ that synthesize PI4,5P2 (Extended Data Fig. 6a) and the MAP4 - IQGAP1 PLA signal also co-localized with EGFR (Extended Data Fig. 6b). As IQGAP1 upon agonist stimulation scaffolds all of the enzymes for PI3,4,5P3 synthesis 21 and the MAP4 - IQGAP1 PLA signal co-localizes with activated EGFR, this indicates a mechanism for the concerted generation of PI3,4,5P3 at endosomes.
MAP4 is Required for PI3Kα Localization to Endosomes and Association with Activated Receptors
PI3Kα activation requires interaction with agonist-activated receptor kinases8. These receptors are activated at the plasma membrane and remain active after internalization and sorting to endosomes, and are competent to recruit downstream signaling molecules in the endosomes20, 30. Endosomal trafficking of different cell surface receptors to and from the plasma membrane is guided by microtubules31, 32 suggesting PI3Kα association with MAP4 may regulate PI3Kα distribution along microtubules and its subsequent association with activated receptor kinases at endosomes.
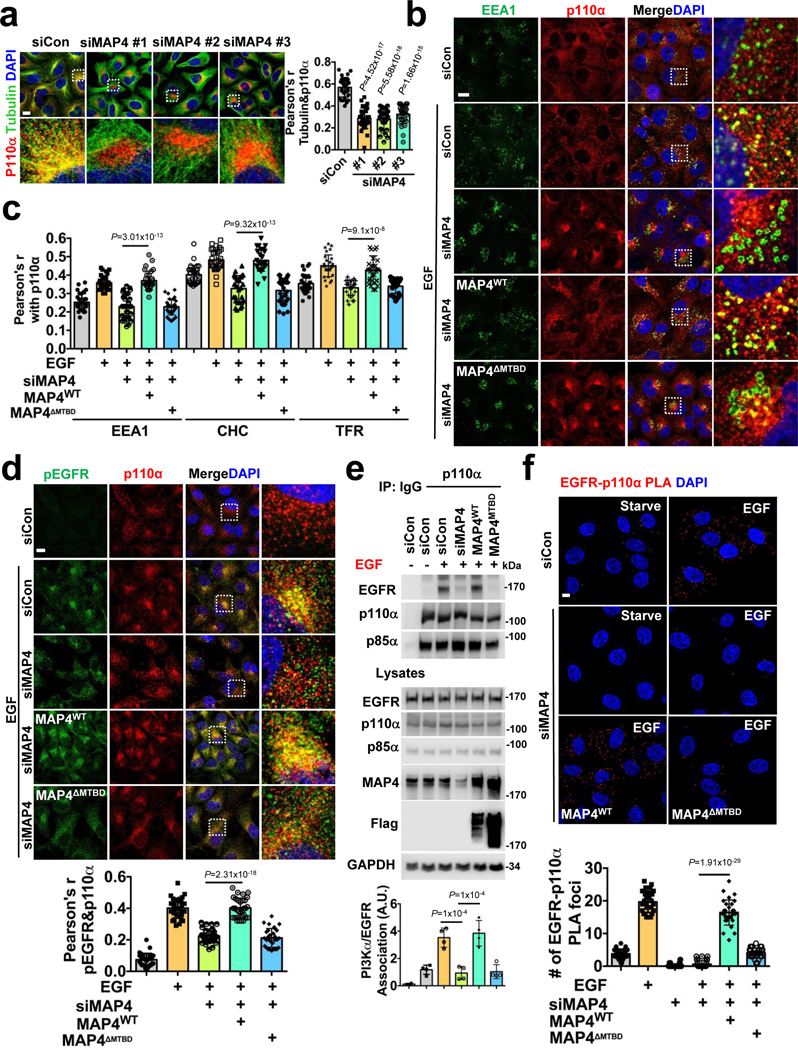
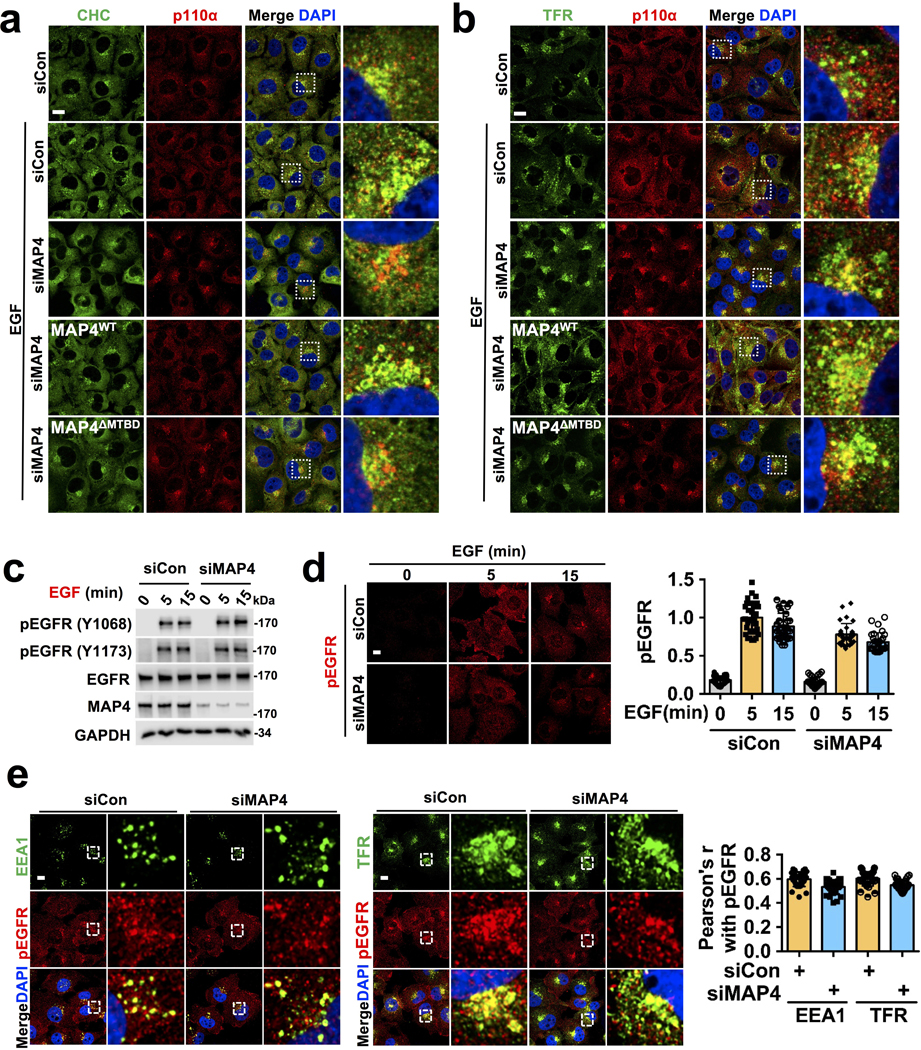
Knockdown of MAP4 expression resulted in loss of normal PI3Kα distribution and co-localization with microtubules (Fig. 5a; Extended Data Fig. 6c, d, e) indicating that MAP4 serves as a linker for PI3Kα distribution along microtubules. Wild type MAP4 but not MTBD deletion mutant of MAP4 rescued the PI3Kα alignment along microtubules (Extended Data Fig. 6f, g) and the MTBD deletion mutant MAP4 no longer distributes along microtubules (Extended Data Fig. 6h, i). In cells lacking MAP4, PI3Kα co-localization with clathrin, EEA1, or TFR vesicles upon EGF stimulation were impaired (Fig. 5b, c; Extended Data Fig. 7a, b), and wild type MAP4 but not MTBD deletion mutant of MAP4 restored PI3Kα co-localization with endosomes (Fig. 5b, c; Extended Data Fig. 7a, b). These data indicate that MAP4 serves as a molecular linker to recruit PI3Kα to microtubules and endosomal membrane compartments.
FIGURE 5: MAP4 is Required for PI3Kα Vesicle Distribution along Microtubules and its Association with Activated Receptors.
a, MAP4 loss affects PI3Kα vesicle distribution along microtubules. Three different individual siRNAs were used for MAP4 knockdown in MDA-MB-231 cells followed by immunofluorescence staining. The co-localization of p110α vesicles and tubulin were quantified by Pearson’s r. Scale bar, 5 μm; Error bars denote mean±SD; n=30 cells from representative experiments
b, c, MAP4 is required for the endosomal localization of PI3Kα vesicles. The siRNAs targeting the 3’ UTR region of MAP4 (siMAP4#3) were used to knockdown endogenous MAP4 in MDA-MB-231 cells expressing WT or MTBD deletion mutant of MAP4. 48–72 hrs post-transfection, cells were stimulated with EGF and processed for immunofluorescence study using antibodies specific for endogenous p110α and endosomal markers (EEA1). Co-localization with CHC and TFR is shown in Figure S7a-b. The co-localization of p110α and EEA1/CHC/TFR was quantified by Pearson’s r. Scale bar, 5 μm; Error bars denote mean±SD, n=30 cells from representative experiments
d, e, f, MAP4 knockdown impairs the association of PI3Kα with activated EGFR. siRNAs targeting the 3’ UTR region of MAP4 were used to knockdown endogenous MAP4 in MDA-MB-231 cells expressing WT or the MTBD deletion mutant of MAP4. 48–72 hrs post-transfection, cells were stimulated with EGF and processed for immunofluorescence study using antibodies specific for endogenous p110α and activated EGFR. The co-localization between p110α and pEGFR was quantified by Pearson’s r. Similarly, the effect of MAP4 knockdown in the association of PI3Kα with EGFR was analyzed by co-immunoprecipitation assay and proximity ligation assay. Scale bar, 5 μm; Error bars denote mean±SD; n=30 cells from representative experiments (d and f), n=4 independent experiments (e)
Unprocessed_Western_Blots_Fig5; Statistical_Source_Data_Fig5
The co-localization of PI3Kα with EGF activated EGFR was lost in MAP4 knockdown cells (Fig. 5d), but there was no detectable change in the activation level of EGFR or its localization with endosomal markers in the MAP4 knockdown cells (Extended Data Fig. 7c, d, e). Co-immunoprecipitation showed a loss of association of PI3Kα with EGF receptor in MAP4 knockdown cells upon EGF stimulation (Fig. 5e), and wild type MAP4 but not the MTBD deletion mutant rescued the PI3Kα co-localization and association with EGFR and were supported by PLA (Fig. 5f). These results indicate that MAP4 serves as a molecular linker required for the PI3Kα vesicles recruitment along microtubules for its interaction with activated EGFR.
MAP4 is Required for Agonist Stimulated Generation of PI3,4,5P3
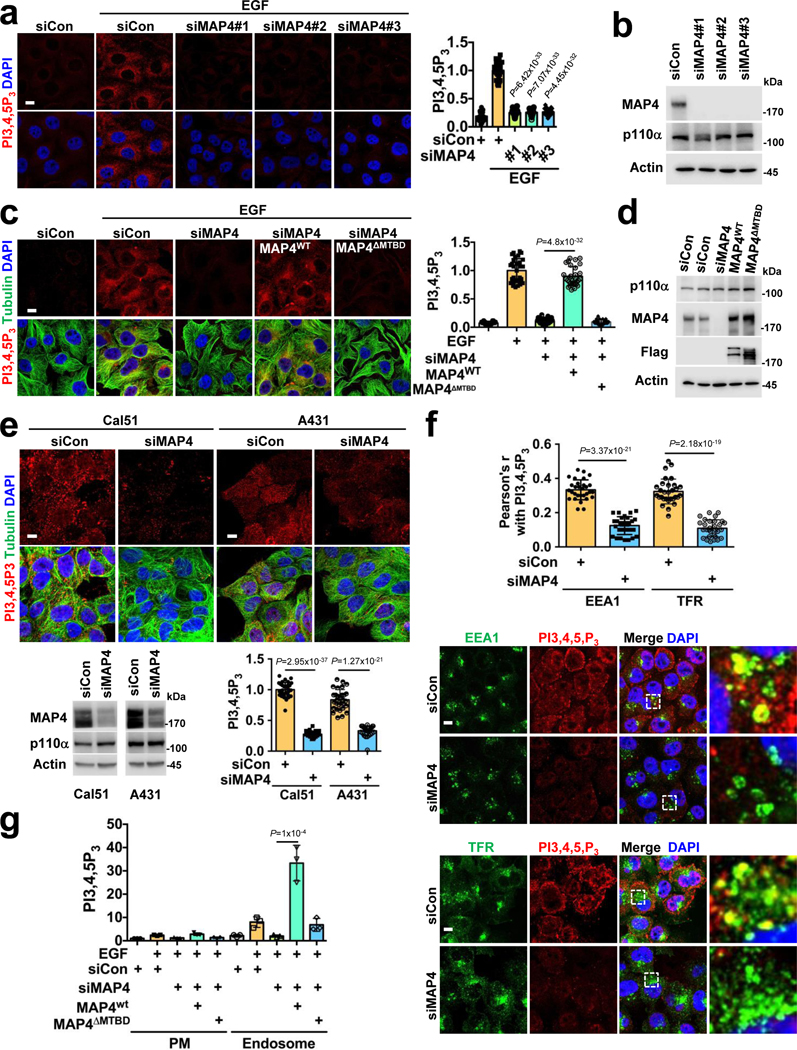
MAP4 regulation of the PI3Kα interaction with activated EGFR indicated its role in agonist-stimulated PI3,4,5P3 generation. MAP4 knockdown resulted in loss of EGF-stimulated PI3,4,5P3 generation (Fig. 6a, b), further wild type MAP4 but not the MTBD deletion mutant rescued PI3,4,5P3 generation (Fig. 6c, d). These indicate the necessity of the MAP4 interaction with PI3Kα for EGF-stimulated PI3,4,5P3 generation. Significantly, MAP4 loss in cells that express constitutively active PI3Kα mutant resulted in a loss of PI3,4,5P3 generation indicating that even constitutively active PI3Kα mutants require MAP4 for it signaling (Fig. 6e). A431 cells that express a high level of EGFR but wild type PI3Kα, the knockdown of MAP4 also resulted in a loss of PI3,4,5P3 generation (Fig. 6e). MAP4 was also required for PI3,4,5P3 generation upon adhesion to type I collagen (Col I.) (Extended Data Fig. 8b) indicating that MAP4 couples different signals to PI3,4,5P3 generation.
Figure 6: MAP4 is Required for PI3,4,5P3 Generation.
a, b, MAP4 knockdown impairs EGF stimulated PI3,4,5P3 generation. Three different siRNAs were used individually to knockdown MAP4 in MDA-MB-231 cells. EGF induced PI3,4,5P3 was analyzed by immunofluorescence microscopy and MAP4 knockdown by immunoblotting. Scale bar, 5 μm; Error bars denote mean±SD; n=30 cells from representative experiments
c, d, Rescue of EGF induced PI3,4,5P3 generation. siMAP4#3 was used to knockdown endogenous MAP4 in MDA-MB-231 cells expressing WT or the MTBD deletion mutant of MAP4. 48–72 hrs post-transfection, cells were stimulated with EGF and induced PI3,4,5P3 was analyzed by immunofluorescence microscopy. The knockdown of endogenous MAP4 and expression of ectopically expressed wild type or mutant form of MAP4 were analyzed by immunoblotting. Scale bar; 5 μm; Error bars denote mean±SD; n=30 cells from representative experiments
e, Effect of MAP4 knockdown in PI3Kα mutant expressing cells (Cal51) and EGFR overexpressing cells (A431). siRNA was used to knockdown endogenous MAP4 (siMAP4#1) and the effect on PI3,4,5P3 was analyzed by immunofluorescence microscopy. The knockdown of MAP4 was examined by immunoblotting. Scale bar, 5 μm; Error bars denote mean±SD, n=30 cells from representative experiments
f, Effect of MAP4 knockdown in PI3,4,5P3 generation in endosomes. 48–72 hrs post-transfection with siRNA for MAP4 knockdown, cells were lifted and allowed to adhere to coverslips coated with Col.I for 30 minutes. Then, cells were immunostained with antibodies specific for PI3,4,5P3 and endosomal markers (EEA1 and TFR). PI3,4,5P3 co-localized with endosomes were analyzed by immunofluorescence microscopy. Scale bar, 5 μm; Error bars denote mean±SD; n=30 cells from representative experiments
g, Analysis of EGF induced PI3,4,5P3 generation in MAP4 knockdown cells by subcellular fractionation. siMAP4#3 was used to knockdown endogenous MAP4 in MDA-MB-231 cells or its transfectants expressing WT or MTBD deletion mutant of MAP4. 48–72 hrs post-transfection, cells were stimulated with EGF for 5 minutes and harvested for subcellular fractionation. The PI3,4,5P3 generated in plasma membrane vs. endosomal fractions were analyzed by an ELISA assay as indicated in “Method”. Error bars denote mean±SD; n=3 independent experiments
Unprocessed_Western_Blots_Fig6; Statistical_Source_Data_Fig6
The effect of MAP4 knockdown on PI3,4,5P3 generation at endosomes was quantified by examining PI3,4,5P3 co-localized with endosomal markers, EEA1, and TFR in control and MAP4 knockdown cells (Fig. 6f). We also isolated endosomes by subcellular fractionation and quantified the PI3,4,5P3 generation in these compartments for control or MAP4 knockdown cells stimulated or not by EGF (Fig. 6g). The loss of MAP4 showed a loss of PI3,4,5P3 generation in endosomal fractions, and wild type MAP4 but not the MTBD deletion mutant rescued the PI3,4,5P3 generation (Fig. 6g) and this confirmed the cell biological data.
MAP4 is Required for Akt Activation, Cell Proliferation, and Invasion
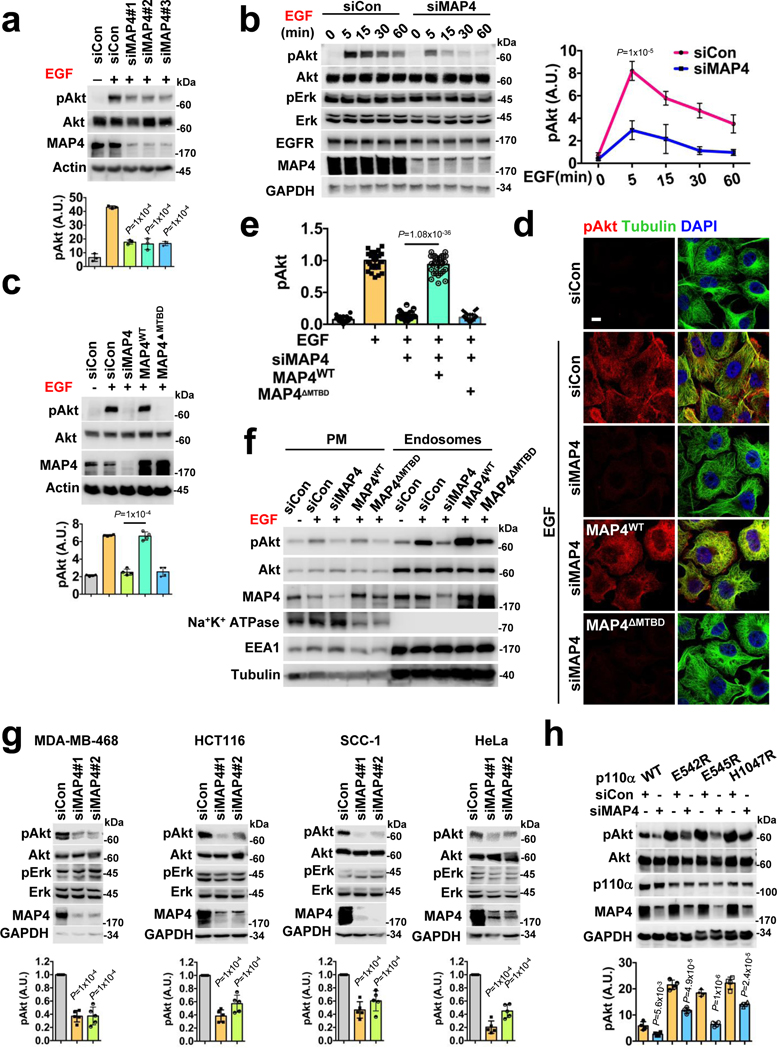
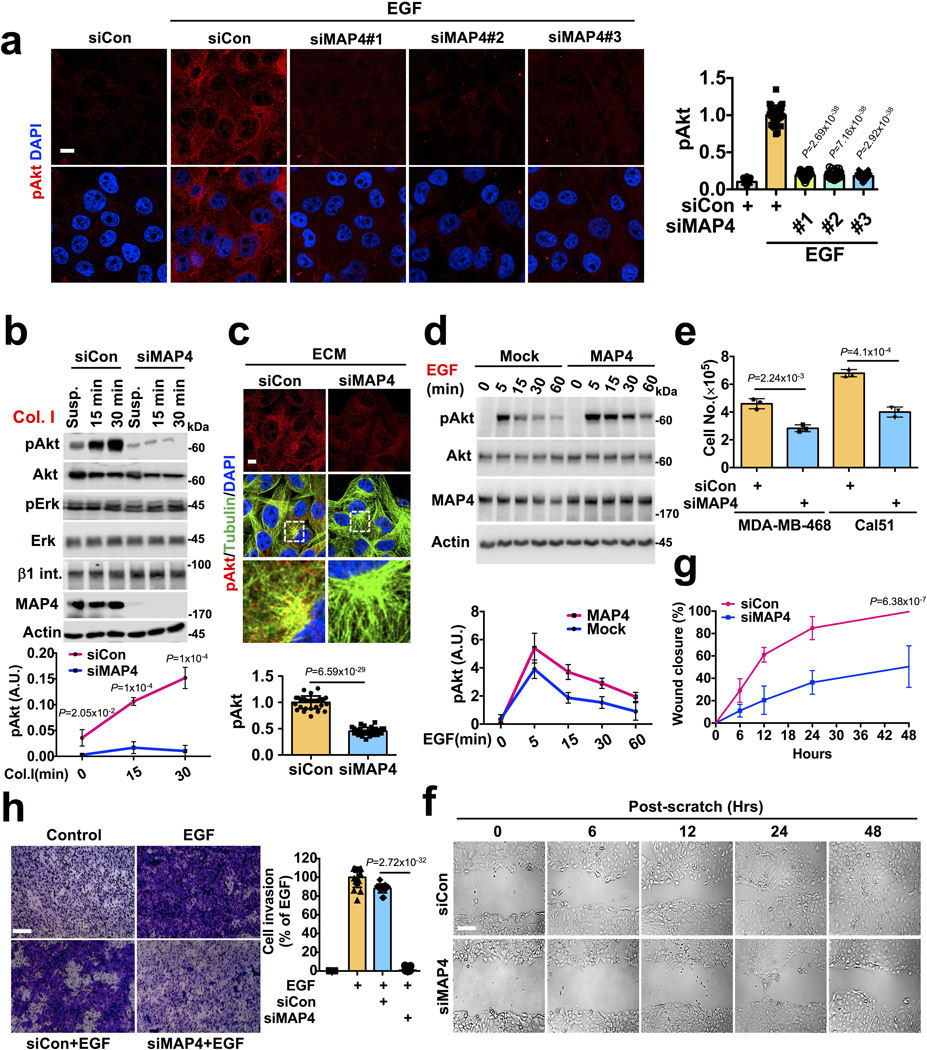
Agonist-stimulated PI3,4,5P3 generation regulates multiple effectors including the Akt pathway and we examined the spatial and temporal activation of Akt. MAP4 knockdown impaired EGF-stimulated Akt activation also temporal activation (Fig. 7a, b; Extended Data Fig. 8a). MAP4 was also required for Akt activation upon adhesion to Col. I (Extended Data Fig. 8b, c). Ectopically expressed wild type MAP4 but not the MTBD deletion mutant completely rescued the MAP4 knockdown phenotype in EGF stimulated Akt activation (Fig. 7c). Modest MAP4 overexpression also increased Akt activation (Extended Data Fig. 8d). The effect of MAP4 knockdown in Akt activation at endosomes was demonstrated after subcellular fractionation of EGF-stimulated cells (Fig. 7f) and immunofluorescence study showed the loss of the activated Akt close to microtubules in MAP4 knockdown cells (Fig. 7d, e).
FIGURE 7: MAP4 is Required for PI3K/Akt Signaling.
a, MAP4 loss impairs activation of Akt downstream of EGFR. Three different siRNAs individually used to knockdown MAP4 in MDA-MB-231 cells followed by examination of EGF induced Akt activation by immunoblotting. Error bars denote mean±SD; n=3 independent experiments
b, The activation level of Akt in MAP4 knockdown cells at different time points. 48–72 hrs post-siMAP4#1 transfection, the activation level of Akt were examined after EGF stimulation at different time points. Error bars denote mean±SD; n=5 independent experiments
c, d, e, Rescue of EGF induced Akt activation in MAP4 knockdown cells. siMAP4#3 was used to knockdown endogenous MAP4 in MDA-MB-231 cells expressing WT or the MTBD deletion mutant of MAP4. 48–72 hrs post-transfection, cells were stimulated with EGF for 5 minutes and activation level of Akt examined by immunoblotting or immunofluorescence microscopy. The image shown is the representative of multiple reproducible experiments. Scale bar, μm; Error bars denote mean±SD; n=4 independent experiments (c), n=30 cells from representative experiments (e)
f, Analysis of EGF induced Akt activation in MAP4 knockdown cells by subcellular fractionation. siMAP4#3 was used to knockdown endogenous MAP4 in MDA-MB-231 cells expressing WT or the MTBD deletion mutant of MAP4. 48–72 hrs post-transfection, cells were stimulated with EGF and harvested for subcellular fractions followed by examination of activated Akt in plasma membrane vs. endosomal fractions by immunoblotting. The data shown is the representative of multiple experiments.
g, MAP4 knockdown impairs the activation level of Akt in different cell types. MDA-MB-468, HCT116, SCC-1, and HeLa cells were transfected with siMAP4#1 or siMAP4#2. The cells were harvested 72 hrs-post siRNA transfection and activation level of Akt examined by immunoblotting. Error bars denote mean±SD; n=5 independent experiments
h, MAP4 knockdown impairs the activation level of Akt in MDA-MB-231 cells ectopically expressing the wild type or mutant form of p110α. The cells were transfected with siMAP4#1 and harvested 72 hrs-post transfection to examine the activation level of Akt by immunoblotting. Error bars denote mean±SD; n=4 independent experiments
Unprocessed_Western_Blots_Fig7; Statistical_Source_Data_Fig7
Deregulated PI3K/Akt signaling in cancer largely results from either activating mutation in PI3Kα or PTEN loss. MAP4 knockdown impaired the activation level of Akt in MDA-MB-468 (PTEN null), HCT116 (activating K-Ras and PIK3CA mutations)33, SCC1 and HeLa (normal but overexpressed PI3Kα)34 cells (Fig. 7g) and the cells ectopically overexpressing activating hot-spot mutants forms of p110α (Fig. 7h). As PI3K/Akt signaling is a key pathway in cell proliferation, cell survival, and cell invasion2, 3, and MAP4 is overexpressed in cancers35–37, the loss of MAP4 impacted proliferation and invasion of all cell types examined (Extended Data Fig. 8e, f, g, h).
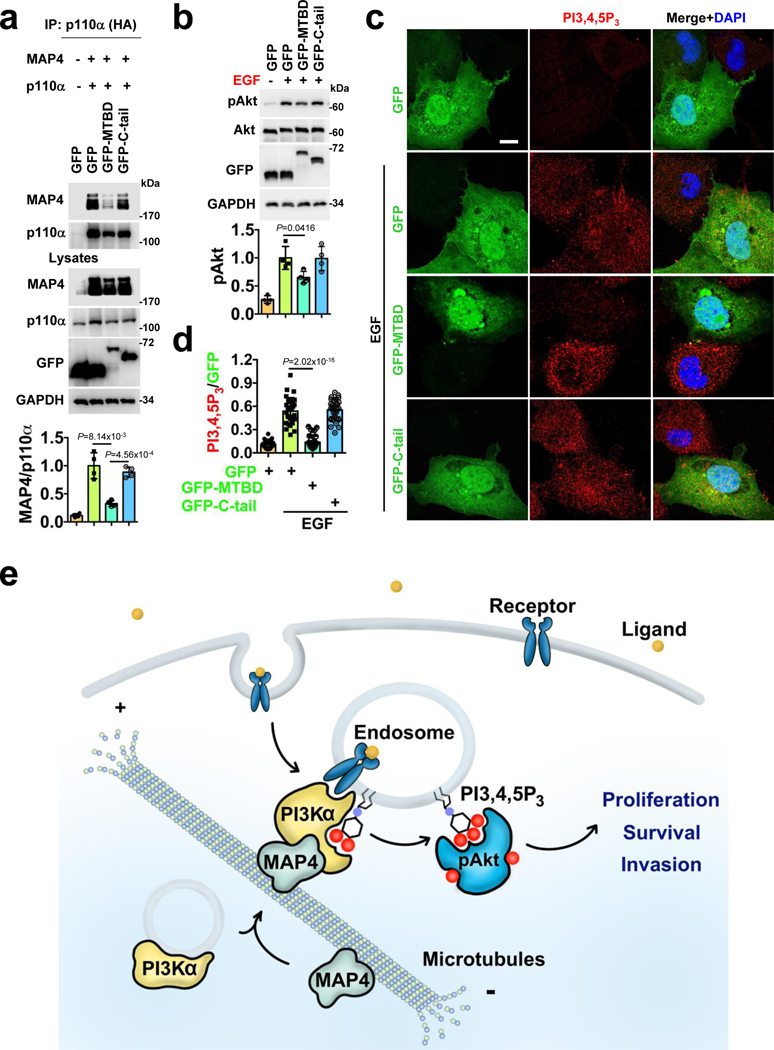
Finally, we disrupted the in vivo complex of MAP4-PI3Kα in agonist-stimulated Akt activation and PI3,4,5P3 generation. The MTBD encompasses the PI3Kα-interacting sites in MAP4, the overexpression of GFP-MTBD but not GFP-C-tail blocked the PI3Kα association with MAP4 (Fig. 8a) and EGF-induced PI3,4,5P3 generation (Fig. 8c, d). Consistently, the activation of Akt in EGF-stimulated cells that expressed the GFP-MTBD was also reduced (Fig. 8b) indicating the necessity of the MAP4 and PI3Kα complex integrity in agonist-stimulated PI3K/Akt signaling.
Figure 8: Integrity of MAP4 and PI3Kα Interaction Required for PI3K/Akt signaling.
a, Overexpression of MTBD impairs MAP4 association with PI3Kα. MAP4 and HA-tagged p110α were co-transfected along with empty GFP vector or GFP-MTBD or GFP-C-tail into Cos-7 cells. 24–48 hrs post-transfection, p110α were immunoprecipitated and co-immunoprecipitated MAP4 examined by immunoblotting. Error bars denote mean±SD; n=4 independent experiments
b, c, d, Overexpression of MTBD impairs EGF stimulated Akt activation and PI3,4,5P3 generation. Cos-7 cells transfected with the empty GFP vector or GFP-MTBD or GFP-C-tail were stimulated with EGF 24–48 hrs post-transfection. Then, the activation level of Akt was examined by immunoblotting. PI3,4,5P3 generated were examined by immunofluorescence staining and PI3,4,5P3 signals were quantified in GFP expressing cells. The image shown is the representative of multiple reproducible experiments. Scale bar, 5 μm; Error bars denote mean±SD; n=4 independent experiments (b), n=30 cells from representative experiments (d)
e, Schematic diagram depicting MAP4 regulation of endosomal PI3K/Akt signaling. PI3Kα is distributed in small vesicles along microtubule tracts and a subfraction of PI3K〈 vesicles also remain associated with endosomal vesicles. The direct interaction of PI3Kα with MAP4 facilitates PI3Kα distribution along microtubule tracts to and from the plasma membrane encountering agonist activated receptor tyrosine kinases that are also in route to the endosomal pathways, and this enables PI3Kα activation in endosomal compartments. The loss of MAP4 perturbs PI3Kα recruitment along microtubule tracts and endosomes, and its association with activated receptor complexes, all contributing to impaired PI3Kα activation, PI3,4,5P3 generation and PI3K/Akt signaling predominantly at endosomal compartments.
Unprocessed_Western_Blots_Fig8; Statistical_Source_Data_Fig8
DISCUSSION
The canonical view of agonist activated PI3K/Akt signaling depicts PI3,4,5P3 generation and Akt activation at the plasma membrane2, 5. Yet, there is a lack of evidence supporting this dogma except for studies utilizing lipid biosensors that depict PI3,4,5P3 generation at the plasma membrane 15–17, 38. There seems also a lack of evidence showing the spatial targeting of PI3Kα to activated receptor tyrosine kinases at the plasma membrane. Some early studies intimated PI3K kinase activity and PI3,4,5P3 generation at endomembrane compartments13, 16, 39, but without a defined underlying mechanism.
Here, we clarify these lingering dilemmas by demonstrating the residency of PI3Kα on internal membrane vesicles aligned along microtubules via MAP4 interaction. Endosomal trafficking of receptors progresses largely along microtubules32 thus, putative PI3Kα membrane vesicles linked to microtubules via MAP4 facilitates their encounter with activated receptor complexes resulting in PI3Kα activation, PI3,4,5P3 generation and Akt activation at endosomes. Upon loss of MAP4, PI3Kα vesicles no longer align with microtubules and the PI3Kα interaction with activated receptors at endosomes is severed resulting in lost PI3Kα activation, PI3,4,5P3 generation and Akt activation. Consistently, the majority of downstream target molecules of the PI3K signaling function at endomembranes40, 41 and emerging studies point out the necessity of continuous engagement of Akt with PI3,4,5P3 for its activation16 supporting localization in the same compartment with the PI3K. The key PI3Kα/Akt target mTOR is also localized to late endosomes40, 42, 43. There are other PI3,4,5P3 effectors also localized to endomembrane40, 42, 43.
The iSH2 domain in the p85 adaptor and C2 domain in the PI3Kα p110α catalytic is thought to interact with membranes from a structural perspective 29. MAP4 interacts with the C2 domain and this is required for PI3Kα endomembrane targeting but not necessarily membrane association. Growth factor stimulation promotes a fraction of PI3Kα incorporation into clathrin, EEA1 and TFR-positive compartments, and these compartments are linked to the microtubule and endosomal systems. As receptor tyrosine kinases upon agonist stimulation undergo rapid endocytosis from the plasma membrane and remain active in endosomes 9, 44, MAP4 putatively functions to guide PI3Kα to activated receptors in the endosomal network and this leads PI3,4,5P3 generation and Akt activation beyond the plasma membrane. Temporally, the times at which PI3,4,5P3 generation and Akt activation plateaus coincide well with activated EGFR localization predominantly at internal compartments.
The predominance of PI4,5P2 at the plasma membrane raises the question of its availability in endomembrane system for PI3,4,5P3 generation 5, 21, 44. Yet, the endomembrane network is diverse in phosphoinositide content and several studies indicate the presence of PI4,5P2 in endomembrane21, 44–51. Importantly, PI3,4,5P3 generation accounts for only a minute fraction of the PI4,5P2 even upon stimulation and PI3Kα associated with PIP5KIα and PIP5KIγ suggesting de novo synthesized rather than a stable pool of PI4,5P2 for PI3,4,5P3 generation. Previously, we have shown the full PI 3-kinase pathway is assembled on the IQGAP1 scaffolding molecule21 and this complex would use phosphatidylinositol as the initial substrate that with ordered phosphorylation concertedly synthesizes PI3,4,5P3 for activation of the associated PDK1 and Akt. MAP4 and IQGAP1 are recruited to the activated EGFR with PI3Kα indicating that the IQGAP1 scaffold functions at these endomembrane. Consistently, recent studies indicate phosphatidylinositol distribution is predominantly in internal membrane, including endoplasmic reticulum and Golgi with less on the plasma membrane52, 53 and is thus positioned to provide the initial substrate for the MAP4 regulated PI3Kα/Akt signaling pathway 9,53–55.
Presumably, MAP4 and PI3Kα interaction takes place at the interface of endosomes and microtubules where PI3,4,5P3 generation and Akt activation are spatially located. Though each MTBD domain can interact with PI3Kα in vitro it is unclear whether MAP4 employs any of these individual domains or their combination for PI3Kα interaction in vivo. Possibly, MAP4 interaction with PI3Kα is coupled with the phosphorylation and dephosphorylation cycle of MAP4 MTBD as phosphorylation transiently disengage MAP4 from microtubules, and this may promote MAP4 engagement with PI3Kα18. The regulation of these interactions will be important in controlling the dynamic microtubule network in parallel to PI3K/Akt signaling. Importantly, EGF stimulated MAP4 and PI3Kα association hints more accessibility of the C2 domain in p110α for MAP4 interaction when p85α adaptor subunit is engaged with phospho-tyrosine motifs of receptor tyrosine kinases.
Beyond MAP4, the amino acid alignment of all four MTBD domains of MAP4 and other microtubule-associated proteins (e.g. MAP2, Tau 1, and Tau 6) show strikingly high homology in the microtubule-binding motif indicating that these MAPs may also associate with PI3Kα and regulate PI3K signaling. If MTBD regions of these MAPs couple PI3Kα signaling, such a role could enhance the understanding of neurodegenerative diseases linked with neuronal cell survival56,57, 58,59. Finally, the loss of the MAP4 PI3Kα association results in impaired PI3,4,5P3 generation and Akt activation. This could provide an avenue for therapeutic targeting of PI3K/Akt signaling pathway in cancers with PTEN loss or activating PI3Kα mutations.
METHODS
Antibodies
Rabbit anti-p110α (#4249, Cell Signaling), rabbit anti-p110α (#ab40776, Abcam), rabbit anti-p85α (#4292, Cell Signaling), rabbit anti-p110α (#4255, Cell Signaling), mouse anti-p110α (#ab126819, Abcam), rabbit anti-p110α (#4249, Cell Signaling), rabbit anti-p110β (#3011, Cell Signaling), mouse anti-p85α (#ab86714, Abcam), rabbit anti-p85α (#ab191606, Abcam), mouse anti-PI3,4,5P3 antibody (Z-P345, Echelon Biosciences), mouse anti-PI3,4,5P3 antibody (Z-P345B, Echelon Biosciences), mouse anti-PI3,4,5P3 antibody (RC6F8, Invitrogen), rabbit anti-pAkt (#13038, Cell Signaling), rabbit anti-pAkt (#2965, Cell Signaling), rabbit anti-pAkt (OMA1–03061, Life Technologies), rabbit anti-pAkt (#9272, Cell Signaling), rabbit anti-pAkt (#4058, Cell Signaling), rabbit anti-Akt (#ab126811, Abcam), Mouse anti-MAP4 (#sc-390286, Santa Crutz), rabbit anti-MAP4 (#A301–488A, Bethyl), rabbit anti-HA (#3724, Cell Signaling), mouse anti-HA (#H9658, Sigma), mouse anti-Flag (#F1804, Sigma), rabbit anti-Flag (#2368, Cell Signaling), rabbit anti-GST HRP-conjugate (#5475, Cell Signaling), anti-GST HRP conjugate (#RPN 1236V, Amersham), phospho-EGFR (#3777, Cell Signaling), rabbit phospho-EGFR (#MA5–15199, Invitrogen), mouse phospho-EGFR (#ab81440, Abcam), rabbit anti-EGFR (#A300–388A, Bethyl), rabbit anti-GFP (#G1544, Sigma), rabbit Erk1/2 (#4695, Cell Signaling), rabbit phospho-Erk1/2 (#4370, Cell Signaling), rabbit anti-GAPDH (#2118, Cell Signaling), rabbit anti-tubulin (#ab18251, Abcam), rat anti-tubulin (#ab6160, Abcam), rabbit anti-tubulin (#ab6046, Abcam), mouse anti-clathrin (#ab2731, Abcam), rabbit anti-clathrin (#ab21679, Abcam), mouse anti-EEA1 (#610457, BD Biosciences), rabbit anti-EEA1 (#3288, Cell Signaling), mouse anti-TFR (#136800, Invitrogen), rabbit anti-TFR (#ab84036, Abcam), mouse IgG whole molecule (#31903, Invitrogen), normal rabbit IgG (#2729, Cell Signaling), mouse anti-actin (#sc-8432, Santa Crutz), mouse anti-His HRP conjugate (#MAB050H, R and D). Rabbit PIPKIα and PIPKIγ used were produced in the lab and have been used for many years21. These all primary antibodies were used in 1:2000 dilution in 3% BSA in TBS-T (0.1% Tween 20) for immunoblotting/western blotting. For immunofluorescence studies, antibodies were diluted 1:200 in 3% BSA TBS-T.
Cell culture
MDA-MB-231, MDA-MB-468, T47D, Cal51, A431, HeLa, HEK293, HEK293T, HCT116 and COS-7 were purchased from American Type Culture Collection (ATCC). SCC-1 and SCC-47 were obtained from Dr. Alan Rapraeger’s lab at UW-Madison. All cell lines were cultured in DMEM-containing 10% FBS (Atlanta Biological Sciences) and antibiotics (penicillin/streptomycin) at 37°C in 5% CO2 incubator. All cell lines used were routinely tested for the mycoplasma contamination and routinely sub-cultured before confluency. HS578t cells stably expressing the GFP-Akt-PH domain were previously established21 and maintained in DMEM medium.
For examining the PI3,4,5P3 generation and Akt activation by FBS (10%) or EGF (10 ng/ml) or insulin (10ng/ml), cells were serum-starved overnight before stimulation. For stimulation with collagen type I (Col.I), cells were resuspended into the serum-free medium containing 0.1% BSA before seeding into Col.I-coated culture plate (25 μg/ml) as described previously60.
Mass Spectrometry Analysis of PI3Kα Immunocomplex
Cal51 cell growing in 25 cm culture plates were lysed in lysis buffer (50 mM Tris-HCl [pH 7.4], 150 mM NaCl, 0.5% Triton-X100, 1 mM EDTA, 10 mM NaF and 5 mM Na3VO4) containing protease inhibitors (Roche). Cells were incubated in lysis buffer for 2–3 hrs in rotator at 4°C. After centrifuging at 12,000 rpm for 15 minutes, the clear cell lysates were used to immunoprecipitate PI3Kα using the combination of rabbit p110α (#4249, Cell Signaling) and rabbit p85α antibody (#4292, Cell Signaling) by incubating overnight in the rotator at 4°C. The immunocomplex of PI3Kα were isolated using protein A Sepharose beads, eluted by 2x sample buffer and separated through 8% SDS-PAGE gel. The gel was stained with Coomassie stain and the distinct band above 170 kDa present in PI3Kα immunoprecipitate but absent in the control IgG was cut and analyzed at mass spectrometry facility at UW-Madison Biotech Center. The peptide analysis revealed it as microtubule-associated protein 4 (MAP4).
Cloning of Human MAP4 and its Constructs
Myc-DDK-tagged human microtubule-associated protein 4 (MAP4), the longest transcript variant 1 (NM_002375) was synthesized and cloned into pCMV6-Entry vector by OriGene (Catalog No. RC216364). The integrity of DNA sequence was validated by OriGene and us.
MAP4 was sub-cloned into MluI and SalI sites of PWPT lentiviral vector (Addgene) with Flag-tag at N-terminus using primers: AAAACGCGTATGGCTGACCTCAGTCTTGC and AAAGTCGACTTAGATGCTTGTCTCCTGGAAAGTC. pWPT vector was modified by inserting the Flag-tag. For generating the MTBD deletion mutant of MAP4, the PCR mutagenesis by overlap extension strategy was used. For this, the first PCR product containing the N-terminal part of MAP4 was generated using primers: AAAACGCGTATGGCTGACCTCAGTCTTGC and GCCCTCAGTCTTCACAGAAGTATTGGTGGCCAG. The second PCR product containing the C-terminal part of MAP4 was generated using primers: GCCACCAATACTTCTGTGAAGACTGAGGGCGGT and AAAGTCGACTTAGATGCTTGTCTCCTGG AAAGTC. The equimolar ratio of first and second PCR products was used as a template for generating the PCR product using the primers: AAAACGCGTATGGCTGACCTCAGTCTTGC and AAAGTCGACTTAGATGCTTGTCTCCTGGAAAGTC. The PCR product generated was subcloned into MluI and SalI sites of pWPT lentiviral vector as described above and the deletion of MTBD in the construct was validated by DNA sequencing at UW-Madison Sequencing facility. The use of MluI and SalI sites for cloning removes the GFP tag from the pWPT vector.
For purification of GST-fusion proteins of N-terminal half and C-terminal half of MAP4 and different domains of MAP4 (Proline-rich region, tubulin-binding domain and C-tail), specific regions were PCR amplified and subcloned into pGEX-6p-1 vector (Amersham Biosciences). The DNA encoding the N-terminal half of MAP4 was amplified by using primers AAAGGATCCATGGCTGACCTCAGTCTTGCAG and AAACTCGAGTCACTCAGAAGGTTGACTGTTGC and subcloned into BamHI and XhoI sites of pGEX-6p-1 vector in frame with GST-tag at N-terminus. The DNA encoding the C-terminal half was amplified by using primers AAAGAATTCGAGGAGGATTCTGTGTTAG and AAACTCGAGTCAGATGCTTGTCTCCTGGATC and subcloned into EcoRI and XhoI sites of pGEX-6p-1 vector in frame with GST-tag at N-terminus. For subcloning of different domains of MAP4 into the pGEX-6p-1 vector, the DNA encoding indicated domain was PCR amplified using primers: Proline-rich region (PR), AAAGAATTCGAGGAGGATTCTGTGTTAG and AAACTCGAGTCAGAGCCGGGGGGTGGTGGAG; Microtubule-binding domain (MTBD), AAAGAATTCCTCAGCCGCCTGGCCACCAAT and AAACTCGAGTCAAGCACCTCCTGCAGGTAG; C-tail, AAAGAATTCCTACCTGCAGGAGGTGCTG and AAACTCGAGTCAGATGCTTGTCTCCTGGATC. All these three domains were subcloned into EcoR1 and XhoI sites of pGEX-6p-1 vector. The integrity of DNA sequences was validated by DNA sequencing. The subcloning of the individual domains of the MTBD (MTBDI-MTBDIV), the following primers were used: MTBDI, AAAGAATTCTCTGCTCCTGATCTGAAG and AAACTCGAGTCATTTGGCCCGGCCTCCTCC; MTBDII, AAAGAATTCAAAGTCCAGATAGTCTCC and AAACTCGAGTCAAACATTACCACCTCCAGG; MTBDIII, AAAGAATTCAATGTTCAGATTCAGAAC and AAACTCGAGTCAGACATCTCCTCCACCAGG; MTBDIV, AAAGAATTCGATGTCAAGATTGAAAGT and AAACTCGAGTCACACAGCACCTCCTGCAGG. The amplified PCR products were subcloned into EcoR1 and XhoI sites of pGEX-6p-1 vector. The integrity of DNA sequences was validated by DNA sequencing.
For subcloning of the proline-rich region (PR), microtubule-binding domain (MTBD) and C-tail of MAP4 into pEGFP-C3 vector, following primers were used: PR, AAACTCGAGACAGGAAATGACATCACCACC and AAAGAATTCTCAAGAAGTATTGGTGGCCAG; MTBD, AAACTCGAGTCTGCTCCTGATCTGAAG and AAAGAATTCTCACACAGCACCTCCTGCAGG; C-tail, AAACTCGAGGCTGTGAAGACTGAGGGC and AAAGAATTCTCAGATGCTTGTCTCCTGGAT. The PCR products generated were subcloned into XhoI and EcoR1 sites of pEGFP-C3 vector and the integrity of DNA was verified by DNA sequencing.
Sub-cloning of p110α and its Constructs
The cDNA for human p110α and its hot-spot mutant forms (E542K, E545K, and H1047R) were kind gifts of Dr. Peter K. Vogt (Scripps Research Institute). For subcloning p110α and its mutant forms into PWPT-GFP lentiviral vector (Addgene), cDNA was amplified using primers: AAAACGCGTATGCCTCCACGACCATCATCA and AAAGTCGACTCAGTTCAATGCATGCTGT. The amplified PCR products were subcloned into MluI and SalI sites of pWPT-GFP lentiviral vector in frame with HA-tag at N-terminus. The vector was modified by inserting HA-tag at MCS. The integrity of DNA was verified by DNA sequencing. Similarly, for generating the C2 domain deletion mutant of p110α, the PCR mutagenesis by overlap extension strategy was used as described above. For this, the first PCR product containing the N-terminal part of p110α was generated using primers: AAAACGCGTATGCCTCCACGACCATCATCA and TAGTCTGTTACTCAGTCCACTATTTATAACCCAAAG. The second PCR product containing the C-terminal part of p110α was generated using primers: CTTTGGGTTATAAATAGTGGACTGAGTAACAGACTA and AAAGTCGACTCAGTTCAATGCATGCTGT. The first and second PCR products were combined in the equimolar ratio and used as a template for generating the PCR product using the primers: AAAACGCGTATGCCTCCACGACCATCATCA and AAAGTCGACTCAGTTCAATGCATGCTGT. The PCR product was subcloned into the MluI and SalI sites of the pWPT vector as described above. The deletion of C2 domain was validated by DNA sequencing.
The cDNA for different domains of p110α catalytic subunit (p85BD, RBD, C2 domain, helical and catalytic domain) were PCR amplified using following primers: p85BD, AAACATATGATGCCTCCACGACCATCA and AAAGGATCCTTATTCTACATTTGGAGGATA; RBD, AAACATATGTCTTCACCAGAATTGCCA and AAAGGATCCTTAACTATTTATAACCCAAAG; C2 domain, AAACATATGGCACTCAGAATAAAAATT and AAAGGATCCTTATAGTCTGTTACTCAGTCC; helical domain, AAACATATGGCTAGAGACAATGAATTA and AAAGGATCCTTAATTGTTCTGAAACAGTAA; catalytic domain, AAACATATGGAGATCATCTTTAAAAAT and AAAGGATCCTTATCAGTTCAATGCATGCTG. Amplified PCR products of each domains were subcloned into NdeI and BamH1 sites of pET15b vector (Novagen). The integrity of DNA was validated by DNA sequencing.
Protein Purification and in vitro Binding Assay
GST-fusion proteins of MAP4 constructs were expressed in BL21 (DE3) (Thermo Fisher Scientific) and purified using Glutathione Sepharose 4B beads (GE Healthcare). The intact His-tagged PI3Kα heterodimers expressed and purified from insect cells were purchased from Echelon Biosciences (E-2000). Different domains of p110α catalytic subunit (p85BD, RBD, C2, Helical, and Catalytic) were expressed in BL21 (DE3) cells (Thermo Fisher Scientific). Each domain of p110〈 expressed well in E. coli but was recovered in the insoluble fractions (inclusion bodies). To recover proteins in soluble fraction, we induced the expression of each protein at 25°C by culturing the bacteria (2 liters of LB medium for each protein) for 48 hrs in the presence of 0.1 mM of isopropyl-β-D-thiogalactoside (IPTG) and osmotic stress (330 mM sorbitol and 2.5 mM betain)61. Proteins were purified from soluble fractions of the bacterial cell lysates using Ni-NTA Agarose (Qiagen). The integrity and purity of purified His-tagged domains of p110α were accessed by Coomassie staining.
For in vitro binding study, GST-fusion proteins of MAP4 or its domains (3–5 μg) and His-tagged PI3Kα protein or His-tagged subdomains of p110α (100 ng/ml) in binding buffer (25 mM Hepes buffer [PH 7.4], 150 mM NaCl, 0.1% Triton-X100, 1mM DTT and 1mM PMSF) were incubated for 1–2 hrs at room temperature. Glutathione Sepharose 4B beads were used to recover the GST-fusion protein of MAP4. The beads were washed three times with binding buffer before eluting any bound His-PI3Kα or His-tagged domains of p110α by a 2× SDS sample buffer followed by immunoblotting using anti-His or anti-PI3Kα antibodies (#MAB050H, R&D systems; #ab40776, Abcam; #4292, Cell Signaling). For determining the saturation of binding, 2.5 μg of GST-MTBD protein were incubated with increasing concentration of His-tagged C2 domain protein followed by examining the bound C2 domain protein by immunoblotting.
GST-pulldown
For the pulldown of p85α or p110α by GST-fusion protein of the MTBD of MAP4, HEK293 cells were transfected with plasmids for p85α or p110α overexpression (pCMV-Tag2b vector). Then, cells were harvested and lysed using lysis buffer 24–48 hrs post-transfection. The clear cell lysates prepared were incubated with 3–5 μg of either GST or GST-fusion protein of MTBD for 2–3 hrs at 4°C. GST proteins were recovered by incubating with Glutathione Sepharose 4B beads. The bound proteins in the beads were eluted using 2x sample buffer and run through SDS-PAGE gel for immunoblotting using anti-p85α and p110α antibody.
Immunoprecipitation and Immunoblotting
For immunoprecipitation, the cells were often grown and harvested from in 10 cm culture dishes. Before cell lysis, cells were washed with cold 1x PBS 2-times. Cells were lysed using lysis buffer. Clear supernatants were incubated with indicated antibodies for overnight at 4°C followed by isolation of immunocomplexes using protein G or protein A Sepharose 4B beads (Amersham). Beads were washed three-times with lysis buffer before eluting the immunocomplexes with 2x sample buffer, run through SDS-PAGE gel and subjected to immunoblotting using specific antibodies.
Small interfering RNA (siRNA)
Control siRNA (siCon):5’-UUUCCGCACUGUGAUUCGG-3’
sip110α I: 5’-UUACAUUCACGUAGGUUGC-3’
sip110α II: 5’-GCACAAUCCAUGAACAGCAUUAGAA-3’
sip110α III: 5’-UCAAGAAGAAAGCUGACCAUGCUGC-3’ and is from 3’ prime UTR.
sip85α: 5’-GGAUCAAGUUGUCAAAGAA-3’
siMAP4#1: 5’-CCGGGAACUCAGAGUCAAA-3’
siMAP4#2: 5’-CGAUACUACAGGGUCUCCAACUGAA-3” and this has been used previously62.
siMAP4#3: 5’-GGAUGAAAGUGGGAAGGAA-3’ and is from 3’ prime UTR.
These siRNA oligonucleotides were designed using Invitrogen Block-iT RNAi Designer and purchased from Thermo Fisher or Dharmacon.
siRNA or Plasmid Transfection or Lentiviral Infection
For transfection of siRNA, LipofectamineRNAiMAX (#13778150, Invitrogen) was used following the protocol provided by manufacturer, and cells were assayed 48–72 hrs post-transfection. For transient transfection of plasmids, Lipofectamine-3000 (#L3000015, Invitrogen) was used and cells harvested 24–48 hrs-post transfection. For stable the expression of HA-tagged p110α or its mutant forms or C2 deletion mutant of p110α or Flag-tagged MAP4 or MTBD deletion mutant in MDA-MB-231 cells, the pWPT lentiviral vector system was used as described previously63.
Immunofluorescence (IF) Staining and Confocal Microscopy
For immunofluorescence study, cells were grown on coverslips coated with 0.2 % gelatin. For labeling of the membrane/lipid structures, the CellVue™ Maroon Cell Labeling Kit (#88–0870-16, Thermo Fisher Scientific) was used according to the manufacturer’s instruction. Cells were fixed with 4% PFA followed by permeabilization with 0.1% Triton-X100 and blocking with 3% BSA in PBS or TBS. Cells were incubated with a primary antibody overnight at 4ºC followed by incubation with fluorescent-conjugated secondary antibodies (Molecular Probes) for 1 hour at room temperature. For STED super-resolution microscopy, secondary antibodies conjugated with Abberior® STAR RED/580 dyes were used at 1:200 dilution (#41699 and #52405, Millipore Sigma). Cells were mounted in Prolong™ Glass Antifade Mountant media (#P36984, Thermo Fisher Scientific). The images were taken by Leica SP8 3X STED Super-Resolution Microscope, which is both a point scanning confocal and 3X STED super-resolution microscope. The Leica SP8 3X STED microscope was controlled by LAS-X software (Leica Microsystems). All images were acquired using the 100× objective lens (N.A. 1.4 oil). Images of Extended Data Fig. 3d were taken by Nikon TE2000-U and image processed using Metamorph. For quantification, the mean fluorescent intensity of interested channels in each cell was measured by LAS-X. The co-localization of double staining channels was quantified by LAS-X using Pearson’s correlation coefficient (Pearson’s r), which ranges between 1 and −1. Value of 1 represents perfect correlation, 0 means no correlation, and −1 means perfect negative correlation 64. The quantitative graph was generated by GraphPad Prism. The images were processed using Image J.
For immunofluorescence study of PI3,4,5P3 or pAkt, the cells growing in the coverslips and after EGF stimulation were rapidly fixed with 4% PFA prepared in TBS containing the phosphatase inhibitors (10 mM NaF and 5 mM Na3VO4). Following 3-times washing with TBS containing the phosphatase inhibitors, cells were permeabilized with 0.1% Triton-X100 in TBS-containing the phosphatase inhibitors. Then, cells were incubated in blocking solution containing 3% BSA in TBS for 1 hour in room temperature followed by overnight incubation with primary antibody (prepared in TBS-T containing 3% BSA) at 4°C in humidified chamber. Cells were washed 3-times with TBS-T (TBS-containing 0.1% Tween 20) followed by incubation with secondary antibody for 1 hour. We used different antibodies for PI3,4,5P3 or pAkt as indicated in the “Antibodies” section of the Methods. However, anti-PI3,4,5P3 antibodies (Z-P345b, Echelon Biosciences) and rabbit anti-pAkt (OMA1–03061, Life Technologies) were extensively used in this study. Furthermore, we tried to use 0.2% saponin instead of 0.1% Triton-X100 for cell permeabilization, but specificity of immunofluorescence staining were compromised as we could not see any differences in immunofluorescence signal of PI3,4,5P3 or pAkt between control vs. EGF stimulated cells. Similarly, the use of glutaraldehyde for cell fixation also compromised IF staining.
For the immunofluorescence staining for MAP4, cells were fixed in ice-cold methanol and anti-MAP4 antibody (#sc-390286, Santa Crutz) was used. For the immunofluorescence staining of p85α or p110α, various antibodies named in the “antibodies” section of methods were tested. Most of the IF data for this study were obtained using anti-p85α (#ab86714, Abcam) and anti-p110α (#ab40776, Abcam). For the immunofluorescence staining of phospho-EGFR (#ab81440, Abcam), TBS with phosphatase inhibitors was used. HA antibody used for IF study was anti-HA (#3724, Cell Signaling). In general, we used antibodies from different sources to validate immunofluorescence staining.
Proximity Ligation Assay (PLA)
PLA was applied to detect in situ protein-protein interaction as previously described64, 65. Cells after fixation and permeabilization were blocked before incubation with primary antibodies as in routine immunofluorescent staining procedure. After that, the cells were processed for proximity ligation assay (PLA) (#DUO92101, Millipore Sigma) according to the manufacturer’s instruction and previously published64. PLA signals are detected by Leica SP8 confocal microscope as discrete punctate foci and provide the intracellular localization of the protein-protein complex and were later quantified by ImageJ.
Microscale Thermophoresis (MST) Assay
MST assay was applied to measure the binding affinity of purified recombinant proteins in vitro as previously66. The target protein was fluorescently labeled by Monolith Protein Labeling Kit RED-NHS 2nd Generation (#MO-L011, Nano Temper) following the manufacturer’s instruction. A sequential titration of unlabeled ligand protein was made in a PBS-based MST buffer containing 10% glycerol and 0.05% Tween-20 and mixed with an equal volume of fluorescently-labeled target protein prepared at 10 nM concentration in the same MST buffer, making the final target protein at a constant concentration of 5 nM and the ligand protein at a gradient. Then the protein mixtures were loaded into Monolith NT.115 Series capillaries (#MO-K022, Nano Temper) and the MST traces were measured by Monolith NT.115 pico and the binding affinity was auto-generated by MO. Control v1.6 software.
Cell Proliferation, Wound Healing, and Invasion Assay
For cell proliferation assay, the equal cell number seeded in the 6-well culture plates were transfected with control siRNA or siRNA for MAP4 knockdown. Cell numbers were counted 96-hrs post-siRNA transfection after detaching the cells from the culture plates. For wound healing, cells were seeded to 6-well plates and transfected by control and MAP4 siRNA for 48 hrs until achieving confluence. Then the cells were starved in serum-free medium for 24 hrs and treated with 10 ng/ml EGF. The cellular layer in each plate was scratched using a plastic pipette tip. The migration of the cells at the edge of the scratch was imaged at 0, 6, 12, 24 and 48 hrs using the Nikon Eclipse TE2000-U microscope (Nikon Instruments Inc) and quantified by ImageJ.
The bottom polycarbonate filter surface of Transwell inserts (8 μm pores; Corning) was coated with 10 μg/ml of LN332 (Kerafast) diluted in PBS for 3 hrs at 37oC. Cells (5×10⁴) 48 hrs post-transfection of control or MAP4 siRNA were suspended in serum-free medium containing 1% BSA and then were plated in the upper insert chamber with or without 10 ng/ml EGF. Cells were allowed to migrate/invade for 16 hrs at 37°C. Cells on the bottom of the filter were then fixed with 4% PFA and stained with 0.1% Crystal Violet. Then the cells were imaged by the Nikon Eclipse TE2000U microscope and quantified by ImageJ.
Measuring phospho-Akt and PI3,4,5P3 Level on Plasma Membrane and Endosomal Fractions
Cells were fractionated into plasma membrane (SM-005) and endosome (ED-028) compartments using kits from Invent Biotechnologies. Briefly, cells were suspended in lysis buffers and cell extracts filtered to remove intact cells and nuclei using the supplied filters. The flow-through cell lysates were mixed with the supplied precipitation buffers to isolate specific cellular compartments by adjusting biophysical properties of each compartment including pH, ionic composition, and salt concentration. Plasma membrane or endosomes were isolated by centrifugation and mixed with the supplied lysis buffer. Protein concentration from each isolation was measured by Micro BCA method (Thermo Fisher Scientific) and an equal amount of protein was loaded on SDS-PAGE and further analyzed by immunoblotting with the indicated antibodies. Alternatively, the isolated plasma membrane and endosome compartments were used to measure phosphoinositide levels. Lipid extraction and cellular phosphoinositide measurement were performed using kits from Echelon Biosciences according to the manufacturer’s instructions. PI3,4,5P3 level was quantified by competitive ELISA (#K-2500S and #K-4500, Echelon Biosciences).
Statistics and Reproducibility
All the raw data used to generate graphs in the manuscript is available in Statistics Source Data. The data are presented mean±SD from at least three independent experiments with similar results. All the micrographs (IF images) are the representative images of three representative experiments as indicated in each figure legends. For the quantification of immunofluorescence images, the number of cells used for each representative experiment is indicated and unpaired t-test was conducted to determine the p-value between the two groups. For results encompassing multiple groups, one-way ANOVA was run using SAS Proc ANOVA command to determine the overall statistical outlook among the groups. To do pairwise comparison, post-hoc ANOVA was conducted using TUKEY method. The SAS Proc TTEST was mostly used to determine the p-value between two groups. The p-value less than 0.05 were considered significant between two groups.
Extended Data
Extended Data Fig. 1. Co-localization of Activated Akt and PI3,4,5P3 with Endosomal Compartments.
a, Spatial localization of activated Akt with endosomal vesicles. MDA-MB-231 cells stimulated with EGF were immunostained with antibodies for pAkt and clathrin (CHC) or early endosome antigen 1 (EEA1) or transferrin receptor (TFR). The co-localization of pAkt with CHC/EEA1/TFR was quantified in unstimulated vs EGF stimulated cells by Pearson’s correlation coefficient (Pearson’s r). Scale bar, 5 μm; Error bars denote mean±SD; n=30 cells from representative experiments
b, c Abrogation of EGF stimulated Akt activation and PI3,4,5P3 generation by PI3K inhibitors. MDA-MB-231 cells were treated with wortmannin or LY294002 compound before EGF stimulation. Cells were harvested and processed for immunoblotting or immunostaining using antibodies specific for activated Akt or PI3,4,5P3. Activated Akt and PI3,4,5P3 levels were quantified. Scale bar, 5 μm; Error bars denote mean±SD; n=4 independent experiments (b), n=30 cells from representative experiments (c) </p/>d, e, f, Examination of the activation level of GFP-tagged full-length Akt1 and their localization upon EGF stimulation. Cos-7 cells transiently transfected with GFP-tagged full-length Akt1 were pre-treated with PI3K inhibitors before EGF stimulation. Localization of GFP-tagged full-length Akt1 with different endosomal vesicles were quantified. Scale bar, 5 μm; Error bars denote mean±SD; n=30 cells from representative experiments </p/>g, Detection of PI3,4,5P3 in EGF stimulated cells by three different antibodies specific to PI3,4,5P3. Scale bar: 5 μm; Error bars denote mean±SD; n=30 cells from representative experiments Unprocessed_Western_Blots_Extended_Data_Fig1; Statistical_Source_Data_Extended_Data_Fig1
Extended Data Fig. 2. Detection of PI3,4,5P3 by PH domain GFP Reporter; Localization of activated EGFR upon EGF stimulation; Effect of Endocytosis Inhibitor in Co-localization of Activated Akt and PI3,4,5P3 with Clathrin Vesicles.
a, b, Spatial localization of GFP-tagged PH domain of Akt1 in EGF stimulated cells. Hs578T cells stably expressing GFP-tagged PH domain of Akt1 were stimulated with EGF for 5-minutes and co-localization of GFP signal with CHC/EEA1/TFR was quantified in unstimulated vs stimulated cells by Pearson’s r. Scale bar, 5 μm; Error bars denote mean±SD; n=30 cells from representative experiments
c, d, Spatial localization of activated EGFR in EGF stimulated cells. MDA-MB-231 cells were stimulated with EGF and localization of activated EGFR at different time points was examined by immunostaining with an antibody specific for phospho-EGFR and tubulin. Scale bar, 5 μm; Error bars denote mean±SD; n=30 cells from representative experiments </p/>e, f, g, Effect of endocytosis inhibitor Dynasore in EGF stimulated activation level of Akt and PI3,4,5P3. The activation level of Akt in MDA-MB-231 cells pretreated with the Dynasore inhibitor before EGF stimulation was quantified by western blotting. Activated Akt and PI3,4,5P3 were also examined by immunostaining and quantified. The image shown is the representative images of multiple reproducible experiments. Scale bar, 5 μm; Error bars denote mean±SD; n=3 independent experiments (e), n=30 cells from representative experiments (g) Unprocessed_Western_Blots_Extended_Data_Fig2; Statistical_Source_Data_Extended_Data_Fig2
Extended Data Fig. 3. PI3Kα Vesicle Distribution in PI3Kα Mutant Expressing Cells; Specificity of PI3Kα Antibody Used and Distribution of Ectopically Expressed p110α.
a, Immunostaining of mutant PI3Kα expressing Cal51 and T47D cells with p85α or p110α specific antibodies. PI3Kα were distributed in small vesicle-like structures and its co-localization with microtubules was quantified by Pearson’s r. Scale bar, 5 μm; Error bars denote mean±SD; n=30 cells from representative experiments
b, c, Specificity of PI3Kα antibody used. MDA-MB-231 cells transfected with siRNA for knockdown of p85α or p110α were used to demonstrate the loss of signals in knockdown cells by immunoblotting and immunofluorescence study. The immunoblot is the representative of reproducible experiments. Scale bar, 5 μm; Error bars denote mean±SD; n=30 cells from representative experiments </p/>d, Localization of stably expressed HA-tagged p110α WT or mutant forms in MDA-MB-231 cells. Wild type or mutant forms of p110α cloned into pWPT lentiviral vector were stably expressed into MAD-MB-231 cells by retroviral infection. Cells were processed for immunofluorescence study to examine the localization of ectopically expressed p110α using rabbit anti-HA and rat anti-tubulin antibodies. The image shown is the representative images of multiple reproducible experiments. Scale bar: 5 μm </p/>e, Effect of microtubule depolymerization in the distribution of PI3Kα. HeLa cells were either treated with DMSO or nocodazole (1 uM) for 3 hours before fixing the cells with paraformaldehyde. Cells were immunostained with anti-tubulin and anti-p85α or antip110α antibodies to examine the distribution of PI3Kα vesicles along microtubules. The image shown is the representative images of multiple reproducible experiments. Scale bar: 5 μm Unprocessed_Western_Blots_Extended_Data_Fig3; Statistical_Source_Data_Extended_Data_Fig3
Extended Data Fig. 4. PI3Kα is Responsible for Agonist-timulated Akt Activation and PI3,4,5P3 Generation in Internal Membrane Vesicles.
a, Effect of PI3Kα knockdown in EGF stimulated Akt activation. MDA-MB-231 cells were individually transfected with three different siRNAs specific for p110α. 48–72 hours post-transfection, cells were stimulated with EGF and activated Akt was examined by immunoblotting. Error bars denote mean±SD; n=3 independent experiments </p/>b, c, d, Expression of HA-tagged p110α rescue the effect on endogenous p110α knockdown in EGF stimulated Akt activation. The siRNAs specific to 3’ UTR (sip110α III) wereused to knockdown p110α in mock or HA-p110α expressing cells. 48–72 hours post-transfection, cells were stimulated with EGF to examine the activation level of Akt by immunoblotting or immunofluorescence microscopy. Scale bar, 5 μm; Error bars denote mean±SD; n=4 independent experiments (b), n=30 cells from representative experiments (c)
e, f, g, Effect of PI3Kα inhibitor in EGF stimulated activation level of Akt and PI3,4,5P3. MDA-MB-231 cells were pretreated with PI3K inhibitors (BKM120 or BYL719) before EGF stimulation. The activated Akt level was examined by immunoblotting. Similarly, activated Akt and PI3,4,5P3 co-localized with clathrin vesicles were examined by immunofluorescence microscopy and quantified. The image shown is the representative images of multiple reproducible experiments. Scale bar, 5 μm; Error bars denote mean±SD. n=3 independent experiments (e), n=30 cells from representative experiments (g) </p/>h, EGF stimulation promotes PI3Kα association with PIP5Kα and PIP5Kγ. PI3Kα was immunoprecipitated from MDA-MB-231 cells stimulated with EGF for 5 minutes and co-immunoprecipitation of PIP5Kα and PIP5Kγ was examined by immunoblotting using specific antibodies. The data shown is the representative of multiple reproducible experiments. The immunoblot shown is the representative of reproducible experiments. </p/>i, j, k Knockdown of PIP5Kα or PIP5Kγ affects EGF stimulated PI3,4,5P3 generation and activation level of Akt. MDA-MB-231 cells were transfected with siRNAs for PIP5Kα or PIP5Kγ. 48–72 hours post-transfection, cells were stimulated with EGF and the activation level of Akt was examined by immunoblotting. Activated Akt and PI3,4,5P3 co-localized with clathrin vesicles (CHC) in control vs PIP5Kα or PIP5Kγ knockdown cells were examined by immunofluorescence microscopy by Pearson’s r. The image and immunoblot shown is the representatives of multiple reproducible experiments. Scale bar, 5 μm; Error bars denote mean±SD. n=30 cells from representative experiments. Unprocessed_Western_Blots_Extended_Data_Fig4; Statistical_Source_Data_Extended_Data_Fig4
Extended Data Fig. 5. Co-localization of MAP4 and PI3Kα in different cell types.
a, b, Coomassie staining of proteins co-immunoprecipitated with PI3Kα antibody (anti-p85α and anti-p110α antibodies used together) showed a distinct band above 170 kDa. Mass-spectrometry analysis of the isolated protein band revealed it as microtubule-associated protein 4 (MAP4). The image shown is the representative images of reproducible experiments. Arrow in image indicates the band of interest for mass spectrometry analysis. </p/>c, PI3Kα in small vesicles distribute along MAP4 that mimics microtubules in different cell types. Immunofluorescence study was performed in different cell types using mouse anti-MAP4 and rabbit anti-p110α or p85α antibodies. The image shown is the representative images of reproducible experiments. Scale bar, 5 μm </p/>d, Amino acid alignment of MAP4 MTBD along with that of Tau and MAP2. All four MTBD repeats of MAP4 (MTBD I- MTBD IV) and that of Tau and MAP2 (other microtubule-associated proteins expressed in neuronal cells) show highly similar amino acid order and microtubule-binding motif. </p/>e, Representative MST binding affinity graphs for interaction between His-PI3Kα and GST-MAP4 proteins. Unprocessed_Gel_Image_Extended_Data_Fig5
Extended Data Fig. 6. Co-localization of MAP4/IQGAP1 with EGFR, Effect of MAP4 Knockdown in Distribution of PI3Kα Vesicles along Microtubules in cells expressing WT MAP4 and MTBD Deletion Mutant.
a, b, PLA shows induced association of MAP4 and IQGAP1 and that they are localized with EGFR. MDA-MB-231 cells were stimulated with EGF and processed for MAP4-IQGAP1 PLA followed by immunostaining with EGFR. The image shown is the representative images of multiple reproducible experiments. Scale bar, 5 μm; Error bars denote mean±SD; n=30 cells from representative experiments </p/>c, d, e, MAP4 knockdown demonstrated by immunofluorescence study and immunoblotting. Three different siRNAs were used individually to knockdown MAP4 in MDA-MB-231 cells. 48–72 hours after siRNA transfection, cells were processed for immunofluorescence study using an antibody specific to MAP4 and tubulin. MAP4 knockdown was also shown by immunoblotting. The image and blot shown is the representative of reproducible experiments. Scale bar, 5 μm; Error bars denote mean±SD; n=30 cells from representative experiments </p/>f, g, Localization of PI3Kα vesicles along microtubules in WT and MTBD deletion mutant of MAP4 expressing cells after knocking down endogenous MAP4. As described above, siRNAs targeting 3’ UTR region of MAP4 were used to knockdown endogenous MAP4. Cells were processed for immunofluorescence study using antibodies specific for p110α and tubulin. Distribution of PI3Kα vesicles along microtubules was quantified. n=30 cells from representative experiments
h, i, Localization of ectopically expressed WT and MTBD deletion mutant of MAP4 after knockdown of endogenous MAP4. The siRNAs targeting the 3’ UTR region of MAP4 (siMAP4#3) were used to knockdown endogenous MAP4 in MDA-MB-231 cells expressing MAP4 WT or MTBD deletion mutant of MAP4. 48–72 hours post-transfection, cells were examined via immunofluorescence study using antibodies specific to MAP4 and tubulin. The colocalization of ectopically expressed MAP4 with tubulin was quantified by Pearson’s r. Scale bar, 5 μm; Error bars denote mean±SD; n=30 cells from representative experiments Unprocessed_Western_Blots_Extended_Data_Fig6; Statistical_Source_Data_Extended_Data_Fig6
Extended Data Fig. 7. Effect of MAP4 Loss in Phosphorylation Level of EGFR and its Distribution in Endosomes.
a, b, Effect of MAP4 knockdown in endosomal localization of PI3Kα vesicles. siRNAs targeting the 3’ UTR region of MAP4 (siMAP4#3) were used to knockdown endogenous MAP4 in MDA-MB-231 cells expressing WT or the MTBD deletion mutant of MAP4. 48–72 hours post-transfection, cells were processed for immunofluorescence study using antibodies specific for endogenous p110α and clathrin or TFR. The quantification of the colocalization of p110α and CHC/TFR by Pearson’s r was shown in Figure 5c. The images shown are the representative images of multiple reproducible experiments. Scale bar, 5 μm
c, d, The phosphorylation level of EGFR in MAP4 knockdown cells. 48–72 hours post siRNA transfection, cells were stimulated with EGF before examining the phosphorylation level of EGFR by immunoblotting and immunofluorescence microscopy. The immunoblot shown is the representative images of multiple reproducible experiments. Scale bar, 5 μm; Error bars denote mean±SD; n=30 cells from representative experiments </p/>e, Localization of activated EGFR in endosomes in MAP4 knockdown cells. 48–72 hours post siRNA transfection for MAP4 knockdown, cells were stimulated with EGF and processed for immunofluorescence study to examine the co- localization of activated EGFR with endosomes (EEA1 and TFR) by Pearson’s r. Scale bar, 5 μm; Error bars denote mean±SD; n=30 cells from representative experiments Unprocessed_Western_Blots_Extended_Data_Fig7; Statistical_Source_Data_Extended_Data_Fig7
Extended Data Fig. 8. Effect of MAP4 Knockdown in Akt activation, Cell Proliferation, and Cell Invasion.
a, MAP4 loss impairs activation of Akt downstream of EGFR. Three different siRNAs were used individually to knockdown MAP4 in MDA-MB-231 cells. EGF induced Akt activation was analyzed by immunofluorescence microscopy. Scale bar, 5 μm; Error bars denote mean±SD; n=30 cells from representative experiments. </p/>b, c, MAP4 loss impairs Akt activation downstream of integrin receptors. MDA-MB-231 cells were detached from culture plates 72-hours post-siRNA transfection for MAP4 knockdown (siMAP4#1) and resuspended in serum-free medium. Cells were seeded into culture plates-coated with type I collagen before harvesting at different time points followed by immunoblotting or immunofluorescence microscopy using an antibody specific for activated Akt and tubulin. Scale bar: 5 μm. Error bars denote mean±SD; n=4 independent experiments (b), n=30 cells from representative experiments (c) </p/>d, MAP4 overexpression promotes Akt signaling. MDA-MB-231 cells ectopically overexpressing MAP4 or Mock were serumstarved overnight before stimulating with EGF. Cells were harvested at different time points and activation levels of Akt were examined by immunoblotting using activated Akt specific antibody. Error bars denote mean±SD; n=3 independent experiments </p/>e, Effect of MAP4 knockdown in cell proliferation. MDA-MB- 468 and Cal51, both showing higher activation levels of Akt were transfected with siRNA for MAP4 knockdown. 72–96 hours postsiRNA transfection, cell numbers were manually quantified. Scale bar, 100 μm; Error bars denote mean±SD; n=3 independent experiments </p/>f. g, h, Effect of MAP4 knockdown in cell invasion and cell migration. 48–72 hours post-siRNA transfection for MAP4 knockdown, cell invasion and scratch-wound healing for cell migration were performed. The image shown is the representative images of multiple reproducible experiments. Scale bar, 100 μm; Error bars denote mean±SD; n=9 fields from representative experiments (g), n=15 fields from representative experiments (h) Unprocessed_Western_Blots_Extended_Data_Fig8; Statistical_Source_Data_Extended_Data_Fig8
Supplementary Material
ACKNOWLEDGMENT
We would like to thank John Feltenberger from the UW-Madison Medicinal Chemistry Center, Lance Rodenkirch from the Optical Imaging Core of UW-Madison for technical support, and Dr. Alan Rapraeger (Department of Human Oncology, UW-Madison) for the constructive comments/suggestions on the manuscript. This work is supported by NIH Grant RO1GM57549 and NIH Grant R35GM134955 to Richard A. Anderson at the University of Wisconsin-Madison.
Footnotes
Data Availability
Source data are provided with this paper.
Mass spectrometry data of PI3Kα immunoprecipitates and identification of MAP4 has been deposited in ProteomeXchange with primary accession code PXD021306.
All other data supporting the findings of this study are available from the corresponding author on reasonable request.
CONFLICT OF INTEREST
The authors declare no competing interests
REFERENCES
- 1.Zhang Y. et al. A Pan-Cancer Proteogenomic Atlas of PI3K/AKT/mTOR Pathway Alterations. Cancer Cell 31, 820–832 e823 (2017). [DOI] [PMC free article] [PubMed] [Google Scholar]
- 2.Fruman DA et al. The PI3K Pathway in Human Disease. Cell 170, 605–635 (2017). [DOI] [PMC free article] [PubMed] [Google Scholar]
- 3.Fruman DA & Rommel C. PI3K and cancer: lessons, challenges and opportunities. Nat Rev Drug Discov 13, 140–156 (2014). [DOI] [PMC free article] [PubMed] [Google Scholar]
- 4.LoRusso PM Inhibition of the PI3K/AKT/mTOR Pathway in Solid Tumors. J Clin Oncol 34, 3803–3815 [DOI] [PMC free article] [PubMed] [Google Scholar]
- 5.Balla T. Phosphoinositides: tiny lipids with giant impact on cell regulation. Physiol Rev 93, 1019–1137 (2013). [DOI] [PMC free article] [PubMed] [Google Scholar]
- 6.Vadas O, Burke JE, Zhang X, Berndt A. & Williams RL Structural basis for activation and inhibition of class I phosphoinositide 3-kinases. Sci Signal 4, re2 (2011). [DOI] [PubMed] [Google Scholar]
- 7.Thapa N. et al. The Hidden Conundrum of Phosphoinositide Signaling in Cancer. Trends Cancer 2, 378–390 (2016). [DOI] [PMC free article] [PubMed] [Google Scholar]
- 8.Burke JE & Williams RL Synergy in activating class I PI3Ks. Trends Biochem Sci 40, 88–100 (2015). [DOI] [PubMed] [Google Scholar]
- 9.Thapa N, Horn HT & Anderson RA Phosphoinositide spatially free AKT/PKB activation to all membrane compartments. Adv Biol Regul 72, 1–6 (2019). [DOI] [PMC free article] [PubMed] [Google Scholar]
- 10.Clark AR & Toker A. Signalling specificity in the Akt pathway in breast cancer. Biochem Soc Trans 42, 1349–1355 (2014). [DOI] [PubMed] [Google Scholar]
- 11.Kelly KL, Ruderman NB & Chen KS Phosphatidylinositol-3-kinase in isolated rat adipocytes. Activation by insulin and subcellular distribution. J Biol Chem 267, 3423–3428 (1992). [PubMed] [Google Scholar]
- 12.Kapeller R, Chakrabarti R, Cantley L, Fay F. & Corvera S. Internalization of activated platelet-derived growth factor receptor-phosphatidylinositol-3’ kinase complexes: potential interactions with the microtubule cytoskeleton. Mol Cell Biol 13, 6052–6063 (1993). [DOI] [PMC free article] [PubMed] [Google Scholar]
- 13.Sato M, Ueda Y, Takagi T. & Umezawa Y. Production of PtdInsP3 at endomembranes is triggered by receptor endocytosis. Nat Cell Biol 5, 1016–1022 (2003). [DOI] [PubMed] [Google Scholar]
- 14.Naguib A. et al. PTEN functions by recruitment to cytoplasmic vesicles. Mol Cell 58, 255–268 (2015). [DOI] [PMC free article] [PubMed] [Google Scholar]
- 15.Liu SL et al. Quantitative Lipid Imaging Reveals a New Signaling Function of Phosphatidylinositol-3,4-Bisphophate: Isoform- and Site-Specific Activation of Akt. Mol Cell 71, 1092–1104 e1095 (2018). [DOI] [PMC free article] [PubMed] [Google Scholar]
- 16.Ebner M, Lucic I, Leonard TA & Yudushkin I. PI(3,4,5)P3 Engagement Restricts Akt Activity to Cellular Membranes. Mol Cell 65, 416–431 e416 (2017). [DOI] [PubMed] [Google Scholar]
- 17.Varnai P. et al. Selective cellular effects of overexpressed pleckstrin-homology domains that recognize PtdIns(3,4,5)P3 suggest their interaction with protein binding partners. J Cell Sci 118, 4879–4888 (2005). [DOI] [PubMed] [Google Scholar]
- 18.Semenova I. et al. Regulation of microtubule-based transport by MAP4. Mol Biol Cell 25, 3119–3132 (2014). [DOI] [PMC free article] [PubMed] [Google Scholar]
- 19.Wills RC, Goulden BD & Hammond GRV Genetically encoded lipid biosensors. Mol Biol Cell 29, 1526–1532 (2018). [DOI] [PMC free article] [PubMed] [Google Scholar]
- 20.Murphy JE, Padilla BE, Hasdemir B, Cottrell GS & Bunnett NW Endosomes: a legitimate platform for the signaling train. Proc Natl Acad Sci U S A 106, 17615–17622 (2009). [DOI] [PMC free article] [PubMed] [Google Scholar]
- 21.Choi S. et al. Agonist-stimulated phosphatidylinositol-3,4,5-trisphosphate generation by scaffolded phosphoinositide kinases. Nat Cell Biol 18, 1324–1335 (2016). [DOI] [PMC free article] [PubMed] [Google Scholar]
- 22.Chen M. et al. The nuclear phosphoinositide response to stress. Cell Cycle 19, 268–289 (2020). [DOI] [PMC free article] [PubMed] [Google Scholar]
- 23.Chen M. et al. The Specificity of EGF-Stimulated IQGAP1 Scaffold Towards the PI3K-Akt Pathway is Defined by the IQ3 motif. Sci Rep 9, 9126 (2019). [DOI] [PMC free article] [PubMed] [Google Scholar]
- 24.Sun Y, Thapa N, Hedman AC & Anderson RA Phosphatidylinositol 4,5-bisphosphate: targeted production and signaling. Bioessays 35, 513–522 (2013). [DOI] [PMC free article] [PubMed] [Google Scholar]
- 25.Chapin SJ & Bulinski JC Non-neuronal 210 × 10(3) Mr microtubule-associated protein (MAP4) contains a domain homologous to the microtubule-binding domains of neuronal MAP2 and tau. J Cell Sci 98 ( Pt 1), 27–36 (1991). [DOI] [PubMed] [Google Scholar]
- 26.Seo M. et al. MAP4-regulated dynein-dependent trafficking of BTN3A1 controls the TBK1-IRF3 signaling axis. Proc Natl Acad Sci U S A 113, 14390–14395 (2016). [DOI] [PMC free article] [PubMed] [Google Scholar]
- 27.Chapin SJ, Lue CM, Yu MT & Bulinski JC Differential expression of alternatively spliced forms of MAP4: a repertoire of structurally different microtubule-binding domains. Biochemistry 34, 2289–2301 (1995). [DOI] [PubMed] [Google Scholar]
- 28.Wu H. et al. Regulation of Class IA PI 3-kinases: C2 domain-iSH2 domain contacts inhibit p85/p110alpha and are disrupted in oncogenic p85 mutants. Proc Natl Acad Sci U S A 106, 20258–20263 (2009). [DOI] [PMC free article] [PubMed] [Google Scholar]
- 29.Huang CH et al. The structure of a human p110alpha/p85alpha complex elucidates the effects of oncogenic PI3Kalpha mutations. Science 318, 1744–1748 (2007). [DOI] [PubMed] [Google Scholar]
- 30.Bergeron JJ, Di Guglielmo GM, Dahan S, Dominguez M. & Posner BI Spatial and Temporal Regulation of Receptor Tyrosine Kinase Activation and Intracellular Signal Transduction. Annu Rev Biochem 85, 573–597 (2016). [DOI] [PubMed] [Google Scholar]
- 31.Salogiannis J. & Reck-Peterson SL Hitchhiking: A Non-Canonical Mode of Microtubule-Based Transport. Trends Cell Biol 27, 141–150 (2017). [DOI] [PMC free article] [PubMed] [Google Scholar]
- 32.Bonifacino JS & Neefjes J. Moving and positioning the endolysosomal system. Curr Opin Cell Biol 47, 1–8 (2017). [DOI] [PMC free article] [PubMed] [Google Scholar]
- 33.Tang YC et al. Functional genomics identifies specific vulnerabilities in PTEN-deficient breast cancer. Breast Cancer Res 20, 22 (2018). [DOI] [PMC free article] [PubMed] [Google Scholar]
- 34.Jhawer M. et al. PIK3CA mutation/PTEN expression status predicts response of colon cancer cells to the epidermal growth factor receptor inhibitor cetuximab. Cancer Res 68, 1953–1961 (2008). [DOI] [PMC free article] [PubMed] [Google Scholar]
- 35.Xia X, He C, Wu A, Zhou J. & Wu J. Microtubule-Associated Protein 4 Is a Prognostic Factor and Promotes Tumor Progression in Lung Adenocarcinoma. Dis Markers 2018, 8956072 (2018). [DOI] [PMC free article] [PubMed] [Google Scholar]
- 36.Jiang YY et al. Microtubule-associated protein 4 is an important regulator of cell invasion/migration and a potential therapeutic target in esophageal squamous cell carcinoma. Oncogene 35, 4846–4856 (2016). [DOI] [PubMed] [Google Scholar]
- 37.Ou Y. et al. Activation of cyclic AMP/PKA pathway inhibits bladder cancer cell invasion by targeting MAP4-dependent microtubule dynamics. Urol Oncol 32, 47 e21–48 (2014). [DOI] [PubMed] [Google Scholar]
- 38.Miao B. et al. Small molecule inhibition of phosphatidylinositol-3,4,5-triphosphate (PIP3) binding to pleckstrin homology domains. Proc Natl Acad Sci U S A 107, 20126–20131 (2010). [DOI] [PMC free article] [PubMed] [Google Scholar]
- 39.Jethwa N. et al. Endomembrane PtdIns(3,4,5)P3 activates the PI3K-Akt pathway. J Cell Sci 128, 3456–3465 (2015). [DOI] [PubMed] [Google Scholar]
- 40.Betz C. & Hall MN Where is mTOR and what is it doing there? J Cell Biol 203, 563–574 (2013). [DOI] [PMC free article] [PubMed] [Google Scholar]
- 41.De Santis MC, Gulluni F, Campa CC, Martini M. & Hirsch E. Targeting PI3K signaling in cancer: Challenges and advances. Biochim Biophys Acta Rev Cancer 1871, 361–366 (2019). [DOI] [PubMed] [Google Scholar]
- 42.Kim J. & Guan KL mTOR as a central hub of nutrient signalling and cell growth. Nat Cell Biol 21, 63–71 (2019). [DOI] [PubMed] [Google Scholar]
- 43.Dibble CC & Cantley LC Regulation of mTORC1 by PI3K signaling. Trends Cell Biol 25, 545–555 (2015). [DOI] [PMC free article] [PubMed] [Google Scholar]
- 44.Sun Y, Hedman AC, Tan X. & Anderson RA An unexpected role for PI4,5P 2 in EGF receptor endosomal trafficking. Cell Cycle 12, 1991–1992 (2013). [DOI] [PMC free article] [PubMed] [Google Scholar]
- 45.Henmi Y. et al. PtdIns4KIIalpha generates endosomal PtdIns(4)P and is required for receptor sorting at early endosomes. Mol Biol Cell 27, 990–1001 (2016). [DOI] [PMC free article] [PubMed] [Google Scholar]
- 46.Sun Y, Hedman AC, Tan X, Schill NJ & Anderson RA Endosomal type Igamma PIP 5-kinase controls EGF receptor lysosomal sorting. Dev Cell 25, 144–155 (2013). [DOI] [PMC free article] [PubMed] [Google Scholar]
- 47.Tan X. et al. LAPTM4B is a PtdIns(4,5)P2 effector that regulates EGFR signaling, lysosomal sorting, and degradation. EMBO J 34, 475–490 (2015). [DOI] [PMC free article] [PubMed] [Google Scholar]
- 48.Tan X, Thapa N, Choi S. & Anderson RA Emerging roles of PtdIns(4,5)P2--beyond the plasma membrane. J Cell Sci 128, 4047–4056 (2015). [DOI] [PMC free article] [PubMed] [Google Scholar]
- 49.Tan X, Thapa N, Liao Y, Choi S. & Anderson RA PtdIns(4,5)P2 signaling regulates ATG14 and autophagy. Proc Natl Acad Sci U S A 113, 10896–10901 (2016). [DOI] [PMC free article] [PubMed] [Google Scholar]
- 50.Chen YH et al. Asymmetric PI3K Activity in Lymphocytes Organized by a PI3K-Mediated Polarity Pathway. Cell Rep 22, 860–868 (2018). [DOI] [PMC free article] [PubMed] [Google Scholar]
- 51.Wallroth A. & Haucke V. Phosphoinositide conversion in endocytosis and the endolysosomal system. J Biol Chem 293, 1526–1535 (2018). [DOI] [PMC free article] [PubMed] [Google Scholar]
- 52.Zewe JP et al. Probing the subcellular distribution of phosphatidylinositol reveals a surprising lack at the plasma membrane. J Cell Biol 219 (2020). [DOI] [PMC free article] [PubMed] [Google Scholar]
- 53.Pemberton JG et al. Defining the subcellular distribution and metabolic channeling of phosphatidylinositol. J Cell Biol 219 (2020). [DOI] [PMC free article] [PubMed] [Google Scholar]
- 54.Prinz WA, Toulmay A. & Balla T. The functional universe of membrane contact sites. Nat Rev Mol Cell Biol 21, 7–24 (2020). [DOI] [PMC free article] [PubMed] [Google Scholar]
- 55.Balla T, Kim YJ, Alvarez-Prats A. & Pemberton J. Lipid Dynamics at Contact Sites Between the Endoplasmic Reticulum and Other Organelles. Annu Rev Cell Dev Biol 35, 85–109 (2019). [DOI] [PubMed] [Google Scholar]
- 56.Ramkumar A, Jong BY & Ori-McKenney KM ReMAPping the microtubule landscape: How phosphorylation dictates the activities of microtubule-associated proteins. Dev Dyn 247, 138–155 (2018). [DOI] [PMC free article] [PubMed] [Google Scholar]
- 57.Gao YL et al. Tau in neurodegenerative disease. Ann Transl Med 6, 175 (2018). [DOI] [PMC free article] [PubMed] [Google Scholar]
- 58.Iqbal K, Liu F. & Gong CX Tau and neurodegenerative disease: the story so far. Nat Rev Neurol 12, 15–27 (2016). [DOI] [PubMed] [Google Scholar]
- 59.Xie C. & Miyasaka T. The Role of the Carboxyl-Terminal Sequence of Tau and MAP2 in the Pathogenesis of Dementia. Front Mol Neurosci 9, 158 (2016). [DOI] [PMC free article] [PubMed] [Google Scholar]
- 60.Thapa N, Choi S, Tan X, Wise T. & Anderson RA Phosphatidylinositol Phosphate 5-Kinase Igamma and Phosphoinositide 3-Kinase/Akt Signaling Couple to Promote Oncogenic Growth. J Biol Chem 290, 18843–18854 (2015). [DOI] [PMC free article] [PubMed] [Google Scholar]
- 61.Blackwell JR & Horgan R. A novel strategy for production of a highly expressed recombinant protein in an active form. FEBS Lett 295, 10–12 (1991). [DOI] [PubMed] [Google Scholar]
- 62.Samora CP et al. MAP4 and CLASP1 operate as a safety mechanism to maintain a stable spindle position in mitosis. Nat Cell Biol 13, 1040–1050 (2011). [DOI] [PubMed] [Google Scholar]
- 63.Thapa N. et al. Phosphoinositide signaling regulates the exocyst complex and polarized integrin trafficking in directionally migrating cells. Dev Cell 22, 116–130 (2012). [DOI] [PMC free article] [PubMed] [Google Scholar]
- 64.Costes SV et al. Automatic and quantitative measurement of protein-protein co-localization in live cells. Biophys J 86, 3993–4003 (2004). [DOI] [PMC free article] [PubMed] [Google Scholar]
- 65.Choi S, Chen M, Cryns VL & Anderson RA A nuclear phosphoinositide kinase complex regulates p53. Nat Cell Biol 21, 462–475 (2019). [DOI] [PMC free article] [PubMed] [Google Scholar]
- 66.Asmari M, Ratih R, Alhazmi HA & El Deeb S. Thermophoresis for characterizing biomolecular interaction. Methods 146, 107–119 (2018). [DOI] [PubMed] [Google Scholar]
Associated Data
This section collects any data citations, data availability statements, or supplementary materials included in this article.


