Abstract
Glycine receptors (GlyRs) are pentameric, ‘Cys-loop’ receptors that form chloride-permeable channels and mediate fast inhibitory signaling throughout the central nervous system1,2. In the spinal cord and brainstem, GlyRs regulate locomotion and cause movement disorders when mutated2,3. However, the stoichiometry of native GlyRs and the mechanism by which they are assembled remain unclear, despite extensive investigation4–8. Here we report near-atomic resolution structures of native GlyRs from porcine spinal cord and brainstem, revealing the first structural insight into heteromeric receptors and their predominant stoichiometry of 4 α subunits:1 β subunit. Within the heteromeric pentamer, the β(+)/α(−) interface adopts a structure that is distinct from the α(+)/α(−) and α(+)/β(−) interfaces. Furthermore, the β subunit harbors a unique phenylalanine residue that resides within the pore and disrupts the canonical picrotoxin site. These results explain why inclusion of the β subunit breaks receptor symmetry and alters ion channel pharmacology. We also find incomplete receptor complexes and, by elucidating their structures, reveal the architectures of partially assembled α trimers and α tetramers for the first time.
GlyRs are inhibitory, chloride-permeable members of the pentameric Cys-loop receptor family2. Due to their wide distribution in spinal cord and brainstem circuits involved in motor control, GlyRs play a role in the regulation of locomotor behavior1,2 and the dysfunction of GlyRs underpins the neurological disorder startle disease2,3. Pharmacological and genetic evidence suggests that the predominant GlyR isoforms in the mature spinal cord and brainstem are heteropentameric receptors comprised of α1 and β subunits2. In heteromeric GlyRs, incorporation of β subunits yields unique subunit interfaces4,9, insensitivity to picrotoxin10 and propensity to bind to the GlyR-clustering, scaffold protein gephyrin11. However, the subunit stoichiometry and arrangement of heteromeric GlyRs remains unresolved. Prior studies have proposed stoichiometric assemblies of 4α:1β5, 3α:2β5,7,8 and 2α:3β4,6. Moreover, little is known about the structural basis of GlyR assembly.
Here we overcome these obstacles by isolating native GlyRs and by using cryo-EM, we identify four structural species amongst native GlyRs, including fully assembled heteromeric and homomeric receptors, and partially assembled homomeric α trimer and α tetramer complexes, allowing us to unambiguously define the stoichiometry of heteromeric GlyRs as 4α:1β. We also reveal that incorporation of the β subunit triggers rotation and compaction of the α tetramer to yield tightly packed pentamers. The partially assembled complexes further underpin a mechanism by which α and β subunits assemble into native GlyRs.
Heteromeric GlyR has a stoichiometry of 4α:1β
We exploited strychnine affinity resin to purify native GlyRs from pig spinal cord and brain stem12 (Extended Data Fig. 1a–b; For gel source data, see Supplementary Fig.1a). Mass spectrometry confirmed that the sample contained α1, α2 and β GlyR subunits, as well as gephyrin11 (Extended Data Fig. 1c). Western blot analysis further verified the presence of α1 and α2 subunits (Extended Data Fig. 1d; For gel source data, see Supplementary Fig.1b–c), demonstrating that the affinity chromatography did not selectively result in isolation of the α1 subunit. Because α and β subunits share a similar secondary and tertiary structure13, we raised an α subunit-specific mAb (3D1), thus allowing differentiation between α and β subunits (Extended Data Fig. 1e–g). Radioligand binding assays demonstrated that the purified native GlyR-Fab complex retained strychnine-binding (Kd; 169±27 nM; Extended Data Fig. 1h–j). Competitive binding experiments indicated that glycine had an inhibitory constant (Ki) of 3.4±1.3 μM and 4.4±1.6 μM for native and recombinant GlyRs Fab complexes respectively; about 4.5-fold weaker than the recombinant GlyR without Fabs (Extended Data Fig. 1k–m). Together, this data illustrates that our purification method yields receptors with near-normal ligand-binding properties.
The native GlyR sample enabled structure determination of fully assembled heteromeric and homomeric GlyRs following deep mining of a large single particle dataset. During our 2D analysis, we observed class averages with four or five Fabs (Fig. 1a, e and Extended Data Fig. 2a–b). Subsequent 3D classification successfully captured the corresponding native heteromeric and homomeric GlyR pentamers (Extended Data Fig. 2c). Although gephyrin was detected in the sample by mass spectrometry (Extended Data Fig. 1c), well resolved density for gephyrin was absent in our high-resolution maps, likely due to conformational heterogeneity.
Fig. 1. Architecture of native heteromeric and homomeric GlyRs.
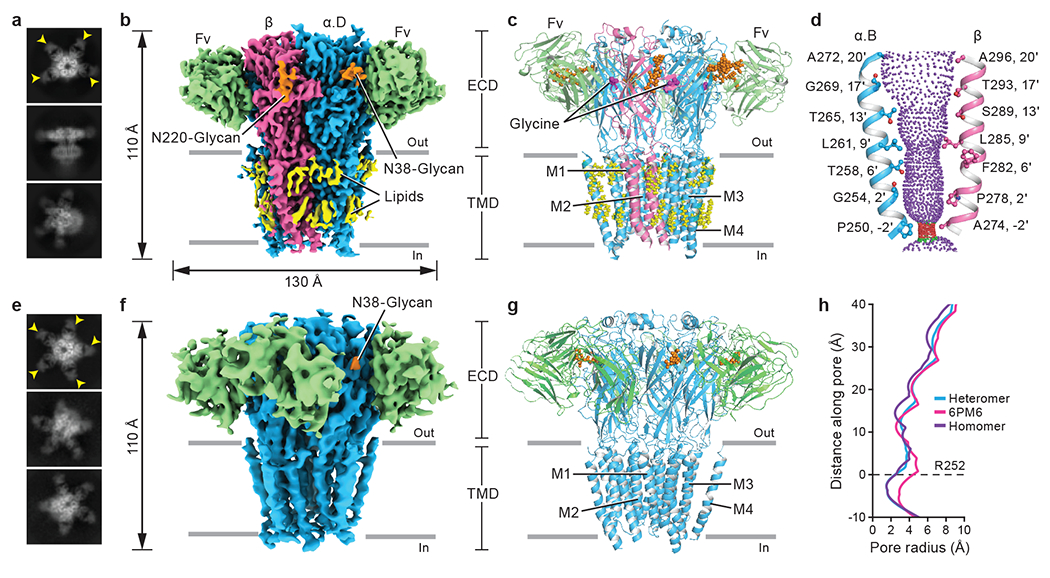
a, e, 2D class averages of heteromeric (a) and homomeric (e) GlyRs. Yellow arrows indicate bound 3D1 Fab. b, f, Side views of the sharpened cryo-EM maps of heteromeric (b) and homomeric (f) GlyRs. 3D1 Fabs, α, β, N-glycans and lipids are colored in green, blue, salmon, orange and yellow, respectively. The four α subunits in heteromeric GlyRs are denoted as α.A, α.B, α.C and α.D in counter clockwise direction viewed from ECD side. c, g, Side views of the atomic models of heteromeric (c) and homomeric (g) GlyRs, respectively. GlyRs are in cartoon representation, with N-glycans and lipids in sphere representation. Subunit coloring as in panels (b) and (f). d, Shape and size of the ion permeation pathway in the heteromeric GlyR. M2 helices from the α.B and β subunits are shown as cartoons and the side chains of pore-lining residues in ball-stick representation. Purple, green and red spheres define radii of > 3.3 Å, 1.8-3.3 Å, and < 1.8 Å, respectively. h, Profile of pore radii calculated by HOLE program for native heteromeric GlyR (blue), native homomeric α pentamer (purple) and open state homomeric α pentamer bound with glycine (PDB ID: 6PM6; pink). The Cα position of αArg252 in heteromeric GlyR is set to zero (0’). Figures for density maps and the corresponding models were generated by ChimeraX and Pymol.
Heteromeric and homomeric native GlyR-Fab complexes adopt the characteristic hollow cylindrical shape of Cys-loop receptors14, with Fabs protruding radially from α subunit extracellular domains (ECDs) (Fig. 1b–c, f–g). We found a predominant stoichiometry of 4α:1β for heteromeric GlyRs, in agreement with previous functional research5 and a recent structural study using recombinant receptors15, but no evidence for 3α:2β5,7,8 or 2α:3β4,6 complexes. However, relying on a single step, strychnine affinity purification method is a potential limitation of our study and we note that other purification methods may reveal additional subunit stoichiometries and arrangements. The heteromeric reconstruction was refined to an overall resolution of 2.7 Å, with the extracellular domain (ECD) to almost 2.3 Å (Extended Data Fig. 2d–e, Extended Data Fig. 3 and Extended Data Table 1), allowing us to observe subtle differences between subunits. The α and β subunits were identified by the N-linked glycans at residues αN38 and βN220, respectively (Fig. 1b and Extended Data Fig. 3e–f), and by sequence-specific features in the density maps (Extended Data Fig. 4a–b and Supplementary Fig.2). Inspection of the density maps at positions with different amino acids between α1 and α2 subunits demonstrates the prevalence of the α1 subunit (Extended Data Fig. 4c). We speculate that α2 subunit likely co-assembles with α116 yet that because of the lower abundance of α2, the signal for α2 is obscured by the predominant α1 subunit.
We observed worm-like densities next to the transmembrane domain (TMD) of heteromeric GlyRs, likely representing ordered lipid molecules (Fig. 1b). The structure also revealed that the 3D1 Fab epitope is located on the periphery of the ECD of each subunit and includes salt bridges and hydrogen bonds with the loop regions of the Fab near the important loop C of the receptor (Fig. 1c, Extended Data Fig. 4j and Extended Data Fig. 5). The proximity of this epitope to the neurotransmitter binding site may limit ligand-induced conformational changes and may explain why 3D1 Fab binding alters the Ki value of glycine (Extended Data Fig. 1k–m). Analysis of the pore profile demonstrated that the native heteromeric receptor has a constriction at the −2’ position with a radius of approximately 1.5 Å, narrower than the glycine-bound open state17 (Fig. 1d, h) and smaller than the 1.8 Å radius of a de-hydrated chloride ion18. Indeed, previous molecular dynamics simulations demonstrated that a similarly constricted pore is not ion permeable19. We thus conclude that this glycine-bound, native heteromeric GlyR structure represents a desensitized or desensitized-like state.
The density map for native homopentameric GlyR extended to a resolution of 4.1 Å, with the ECD to resolved to ~3 Å resolution (Fig. 1e–f and Extended Data Fig. 2h–k). As with the native heteromeric GlyR density map, features of the α2 subunit are also not discernable in the homopentameric GlyR map, likely due to the predominance of the α1 subunit (Extended Data Fig. 4c). Compared to the asymmetric structure of heteromeric GlyRs (Extended Data Fig. 4d–g), the homomeric GlyR structure shows a five-fold quasi-symmetrical architecture throughout (Extended Data Fig. 4h–i). The pore radius of ~1.5 Å at the −2’ position suggests that the homomeric GlyR also adopts a desensitized state (Fig. 1h). Despite extensive efforts, we did not capture any other 3D classes for either heteropentameric or homopentameric native GlyRs.
A β subunit 6’F disrupts picrotoxin binding
Picrotoxin inhibits Cys-loop receptors by blocking their pores and allows discrimination between homomeric and heteromeric GlyRs because heteromeric receptors are resistant to picrotoxin block10. Sequence alignment shows that the 6’T residue, generally conserved throughout the Cys-loop receptor family, is replaced by a 6’F in the GlyR β subunit (Extended Data Fig. 6a). In comparison to the available picrotoxin-bound GluCl20, GABAAR21, and homomeric GlyR structures19 (Extended Data Fig. 6b–d), the 6’F in our heteromeric GlyR structure displaces the M2 helices away from each other, resulting in distances between 6’ positions in heteromeric GlyR that are too large to coordinate a picrotoxin molecule (Extended Data Fig. 6e–f). It is also possible that the side chain bulk of the β subunit 6’F introduces a steric hindrance, blocking picrotoxin from accessing its binding site (Extended Data Fig. 6a, f). Mutation of F to T at the 6’ position in β subunits increases picrotoxin sensitivity10, affirming the importance of 6’F in disrupting picrotoxin binding. Thus, a single 6’F in 4α1β receptors is sufficient to disable the sensitivity of heteromeric GlyRs to picrotoxin.
Subunit interfaces modulate GlyR properties
The subunit interfaces in the heteromeric receptor adopt similar overall architectures, yet there are small variations due to subunit-specific residue differences (Fig. 2a–e, Extended Data Fig. 7a–c and Supplementary Data Fig. 2). We observed that αR119 forms hydrogen bonds with both βT228 and βY231, residing on Loop C at the β(+)/α.A(−) interface. However, only one hydrogen bond was apparent between αR119 and αT204 at the α(+)/α(−) interfaces (Fig. 2d and Extended Data Fig. 7b) and no interactions were observed at the α.D(+)/β(−) interface (Fig. 2d), likely weakening its strength. Interestingly, disruption of interactions associated with R119 is an essential step for glycine receptor activation22, and the equivalent GABAAR residue forms similar interactions23 and is important for GABA binding24. In the region between the ECD and TMD, a hydrogen bond was observed between αR271 and αQ226 at the α(+)/α(−) interfaces of both homomeric and heteromeric GlyRs (Fig. 2e and Extended Data Fig. 7c). Substitution of αR271 to either Leu or Gln has been linked to the neurological disorder startle disease3. We did not detect a corresponding interaction with the β subunit (Fig. 2e).
Fig. 2. Inter-subunit interactions.
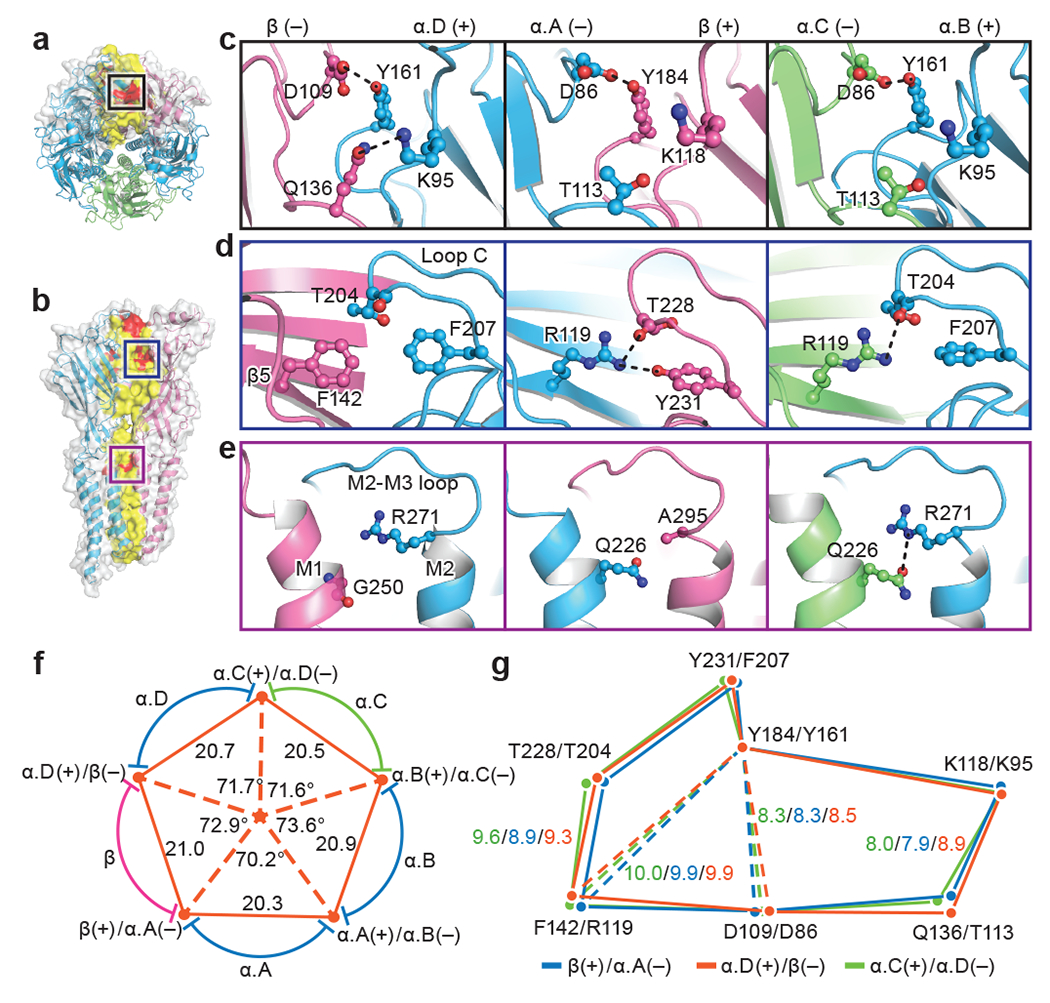
a, b, Top-down (a) and side view (b) of native GlyR, respectively. Subunits β and α.D shown in surface and cartoon representation and the other three α subunits shown in cartoon representation. Red indicates potential hydrogen bonds. Yellow indicates amino acids located at the interfaces. β subunit is colored in salmon; α.A, α.B and α.D colored in blue; and α.C colored in lime. Boxed areas are enlarged in panel (c), (d) and (e). c-e, View of the interfaces in the upper ECD (c), loop C (d) and ECD-TMD region (e) of α.D(+)/β(−), β(+)/α.A(−) and α.B(+)/α.C(−) interfaces (left to right). (+) and (−) represent different sides of each subunit. Dashed lines indicate hydrogen bonds and salt-bridges. Side chains of key residues are in ball-stick representation with oxygen in red, nitrogen in blue. f, Schematic diagram illustrating the distances and angles associated with interfaces. Five red dots at the vertex of the pentagon indicate the center of masses of two adjacent subunits. The center orange dot indicates the center of mass of the ECD. The interfaces formed by the adjacent subunits are labeled near the orange dots. Coloring as in panel (a). Distances are given in Å and the angles in degrees. g, Schematic diagram illustrating the relative positions of the amino acids shown in panels (c) to (e). Orange, green and blue polygons are created by the connection of the Cα atoms of these highlighted amino acids at the α.D(+)/β(−), α.B(+)/α.C(−) and β(+)/α.A(−) interfaces, respectively. Polygons are aligned by the superposition of βY184 and αY161. Distances are given in Å.
The β(+)/α.A(−) interface adopts a distinct conformation compared to the other interfaces. We calculated that the solvent accessible areas of the ECD that are buried by adjacent subunits range from 1182-1339 Å2, with the β(+)/α.A(−) interface being the largest (Extended Data Fig. 7d), perhaps reflecting the strength of this interaction. We observed densities in each of the binding pockets in our heteromeric GlyR map, likely corresponding to glycine molecules (Extended Data Fig. 3g–i). The amino and carboxyl groups of the glycines form multiple hydrogen bounds and cation-π interactions with surrounding residues (Extend Data Fig. 7e–h). We also observed an additional hydrogen bond in the binding site at the β(+)/α.A(−) interface, formed between the hydroxyl moiety of βY231 and the carboxyl group of glycine (Extended Data Fig. 7h). Loop C at the β(+)/α.A(−) interface adopts a more open conformation in comparison to the other subunits (Extended Data Fig. 7i). Because the Fab closely interacts with loop C in the α subunits, it is possible that the difference in loop C conformations are related to the binding of the Fab (Extended Data Fig. 4j and Extended Data Fig. 5). We also observed that the binding pocket is more closely packed at the β(+)/α.A(−) interface (Extended Data Fig. 7j) and may explain why the β(+)/α.A(−) interface has higher ligand sensitivity9,17. A geometrical analysis of the five interfaces shows that the α.A subunit is more tightly packed against the α.B and β subunits compared to the other interfaces (Fig. 2f). The angle and distance occupied by the α.A subunit are 70.2° and 20.3 Å, respectively (Fig. 2f), the smallest in this heteromeric receptor. Together with findings from other family members23,25,26, our data reveal that individual ligand-binding subunits in heteromeric Cys-loop receptors can adopt more compact conformations than others (Fig. 2f–g and Extended Data Fig. 7k–n). Moreover, when considered with recent functional studies9, our results provide a molecular explanation for the influence that the β(+)/α.A(−) interface has on GlyR properties.
Intermediates illuminate receptor assembly
Biochemical and density gradient centrifugation studies have been performed to investigate the assembly process of nAChR27 and GABAAR28 yet there is no structural information available on assembly intermediates. Remarkably, we discovered three- and four-subunit α homomeric complexes in our 2D analysis, both of which we speculate are assembly intermediates (Fig. 3a). Because 2D classification was inadequate to sort out these intermediate particles and to preserve these assembly intermediate particles, we directly performed 3D classification using the raw particles (Extended Data Fig. 2c). To eliminate model bias, we used the heteromeric pentamer 3D model to classify homomeric tetramers and the homomeric tetramer 3D model to classify homomeric trimers. Following extensive 3D classification, we successfully resolved the α trimeric and α tetrameric assembly intermediates (Fig. 3b–f and Extended Data Fig. 2c). The tetramer map was resolved at an overall resolution of 3.9 Å, with the ECD close to 3.5 Å (Extended Data Fig. 2f–g). However, the resolution of the homomeric trimer map was limited to about 12 Å, due to the small number of particles (Fig. 3d and Extended Data Table 1). Similar to the heteromeric GlyR (Fig. 1b), we observed strong glycosylation densities on the homomeric tetramer (Fig. 3b–c). Because the receptors were purified by strychnine and eluted by glycine (Extended Data Fig. 1a), which requires the ligand binding capability of the pockets, the discovery of homomeric α trimers and tetramers demonstrates that functional binding pockets are formed during receptor assembly29. Other assembly intermediates likely exist, but may have evaded capture due to non-functional binding pockets.
Fig. 3. Homomeric α assembly intermediates and model for GlyR assembly.
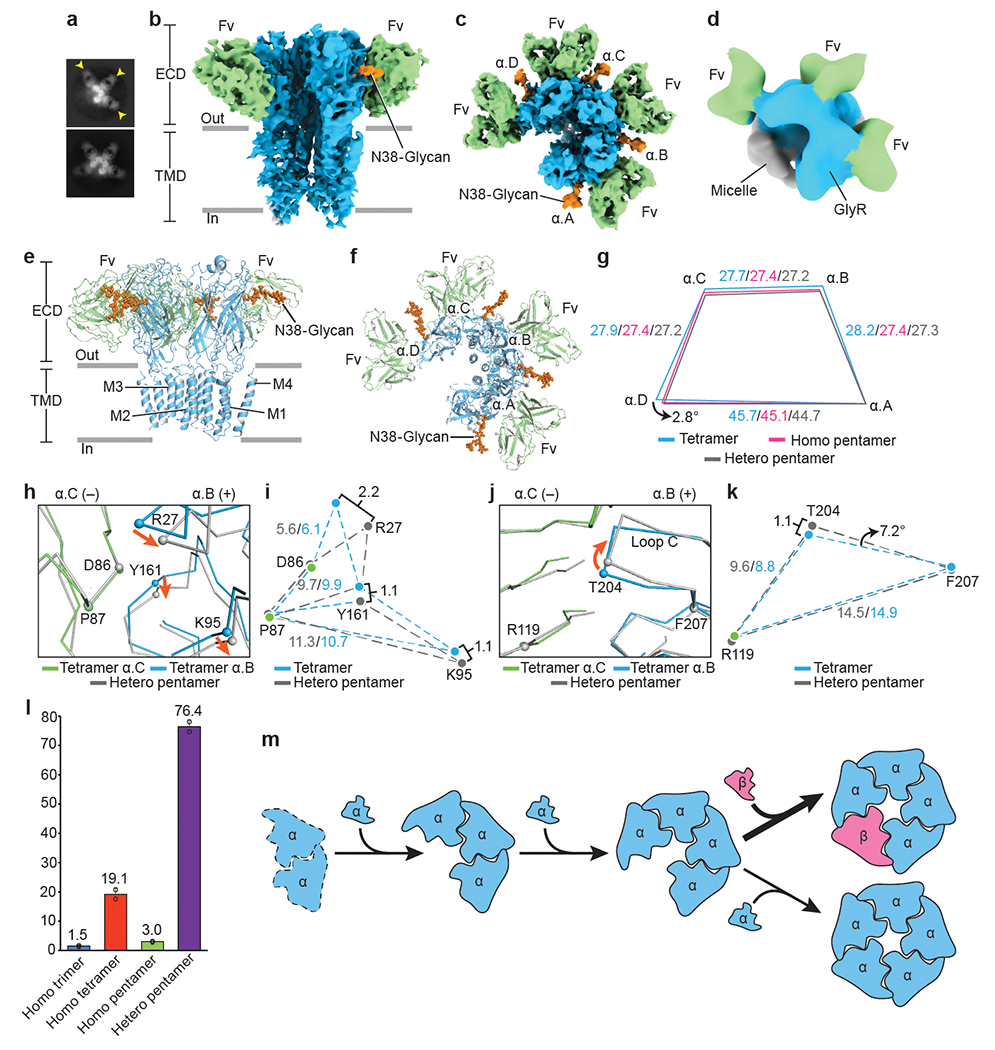
a, 2D class averages of homomeric α trimers and tetramers. Yellow arrows indicate bound 3D1 Fabs. b-c, Side (b) and top-down (c) views of homomeric α tetramer. 3D1 Fabs, α subunits and glycosylations colored in green, blue and orange, respectively. d, Top-down view of homomeric α trimer. Color coding as in panel (b). e-f, Side (e) and top-down (f) views of the atomic model of homomeric α tetramer in cartoon representation. Coloring as in panel (b). g, Schematic diagram illustrating changes in distances between α subunit centers of mass. Indicated values colored in blue, pink and grey are for homomeric tetramer, homomeric pentamer and heteromeric pentamer, respectively. All distances are denoted in Å. h, j, Superposition of the α.B(+)/α.C(−) interfaces from homomeric α tetramer and heteromeric pentamer. α.C subunit is in green and α.B in blue. Orange arrows indicate the movement of the Cα atoms. i, k, Schematic diagram illustrating the relative positions of amino acids shown in panel (h) and (j), respectively. All distances are given in Å. l, Bar plot showing particle distributions for each state (n=2). Percentage of particles is labeled above each bar. The corresponding data points were overlaid as black cycles. Data are presented as mean values +/− Standard Deviation (SD). m-q, Proposed model for GlyR assembly pathway. Dashed line in panel (m) indicates the missing structure. α and β subunits are colored in blue and salmon, respectively. Larger arrow before panel (p) indicates a higher probability.
To verify that α homomeric assembly intermediates are biologically relevant and not an artifact of sample purification or preparation, we expressed pig GlyR α1 and β subunits, as fusions with fluorophores, in HEK cells. Fluorescent size exclusion chromatography (FSEC)30 demonstrated that the melting temperatures (Tm) of purified homomeric and heteromeric receptors were 53 ℃ and 51 ℃, respectively, demonstrating that the protein complexes were stable (Extended Data Fig. 8a–b). We further co-expressed the α1 and β subunits without fluorophores, yielding a mixture of homomeric and heteromeric GlyRs, and followed the same procedure that we used to purify the native GlyRs (Extended Data Fig. 1a). The cryo-EM 2D and 3D analysis revealed that the purification procedure did not introduce incomplete complexes nor did binding of 3D1 Fab to fully assembled GlyRs cause subunits to artifactually disassemble (Extended Data Fig. 8c–h). Importantly, the same subunit stoichiometry of 4α:1β and the same subunit arrangement was observed for recombinant heteromeric GlyRs (Fig. 1a–b and Extended Data Fig. 8d–f). Based on our stability data (Extended Data Fig. 8a–b), the 2D and 3D analysis of recombinant material (Extended Data Fig. 8c–h), and the 3D reconstruction from native material (Fig. 3a–d and Extended Data Fig. 2), we believe that homomeric α trimers and tetramers represent immature states of the receptor during assembly and not artifacts of protein degradation or deterioration.
The absence of a β subunit gives rise to structural flexibility and changes subunit interfaces in α tetramers (Extended Data Fig. 7d). After incorporation of a fifth subunit, either α or β, the tetrameric ECD undergoes an approximate 2.8° rotation and distances between the subunit centers of mass decrease (Fig. 3g). We hypothesize that the enlarged space in homomeric α tetramers facilitates incorporation of a fifth subunit. Indeed, subunits also undergo conformational changes during assembly of nAChR receptors27. Interestingly, the conformational changes from tetrameric complexes to heteromeric GlyRs are larger than those to homomeric receptors (Fig. 3g), supporting the conclusion from our geometric analysis that heteromeric GlyRs adopt a more compact conformation (Extended Data Fig. 4d–i). After superposition of the α.C subunits in tetramers and pentamers, we observed that the α.B subunit and its associated residues are displaced towards the membrane in pentamers (Fig. 3h–i and Extended Data Fig. 8i–k). In addition, the important loop C element undergoes a clockwise rotation of 7.2° and 3.4° to form heteromeric and homomeric receptors, respectively (Fig. 3j–k and Extended Data Fig. 8i, l–m).
By determining the relative proportions of particle fractions representing each 3D class, we gained insight into the assembly of native GlyRs (Fig.3l–q and Extended Data Table 2). The majority of particles belonged to the heteromeric pentamer class and were about 25-fold more abundant than homomeric pentamers (Fig. 3l). In contrast, homomeric α tetramers formed 19% of total particles, about 12-fold more than homomeric α trimers (Fig. 3l). Although dimers have been proposed to form during nAChR27 and GABAAR assembly28, we did not capture any dimers in our analysis. We speculate that the absence of dimers may be due to the rapid formation of trimers, as has been demonstrated in nAChR27, or the purification of GlyRs using strychnine affinity chromatography requires at least two binding sites.
Summary
We have determined the structure of native GlyRs, including two α trimeric and α tetrameric assembly intermediates, together with two fully assembled homomeric and heteromeric pentamers. The predominant 4α:1β stoichiometry of heteromeric GlyRs reveals that a single Phe at the 6’ position in the pore is sufficient to disable the sensitivity of GlyRs to picrotoxin. In addition, our analysis provides insight into the structural basis of the β(+)/α.A(−) interface on receptor function. By solving the structure of GlyR assembly intermediates, we found that homomeric α tetramers adopt a loosely packed conformation and that incorporation of a fifth subunit triggers rotation of this structure and the formation of a more compact receptor. Furthermore, our data showed that oligomerization of GlyRs happens sequentially, such that one subunit is added at each step following an initial dimerization event. Because all assembly intermediates are α homomers (Fig. 3a–d), we speculate that there may be an insufficiency of free α subunits, but not of β subunits, in addition to other possible explanations, including expression levels and rates of subunit association. Consequently, the chance is higher for homomeric tetramers absorbing a β subunit during the last stage of assembly to form heteromeric pentamers, than a fifth α subunit being inserted to form a homomeric pentamer (Fig. 3m–q). Unknown factors, such as chaperones, may also facilitate the assembly of heteromeric GlyRs.
Methods
Preparation of 2-amino strychnine agarose
Affi-gel 10 (20mL; from Bio-Rad) was washed three times with one column volume of dimethylformamide. Then 500 mg 2-amino strychnine was added to the washed affi-gel 10 in 20 mL dimethylformamide in a 50 mL Falcon tube wrapped by aluminum foil and incubated in a cold room for 2 days. The reaction was stopped by adding 200 μL ethanolamine and incubated for 2 hours in a cold room. The agarose was washed by 20 mL dimethylformamide and then washed three times with 20 mL 50 mM potassium phosphate buffer at pH 7.4. The agarose was finally washed by five column volumes of TBS (20 mM Tris, pH 8.0, 150 mM NaCl) and stored in 4 °C, in the dark, for future use.
Generation, expression and purification of the anti-GlyR α 3D1 Fab
To raise monoclonal antibodies against GlyR, we used the homo-pentamer of the zebrafish α1 (NP_571477). The receptor cloning, expression and purification, were followed by our previous research31. The purified receptor was then reconstituted into lipid-A containing liposomes for immunization. After generating hybridoma cells, secreted candidate antibodies were screened by FSEC32 to identify antibodies that are specific to tertiary epitopes on GlyR α1 subunit. Finally, we confirmed that the monoclonal antibodies from the 3D1 hybridoma cell line also bind to the pig GlyR α1 subunit with high affinity.
The DNA sequence encoding the 3D1 monoclonal antibody Fab light and heavy chains were determined by standard techniques. To express the 3D1 Fab recombinantly, the light chain and heavy chain with a C-terminal thrombin site and 8× His tag were cloned into the pFastBacDual vector where we included an N-terminal GP64 signal peptide. The Sf9 cells were infected by the recombinant baculovirus, with a multiplicity of infection (MOI) of 2, at a cell density of 2 million/mL at 27 °C. The culture supernatant was then harvested 120 hours after infection by centrifugation at 5,000 rpm for 20 minutes using a JLA 8.1000 rotor at 4 °C. The supernatant was subsequently concentrated to 200 mL by a tangential flow concentrator. The binding buffer was thoroughly exchanged into TBS to enable the efficient binding to the Talon resin. The eluted 3D1 Fab was subjected to size-exclusion chromatography (SEC) in TBS buffer. The selected fractions were collected, pooled and stored in a −80 °C freezer for future use. To express the GFP tagged 3D1 Fab (3D1-GFP), a GFP was added at the C terminus of the light chain before the 8× His tag. A similar procedure was followed to express and purify the 3D1-GFP Fab.
Isolation of the native GlyRs
One pig spinal cord and brainstem (approximately 50-56g) was homogenized in a blender with 8 tissue volumes of ice-cold TBS supplemented with 1 mM PMSF, 0.8 μM aprotinin, 2 μg/mL leupeptin and 2 μM pepstatin for 2 minutes. The homogenized tissue was then sonicated for 5 minutes. After centrifugation for 10 minutes at 10,000g at 4 °C, the supernatant was collected, which was further centrifuged at 40k rpm using a Ti45 rotor for 1 hour at 4 °C to pellet the membrane. The pelleted membranes were suspended with 150 mL ice-cold TBS and further homogenized by a dounce homogenizer. The receptors were solubilized by 200 mL ice-cold TBS containing 1% DDM and 0.1% CHS in a cold room for 2 hours. After a centrifugation at 40k rpm for 45 minutes using a Ti45 rotor at 4 °C, the resulting supernatant was then incubated batchwise to 10 mL of 2-amino strychnine agarose by gentle rotation in a cold room for 2 hours. The beads were transferred to an XK-16 column and the column was washed by 20 column volumes of the running buffer. The beads were then transferred to a 50 mL tube and the receptors were eluted by incubation with 200 mM glycine for 2 hours in a cold room. To prepare the native GlyR-Fab complex for cryo-EM studies, excess 3D1 Fab was added before SEC. For the ligand-binding assays, no Fab was added before SEC and the sample was further dialyzed against the running buffer for at least 3 days, with a buffer change every 4-6 hours.
Porcine glycine receptor cloning, expression and purification
The gene encoding the pig GlyR subunit α1 (XP_013840362.1) and β (NP_001001545.1) share 99% amino acid similarity with the human GlyR α1 (NP_001139512.1) and β (NP_000815.1). The human GlyR constructs were chemically synthesized and further mutated to pig GlyR by site-directed mutagenesis. An 8×His tag and a twin-strep II tag, together with a thrombin cleavage site, were added to the C-terminus of α1 and β subunit, respectively. The YFP or CFP fluorophore were inserted to the M3-M4 Loop after αI360 and βP405, respectively. To obtain the CFP tagged heteromeric GlyRs, the pig α1 and β-CFP genes were sub-cloned into the pEGBM vector for baculovirus generation33. The P2 virus produced in Sf9 insect cells was used to infect TSA201 cells at 37 °C with a MOI of 2. At 12 hours post infection, 2 mM sodium butyrate was added to boost the protein expression. After another 48 hours incubation at 30 °C, cells were collected by centrifugation for 30 minutes at 5,000g using a JLA 8.1000 rotor at 4 °C. The cell pellet was then washed once by ice-cold TBS and disrupted by sonication in TBS supplemented with 1 mM PMSF, 0.8 μM aprotinin, 2 μg/mL leupeptin and 2 μM pepstatin. The large cell debris was then removed by centrifugation at 10,000g for 10 minutes at 4 °C. The membranes were pelleted from the supernatant for 1 hour at 40k rpm using a Ti45 rotor at 4 °C. The receptors were extracted from the membranes using TBS containing 1% n-dodecyl-β-D-maltopyranoside (DDM) and 0.1% cholesteryl hemisuccinate (CHS) in a cold room for 1 hour. The insolubilized materials were removed by centrifugation at 40k rpm using a Ti45 rotor for 45 minutes at 4 °C. The extracted receptors were then incubated with 7 mL streptactin resin and thoroughly washed by TBS containing 1mM DDM and 0.1 mM CHS (running buffer) in a cold room. The receptors were eluted by 5 mM D-desthiobiotin in the running buffer. The receptors were further incubated with Talon resin overnight and washed by the running buffer containing 35 mM imidazole. The receptors were then eluted by 250 mM imidazole. The concentrated receptors from Talon resin were further purified by SEC in the running buffer. Briefly, to obtain the YFP tagged homomeric GlyRs, the pig α1-YFP gene was sub-cloned into the pEGBM vector for baculovirus generation. The homomeric α1-YFP GlyRs were purified using Talon beads and a subsequent SEC was performed. To test the specificity of 3D1 Fab, 4 million cells expressing α1-YFP or β-CFP were solubilized by 100 μL TBS containing 1% DDM and 0.1% CHS in a cold room for 1 hour. The 70 μL sample with excess or without 3D1 Fab was loaded into the column after a centrifugation at 40k rpm using a TLA100.3 rotor for 20 minutes at 4 °C. To prepare the recombinant GlyRs for cryo-EM studies, pig α1 and β subunits without fluorophores were co-expressed in TSA201 cells. The recombinant GlyRs were then purified following the same procedure we used to purify the native GlyRs. Excess 3D1 Fab was added before SEC.
Analysis of protein thermal stability using FSEC
Recombinant YFP-tagged homomeric or CFP-tagged heteromeric GlyR (1 μg protein in 100 μL TBS buffer, supplemented with 1 mM DDM) were incubated at 4 to 95 °C and 4 to 80 °C for 10 minutes, respectively, followed by centrifugation at 40k rpm using a TLA100.3 rotor for 30 minutes at 4 °C. Then 70 μL of the supernatant was loaded into a Superose6 column pre-equilibrated with TBS buffer supplemented with 1mM DDM and run at a flow rate of 0.5 mL/minute. The peak heights were used to fit to the Hill equation using GraphPad Prism program. Melting temperatures (Tm) were determined by fitting the curves to a sigmoidal dose-response equation30.
Ligand-binding assays
Strychnine binding was measured via scintillation proximity assays (SPA) using a MicroBeta scintillation counter34. Each experiment contained 5 nM purified recombinant or native GlyRs, 1 mg/mL copper yttrium silicate beads (Cu-Ysi beads), 0.1% bovine serum albumin (BSA) and 3H-labelled strychnine (1:4 3H:1H) in the SEC buffer with a final volume of 100 μl. Non-specific binding was determined by the addition of 250 mM imidazole. The data was fit to the Hill equation using GraphPad Prism. Competition binding experiments were performed using SPA with 5 nM GlyRs, 1 mg/mL Cu-Ysi beads, 0.1% BSA, 3H-labelled strychnine (1:4 3H:1H) and cold competitor glycine at the concentration of 10 nM to 0.1 mM. In the case of experiments with Fab, 50 nM His tagged 3D1 Fab was added. The Ki values were determined with the Cheng-Prusoff equation35 in GraphPad Prism.
Protein ID proteomic methods
The protein extract from spinal cord and brainstem was brought up in 100 μl 1% SDS, reduced with TCEP and alkylated with iodoacetamide. After methanol-chloroform extraction, extracted proteins were mixed with 30 μl of 20 μg/ml trypsin dissolved in 50mM ammonium bicarbonate and incubated overnight at 37 °C. The next day, the solvent from the trypsinized proteins was evaporated using a ‘speed vac’ and then the resulting pellet was resuspended in 20 μl of 2% acetonitrile (ACN) and 0.1% formic acid (FA) for LC-MS. The sample was run on a Dionex U3000 nano flow system coupled to a Thermo Fusion mass spectrometer. Each sample was subjected to a 65-minute chromatographic method employing a gradient from 2–25% acetonitrile in 0.1% formic acid (ACN/FA) over the course of 16 minutes; from 25% to 35% ACN/FA for an additional 15 minutes, from 35% to 50% ACN/FA for an additional 4 minutes, a step to 90% ACN/FA for 4 minutes and a re-equilibration into 2% ACN/FA. Chromatography was carried out in a “trap-and-load” format using a PicoChip source (New Objective, Woburn, MA); trap column C18 PepMap 100, 5um, 100A and the separation column was PicoChip REPROSIL-Pur C18-AQ, 3um, 120A, 105mm. The entire run was 0.3ul/minute flow rate. Electrospray was achieved at 1.9kV. The MS1 scans were performed in the Orbitrap utilizing a resolution of 240,000. Data dependent MS2 scans were performed in the Orbitrap using High Energy Collision Dissociation (HCD) of 30% using a resolution of 30,000. Data analysis was performed using Proteome Discoverer 2.3 using SEQUEST HT scoring. Static modification included dynamic modification of oxidation of methionine (+15.9949) and a fixed modification of alkylation of cysteines (+57.021). Parent ion tolerance was 10ppm, fragment mass tolerance was 0.02Da and the maximum number of missed cleavages was set to 2. Only high scoring peptides were considered, utilizing a false discovery rate (FDR) of 1%.
Cryo-EM sample preparation
Because we were limited by the amount of isolatable protein, we used detergent-based solutions for receptor isolation and grid preparation, rather than incorporating the native receptors into lipid-filled nanodiscs. Purified native or recombinant GlyRs Fab complex were concentrated to 0.05 mg/mL. Then 20 mM glycine was added to the purified receptors before grid preparation. Next, 3.5 μL of protein sample was immediately applied to a glow-discharged Quantifoil 200 mesh 2/2 gold grids covered by 2 nm continuous carbon film. A 20-second wait was executed before a 2.5s blotting by Vitrobot Mark III under 100% humidity. The grids were then plunge-frozen in liquid ethane, cooled by liquid nitrogen.
Cryo-EM data analysis
The native GlyR data sets were collected on a Titan Krios, equipped with a K3 detector, at the nominal magnification of 105k with a pixel size of 0.823 Å. Two datasets including 10,470 and 7,002 movies, from two parallel preps were collected by SerialEM36 with a defocus range of −1.2 to −2.2 μm. The beam-induced motion was corrected by MotionCor237. The defocus values were estimated by Gctf38 and particles were picked by blob-picker in cryoSparc39. Approximately 4 million particles were picked. After two rounds of 2D classification, 2D classes with clear secondary structures containing 2.6 million particles were selected. An initial model was then generated by cryoSparc39. The initial model was further used for the following heterogeneous refinement.
For the native heteromeric GlyRs, one round of heterogeneous refinement with 7 classes was performed using the 4 million raw particles (stack1; Extended Data Fig. 2c). Three classes with good GlyR features containing 1,948,000 particles (stack2) were selected. A second round of 3D classification with 8 classes using stack2 was performed. One class with 743k particles (stack3) and two classes with 384k particles (stack4) were selected. Another round of 3D classification with 6 classes using stack3 was then performed. These 3D classes, harboring density features consistent with constricted pores at −2’P position of the M2 helix, were selected and used to generate two different stacks with 140k particles (stack5) and 418k particles (stack6). One last round of 3D classification with 6 classes using stack5 was performed and yielded two stacks, stack7 and stack8, with 25k particles and 108k particles, respectively. Stack6 and stack8 containing 527k particles were combined and refined by cryoSparc39 non-uniform refinement. One further round of local CTF refinement in cryoSparc39 generated a final heteromeric GlyR map at a resolution of 2.7 Å.
To sort out the native homomeric GlyR, stack7 was subjected to another round of classification with 4 classes (Extended Data Fig. 2c). Three classes with 20k particles showing a fifth Fab density were selected and refined by cryoSparc39 non-uniform refinement. To push the local resolution of homomeric GlyR, two masks focusing ECD and TMD were designed and one round of local refinement was performed for ECD and TMD, respectively. The locally refined ECD and TMD maps were combined by Phenix, yielding a final homomeric GlyR map.
For the native homomeric α tetramer, stack4 was used for one round of 3D classification with 8 classes (Extended Data Fig. 2c). Among these 8 classes, 4 classes contained 209k particles (stack9) showing one missing subunit were selected. Meanwhile, the other 4 classes contained 175k particles (stack10) were also combined. The particle set for homomeric α tetramer was screened by one round of 3D classification using stack9. Two classes with 130k particles that showed the clearest features of homomeric α tetramer were combined. After a subsequent round of non-uniform refinement and local CTF refinement, a final tetramer map at an overall resolution of 3.9Å with a mask was obtained. To guard against the ‘Einstein from noise’ phenomena40, we carried out reference free 2D classification using the final homomeric α tetramer particle stack and captured unambiguous 2D class averages of the homomeric α tetramer.
To discover the native homomeric α trimer, stack10 was used for the 3D classifications with 4 classes (Extended Data Fig. 2c). Briefly, we performed six rounds of 3D classification using the homomeric α tetramer and a homomeric α dimer as the 3D references. The particles corresponding to the homomeric α tetramer were combined after each round of 3D classification. A final 3D classification was carried out using the homomeric α tetramer as the 3D reference. One class with about 10k particles that showed features of the homomeric α trimer was selected and further refined by cryoSparc39 homogeneous refinement and then sharpened by cryoSparc39. Like with the homomeric α tetramer, as described above, to illustrate that the trimer map did not result from model bias, we performed one round of reference free 2D classification using the 10k homomeric α trimer particles and obtained clear 2D class averages of the homomeric α trimer.
For the recombinant GlyR data set, 3,296 movies were collected. A similar procedure was followed to perform the motion correction, CTF estimation and particle picking. Approximately 640k raw particles were picked for subsequent 2D and 3D classification in cryoSparc39. The native heteromeric GlyR map was used for the initial 3D model. After two rounds of classification, 76k and 43k good particles were reserved for a final non-uniform refinement for homomeric and heteromeric GlyR, respectively. The local resolution maps for homomeric tetramer, homomeric pentamer and heteromeric pentamer were estimated by cryoSparc39. Finally, LocScale41 was used to sharpen these maps.
Model building
Homology models for pig α1, β and 3D1 Fab were generated using SWISS-MODEL42. For the heteromeric pentamer, the initial model was generated via rigid body fitting of the homology models to the density map in UCSF Chimera42. The high quality of cryo-EM maps facilitated the model building of the whole receptor structure by iterative of manual adjustment in Coot43. The structure of the 3D1 Fab constant domain was removed due to its weak densities. Prominent tube-shaped densities surrounding the TMD, likely contributed by ordered lipid molecules, were fit by proper length of alkane chains. In total, 45 alkane chains were placed. Five sugar molecules were modeled per α subunit linking the Asn38 and three sugar molecules were added on the β subunit, linked to Asn220. The amino acids located in the loop between the M3 and M4 helices were without cryo-EM densities and not included in the structures, including the amino acids between 357 and 468 for the β subunit and amino acids between 344 and 407 for the α subunit. After Phenix real space refinement44, the map to model cc value was 0.75.
To build the model for native homomeric α pentamer, the β subunit in heteromeric GlyR was replaced by the model of one α subunit plus Fab, followed by rigid body fitting in UCSF Chimera42. The model was then manually adjusted in Coot43. Four of the glycosylation molecules, the ligand glycine molecules and lipid molecules were removed due to weak densities. The model was further refined using Phenix44 by applying NCS restraints. The final map to model cc value was 0.70.
To build the model for homomeric α tetramer, the β subunit in the hetero pentamer was removed. The amino acids with weak densities including E103 to T113 and A303 to D395 in the α.A subunit, E101 to N115, W241 to V253 and A303 to R399 in α.B subunit, G105 to D114, W239 to L255 and L299 to I397 in α.C subunit, S47 to Y58, E103 to N115, M140 to K143, Y202 to K206 and M237 to C terminus in α.D subunit, were not modeled. Finally, sugar chains of variable length were added to the subunits depending on the densities. A subsequent manual adjustment was performed in Coot43. After Phenix real space refinement44, the map to model cc value was 0.82.
Western blot analysis
Purified native GlyRs were loaded onto SDS-PAGE and transferred to a nitrocellulose membrane. Antibodies used for detection were α1 (LSBio; LS-C335282; 1:500), α2 (GeneTex; GTX105634; 1:1000) and α3 (MyBioSource; MBS621830; 1:500). IRDye 680RD and IRDye 800CW anti-rabbit secondary antibodies were used for visualization. Blots were developed by adding secondary antibodies at a ratio of 1:10,000.
Extended Data
Extended Data Fig. 1. Biochemistry results related with native GlyRs.
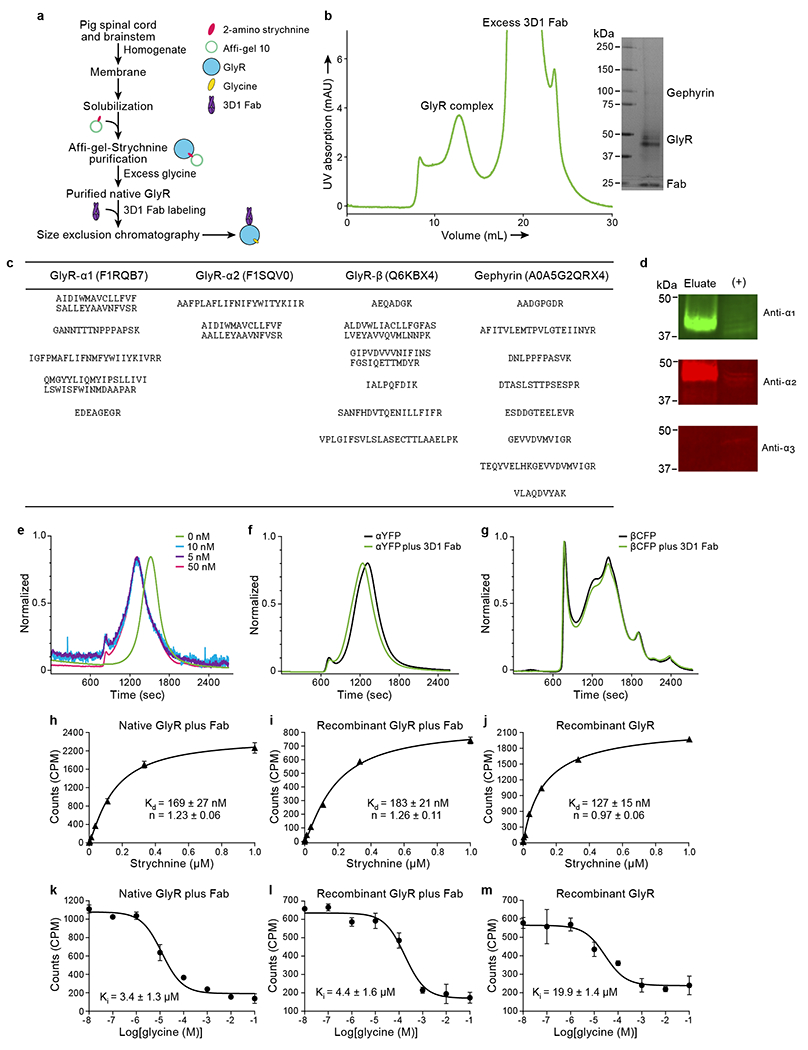
a, Flow chart for native GlyR purification. b, Representative SEC profile for native GlyR in complex with the 3D1 Fab. Inset shows a typical silver staining of sodium dodecyl sulphate-polyacrylamide gel electrophoresis of native GlyR sample for cryo-EM grid preparation. c, Results from mass spectrometry (See Methods for more details). The table shows the identified peptides within the sample and the corresponding proteins with their gene accession numbers. d, Western blot analysis of isolated native GlyR eluted from strychnine column using antibodies against α1, α2, and α3. Positive control is the membrane extracts from rat brain. The experiments were repeated two times with similar results. e, FSEC profiles for mixing of different concentration of recombinant homomeric α pentamer with 3D1 Fab. f-g, FSEC profiles for mixing of YFP-tagged homomeric α1 GlyR (f) and CFP-tagged β GlyR (g), respectively. h-j, Saturation binding of 3H strychnine to native GlyRs with 3D1 Fab (h), recombinant expressed pig heteromeric GlyRs with (i) and without 3D1 Fab (j), respectively. Results are the average of three replicates and the error bars represent standard error of the mean (SEM) (n=3). k-m, The competitive binding of glycine to native GlyRs with 3D1 Fab (k), recombinant expressed pig heteromeric GlyR with (l) and without 3D1 Fab (m), respectively. Results are the average of three replicates and the error bars represent SEM (n=3). The hot ligand used here is 3H strychnine.
Extended Data Fig. 2. 3D reconstruction of native GlyRs.
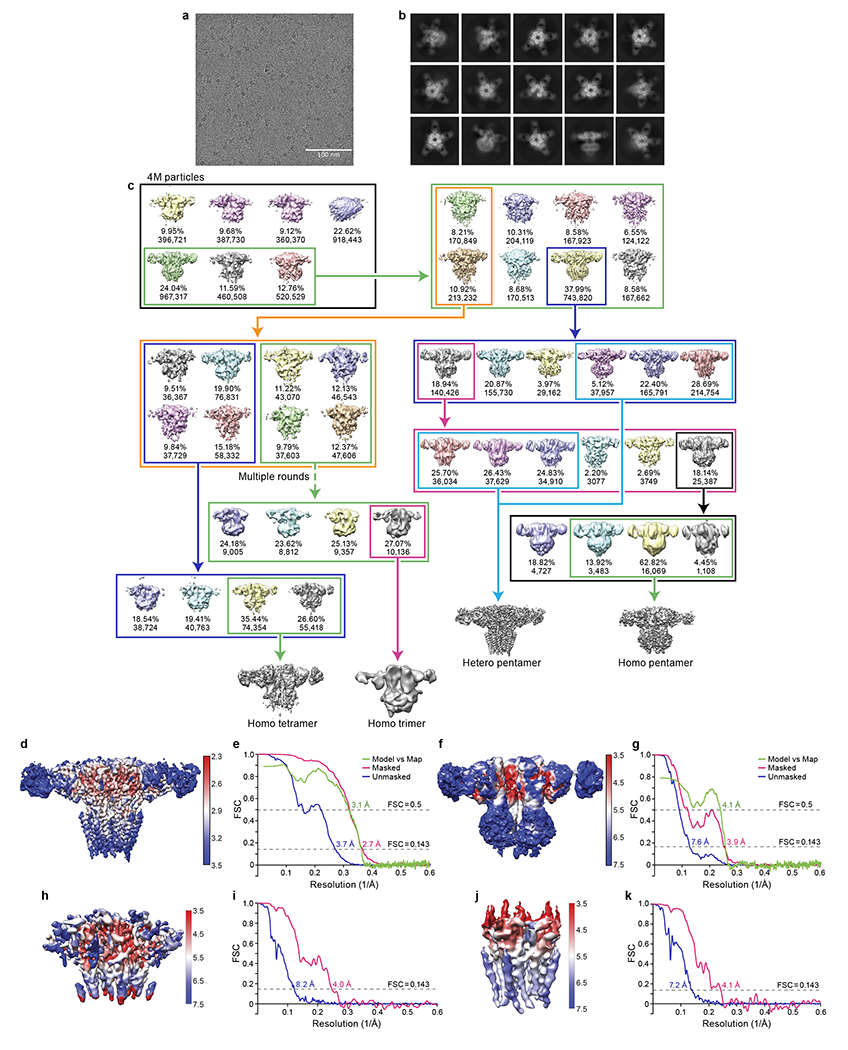
a, A typical cryo-EM micrograph for native GlyRs. The experiments were repeated three times with similar results. b, Selected 2D class averages for native GlyR-Fab complex. c, Flow chart for cryo-EM data analysis of native GlyRs. d, f, h, j, Local resolution maps for unsharpened heteromeric pentamer (d), homomeric α tetramer (f), locally refined ECD (h) and TMD map (j) of homomeric pentamer. e, g, i, k, FSC curves for heteromeric pentamer (e), homomeric α tetramer (g), locally refined ECD (i) and TMD map (k) of homomeric α pentamer.
Extended Data Fig. 3. Representative densities.
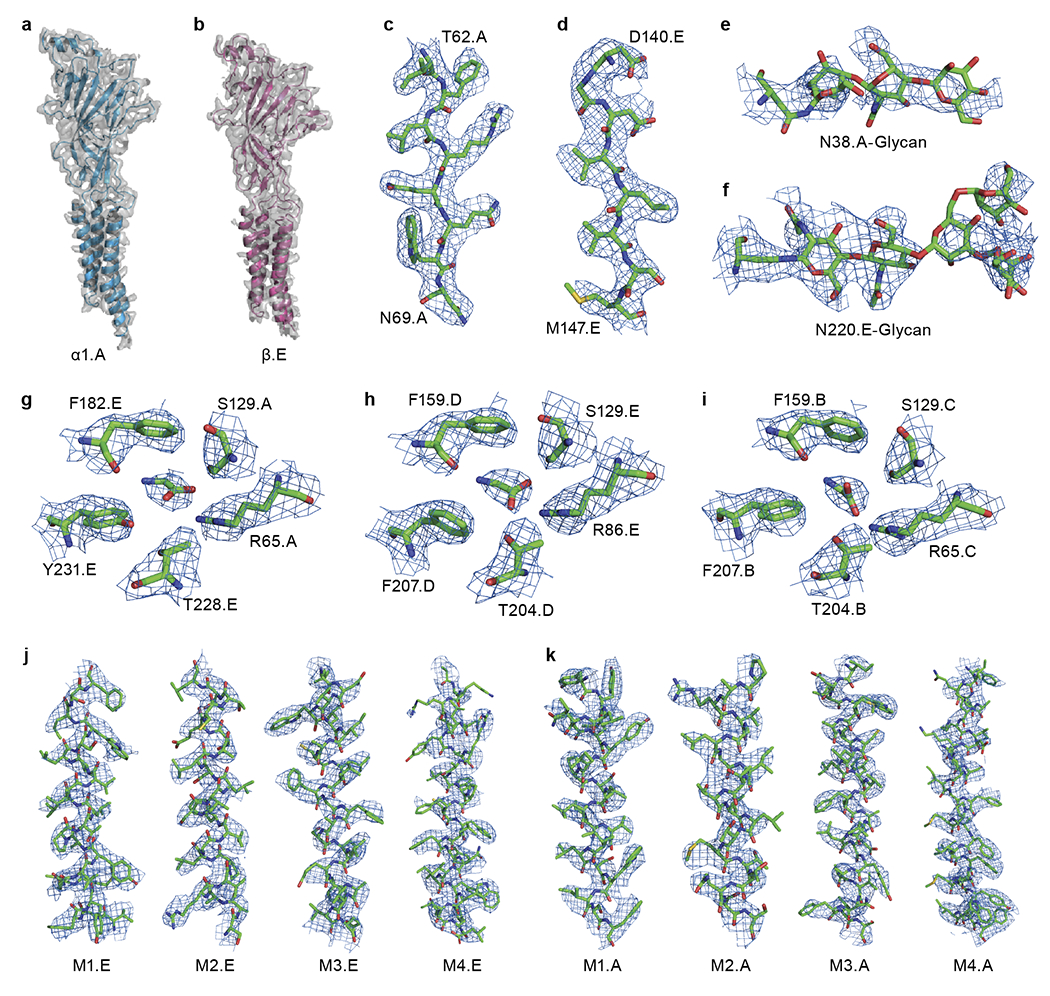
a-b, EM density segments for α.A (a) and β (b) subunits, respectively. The model is shown in carton representation. The density is shown in surface representation. c-d, Representative densities for light (c) and heavy chain (d) of 3D1 Fab. Regions are numbered. e-f, Representative densities for glycosylation on α.A (e) and β (f) subunits. g-i, Representative densities of the binding pockets formed by β(+)/α.A(−) (g), α.D(+)/β(−) (h) and α.B(+)/α.C(−) (i), respectively. The related key amino acids are labeled. j-k, Representative densities for transmembrane helices including M1, M2, M3 and M4 from β (j) and α.A (k), respectively. All of the isolated densities are contoured at 8σ.
Extended Data Fig. 4. Subunit identities and geometry of GlyR pentamers.
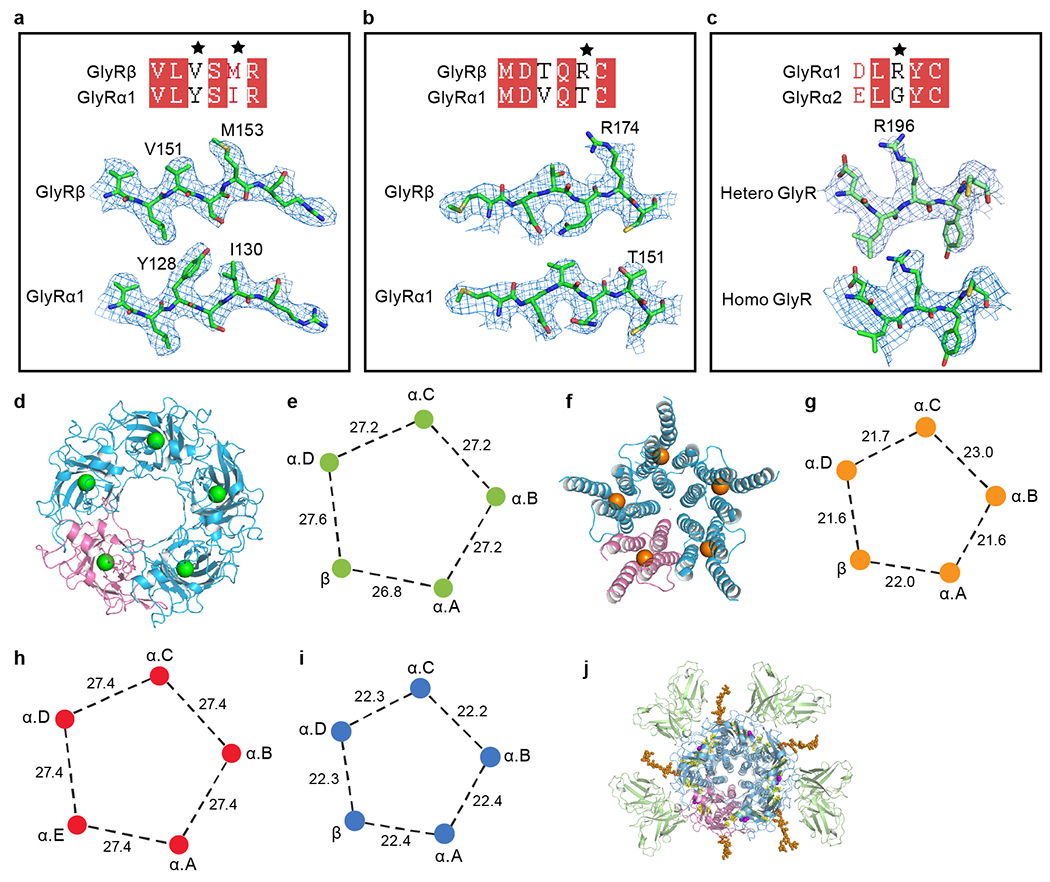
a-b, Comparison of isolated representative densities for α1 and β subunits contoured at 8σ. Two pairs of representative residues have been selected. These key amino acids are labeled. Black stars highlight the mismatched residues. c, Isolated densities with different amino acids between the α1 and α2 subunit from native heteromeric and homomeric pentamer maps contoured at 8σ, respectively. d, f, ECD (d) and TMD (f) of heteromeric pentamer shown in cartoon representation. The α subunits are colored in blue and β subunit is in salmon. The centers of mass for ECD and TMD are shown in green and orange, respectively. e, g, Schematic diagram illustrating the neighboring distances of centers of mass of heteromeric ECD (e) and TMD (g), respectively. h, i, Schematic diagram illustrating the neighboring distances of centers of mass of homomeric α1 pentamer ECD (h) and TMD (i), respectively. j, Top-down view of heteromeric GlyR-Fab complex. GlyRs are in cartoon representation, with N-glycans and lipids in sphere representation. 3D1 Fabs, α, β, N-glycans, ligands glycine and lipids are colored in green, blue, salmon, orange, purple and yellow, respectively. All of the distances are denoted in Å.
Extended Data Fig. 5. Binding of 3D1 Fab.
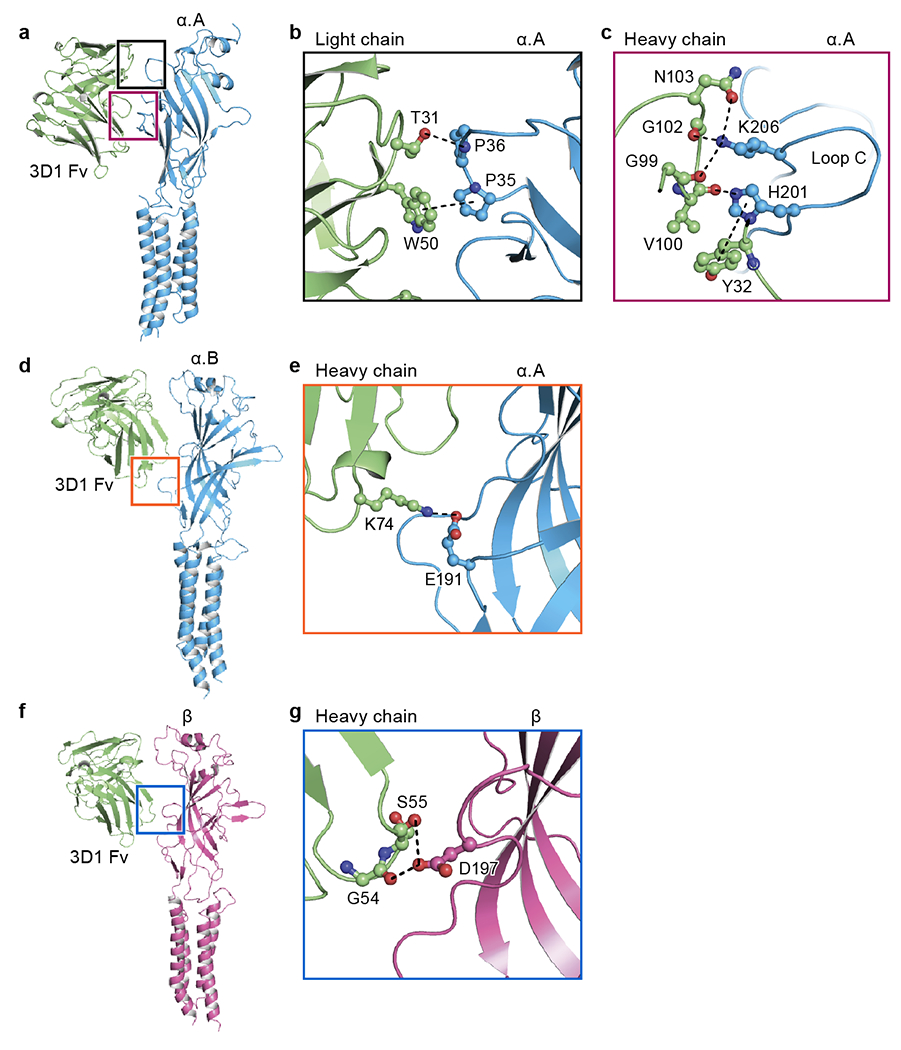
a, d, Side views of 3D1 Fab bound to the isolated α.A (a) and α.B subunit (d) in carton representation, respectively. b-c, e, Close-up view of the binding site of the region indicated in panel (a) and (d) viewed approximately parallel to the plane of the membrane. The key amino acids involved in interactions are shown in ball-stick representation. The potential hydrogen bonds, cation-π and π-π interactions are indicated in dashed lines. f, Side view of 3D1 Fab bound to the isolated β subunit in carton representation. g, Close-up view of the binding site of the region indicated in panel (f) viewed approximately parallel to the plane of the membrane.
Extended Data Fig. 6. Analysis associated with TMD.
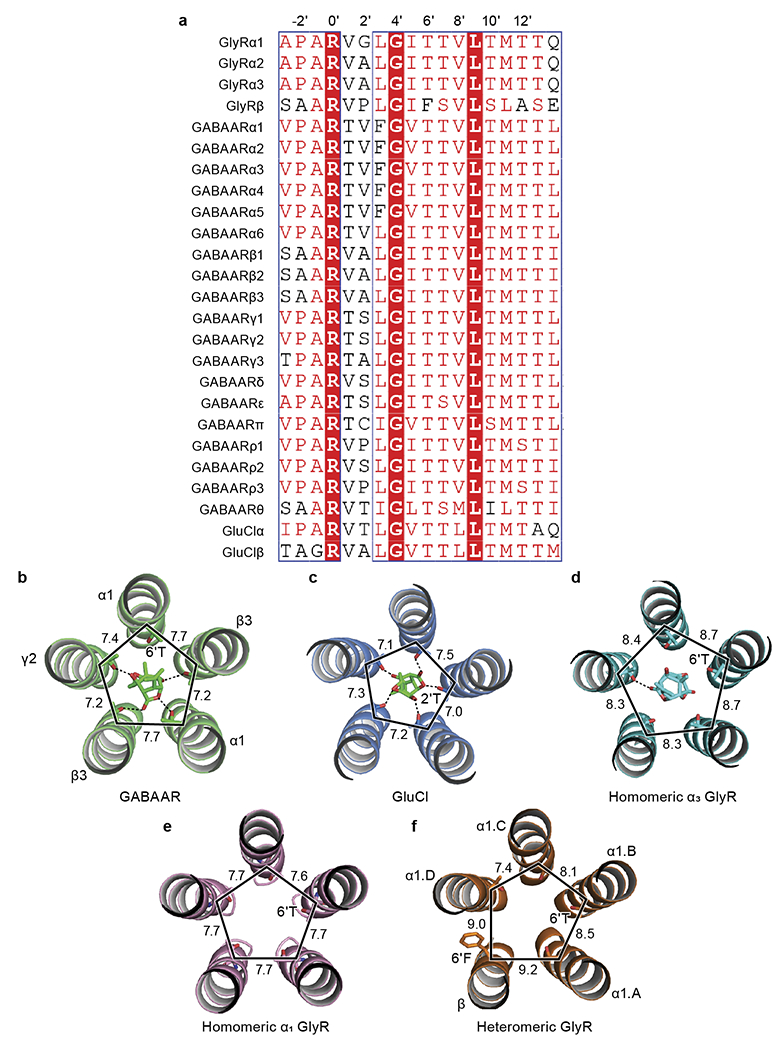
a, Sequence alignment of M2 helices among GABAAR, GlyR and GluCl. Higher prime numbers approach ECD, lower prime numbers approach intracellular domain. The −2’ position is the first amino acid of M2 helix. Sequence alignment was performed by PROMALS3D. b-d, Isolated M2 helices bound with picrotoxin from GABAAR (b; PDB ID: 6HUG), GluCl (c; PDB ID: 3RI5) and homomeric GlyR (d; PDB ID: 6UD3). The important amino acids 6’T or 2’T interacting with picrotoxin are labeled. The M2 helices and picrotoxin are shown in cartoon and stick representation, respectively. e-f, Isolated M2 helices from native homomeric GlyR (e) and heteromeric GlyR (f), respectively. The 6’T and 6’F are shown in stick representation. The M2 helices are shown in cartoon representation. All distances are denoted in Å.
Extended Data Fig. 7. Structural metrics related with the interfaces.
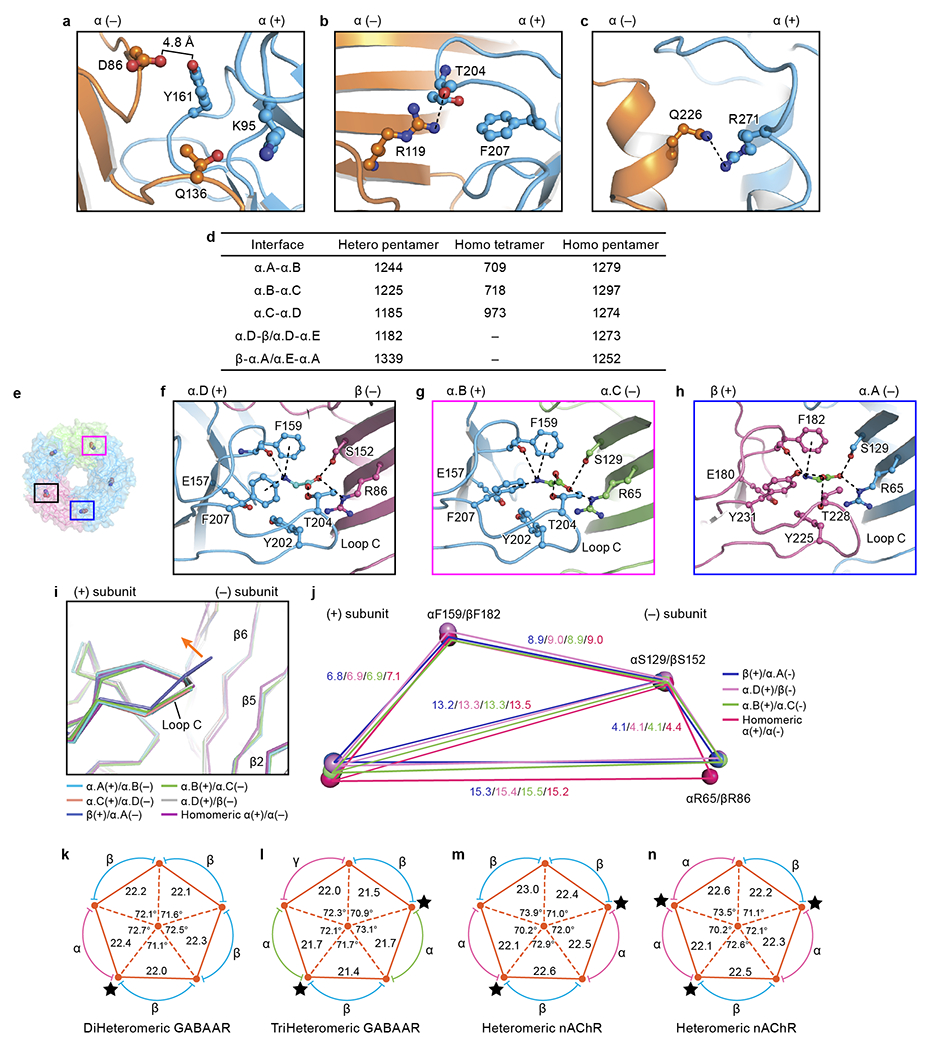
a-c, View of the interface interactions of native homomeric α1 pentamer (see Fig. 2c–e). d, The summary of the buried areas for heteromeric pentamer, homomeric α tetramer and homomeric α1 pentamer. The areas are given in Å2. e, Top down view of heteromeric GlyR in surface and ribbon representation. The glycine molecules are shown in sphere representation. The α.A and α.D are in blue. The β subunit and α.C subunits are colored in salmon and lime, respectively. The boxed areas are enlarged in panels (f) to (h). f-h, Views of the binding pockets at α.D(+)/β(−) (f), α.B(+)/α.C(−) (g) and β(+)/α.A(−) (h) interfaces, respectively. The glycine molecules are shown in ball-stick representations with oxygen in red, nitrogen in blue and carbon in green. The possible hydrogen bonds and cation-pi interactions are shown as dashed lines. i, Superposition of the orthostatic binding sites. The binding sites are overlapped by the ECD of the principle side subunits. Orange arrows indicate the movement of loop C. j, Schematic diagram illustrating the relative positions of the amino acids in the binding pockets. The blue, pink, green and red polygon are created by the connection of the Cα atoms of these crucial amino acids at the β(+)/α.A(−), α.D(+)/β(−), α.B(+)/α.C(−) and native homomeric α(+)/α(−) interfaces, respectively. k-n, Schematic diagram illustrating the distances and angles related with the interfaces of Cys-loop family members including GABAAR (k, PDB ID: 6A96; l, PDB ID: 6DW1) and nAChR (m, PDB ID: 6CNJ; n, PDB ID: 6CNK; see Fig. 2f). The black star indicates the binding pocket bound with ligand. All distances are given in Å and the angles are given in degree.
Extended Data Fig. 8. Results related with assembly intermediates.
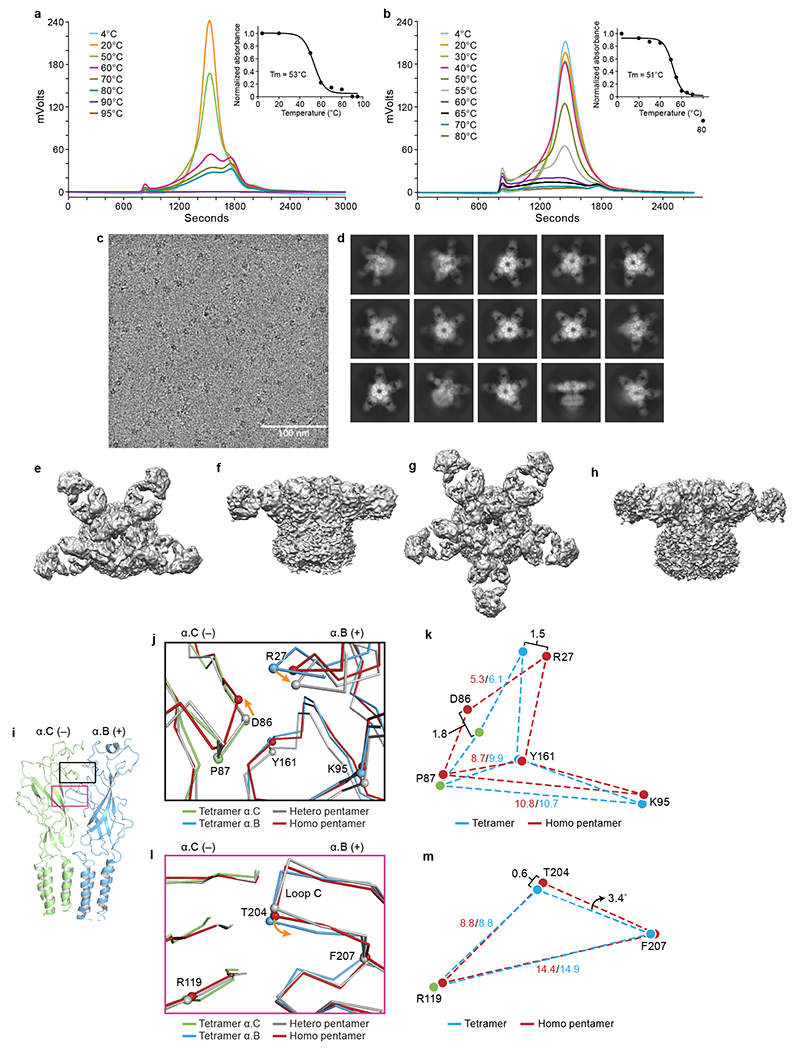
a-b, Representative FSEC profiles for recombinant expressed homomeric GlyR tagged with YFP (a) and heteromeric GlyR tagged with CFP on β subunit (b), respectively. Melting temperatures (Tm) were determined by fitting the curves to a sigmoidal dose-response equation. c, A typical cryo-EM micrograph for recombinant GlyRs. The experiments were repeated three times with similar results. d, 2D class averages for recombinant GlyRs bound with 3D1 Fabs. e-f, Top down and side views for the recombinant heteromeric GlyR map, respectively. g-h, Top down and side views for the recombinant homomeric GlyR map, respectively. i, Side view of isolated α.B-α.C dimer from tetramer. Subunits are shown in cartoon representation. α.B and α.C are colored in blue and lime, respectively. The boxed areas are enlarged in panel (j) and (l). j, l, Superposition of the interfaces in the upper ECD (j) and the region near loop C (l) of α.B(+)/α.C(−) interface from homomeric α tetramer, heteromeric pentamer and homomeric pentamer. Orange arrows indicate the displacements of the Cα atoms. k, m, Schematic diagram illustrating the relative positions of the amino acids of the homomeric pentamer and tetramer. All distances are given in Å.
Extended Data Table 1.
Statistics for 3D reconstruction and model refinement.
| States Codes | Hetero Pentamer (EMD-23913) (PDB 7MLY) |
Homo Tetramer (EMD-23911) (PDB 7MLV) |
Homo Trimer (EMD-23912) |
Homo Pentamer (EMD-23910) (PDB 7MLU) |
|---|---|---|---|---|
| Data collection and processing | ||||
| Microscope | Titan Krios | |||
| Camera Magnification | K3 BioQuantum 105,000 | |||
| Voltage (kV) | 300 | |||
| Defocus range (μm) | −1.2 to −2.2 | |||
| Exposure time (s) | 1.5 | |||
| Dose rate (e−/Å2/s) | 18.8 | |||
| Number of frames | 60 | |||
| Pixel size (Å) | 0.823 | |||
| Micrographs (no.) | 17,472 | |||
| Initial particles (no.) | 4,046,595 | |||
| Symmetry imposed | C1 | C1 | C1 | C5 |
| Final particles (no.) | 527,075 | 129,772 | 10,136 | 20,660 |
| Map resolution (Å) | 2.74 | 3.85 | 12.30 | 4.1 |
| FSC threshold | 0.143 | 0.143 | 0.143 | 0.143 |
| Refinement | ||||
| Initial model (PDB code) | - | 7MLY | - | 7MLY |
| Model resolution (Å) | 3.3 | 4.1 | - | 4.3 |
| FSC thrpqhold | 0.5 | 0.5 | - | 0.5 |
| Model composition | ||||
| Non-hydrogen atoms | 21640 | 15085 | - | 21891 |
| Protein atoms | 20410 | 14808 | - | 21821 |
| Ligand atoms | 1230 | 277 | - | 70 |
| B factors (Å2) | ||||
| Protein | 102.7 | 159.8 | - | 85.6 |
| Ligand | 124.1 | 321.6 | - | - |
| R.m.s. deviations | ||||
| Bond length (Å) | 0.004 | 0.004 | - | 0.004 |
| Bond angle (°) | 0.594 | 0.938 | - | 0.872 |
| Validation | ||||
| Favored (%) | 93.37 | 92.93 | - | 93.64 |
| Allowed (%) | 6.63 | 7.07 | - | 6.91 |
| Disallowed (%) | 0 | 0 | - | 0 |
| Poor rotamers | 0.04 | 0 | - | 0.21 |
| MolProbity score | 1.84 | 1.71 | - | 1.80 |
| Clash score | 7.44 | 4.92 | - | 6.81 |
Extended Data Table 2.
Statistics for 2 independent native GlyR single particle data sets.
| Data set 1 | Data set 2 | |
|---|---|---|
| Micrographs (no.*) | 10,470 | 7,002 |
| Homo trimer (no.$) | 5,139 | 4,997 |
| Homo tetramer (no.$) | 69,552 | 60,220 |
| Homo pentamer (no.$) | 12,251 | 8,490 |
| Hetero pentamer (no.$) | 309,745 | 217,330 |
| Total (no.$) | 396,687 | 291,037 |
| Homo trimer (%#) | 1.30% | 1.72% |
| Homo tetramer {%*) | 17.53% | 20.69% |
| Homo pentamer (%#) | 3.09% | 2.92% |
| Hetero pentamer (%#) | 78.08% | 74.67% |
Notes:
Number of micrographs.
Number of particles kept for the final reconstruction.
Percentage of the particles associated with each distinct receptor assembly.
Supplementary Material
Acknowledgements
We thank L. Sivilotti, F. Jalali-Yazdi, C. Sun and R. Hallford for discussions and suggestions. We thank L. Vaskalis for assistance with figures. We thank J. Guidry for assisting with the proteomics work. The LSUHSC Proteomics Core is supported by the Louisiana State University School of Medicine Office of the Dean. We thank D. Claxton and D. Cawley for the monoclonal antibody. A portion of this research was supported by NIH grant U24GM129547 and performed at the PNCC at OHSU and accessed through EMSL (grid.436923.9), a DOE Office of Science User Facility sponsored by the Office of Biological and Environmental Research. This work was supported by NIH grant 5R01 GM100400 to E.G. E.G. is an investigator of the Howard Hughes Medical Institute.
Footnotes
Competing Interests
The authors declare no competing interests.
Supplementary Information is available for this paper. Correspondence and requests for materials should be addressed to E.G. Reprints and permissions information is available at www.nature.com/reprints.
Data Availability
The coordinates and volumes for the cryo-EM data have been deposited in the Electron Microscopy Data Bank under accession codes EMD-23910, EMD-23911, EMD-23912 and EMD-23913. The coordinates have been deposited in the Protein Data Bank under accession codes 7MLU, 7MLV and 7MLY.
Main References
- 1.Legendre P The glycinergic inhibitory synapse. Cell Mol. Life Sci 58, 760–793 (2001). [DOI] [PMC free article] [PubMed] [Google Scholar]
- 2.Lynch JW Molecular structure and function of the glycine receptor chloride channel. Physiol. Rev 84, 1051–1095 (2004). [DOI] [PubMed] [Google Scholar]
- 3.Shiang R et al. Mutations in the alpha 1 subunit of the inhibitory glycine receptor cause the dominant neurologic disorder, hyperekplexia. Nat. Gene.t 5, 351–358 (1993). [DOI] [PubMed] [Google Scholar]
- 4.Grudzinska J et al. The beta subunit determines the ligand binding properties of synaptic glycine receptors. Neuron 45, 727–739 (2005). [DOI] [PubMed] [Google Scholar]
- 5.Langosch D, Thomas L & Betz H Conserved quaternary structure of ligand-gated ion channels: the postsynaptic glycine receptor is a pentamer. Proc. Natl. Acad. Sci. U S A 85, 7394–7398 (1988). [DOI] [PMC free article] [PubMed] [Google Scholar]
- 6.Yang Z, Taran E, Webb TI & Lynch JW Stoichiometry and subunit arrangement of alpha1beta glycine receptors as determined by atomic force microscopy. Biochemistry 51, 5229–5231 (2012). [DOI] [PubMed] [Google Scholar]
- 7.Burzomato V, Groot-Kormelink PJ, Sivilotti LG & Beato M Stoichiometry of recombinant heteromeric glycine receptors revealed by a pore-lining region point mutation. Recept Channels 9, 353–361 (2003). [DOI] [PubMed] [Google Scholar]
- 8.Durisic N et al. Stoichiometry of the human glycine receptor revealed by direct subunit counting. J. Neurosci 32, 12915–12920 (2012). [DOI] [PMC free article] [PubMed] [Google Scholar]
- 9.Shan Q, Han L & Lynch JW Distinct properties of glycine receptor beta+/alpha− interface: unambiguously characterizing heteromeric interface reconstituted in homomeric protein. J. Biol. Chem 287, 21244–21252 (2012). [DOI] [PMC free article] [PubMed] [Google Scholar]
- 10.Shan Q, Haddrill JL & Lynch JW A single beta subunit M2 domain residue controls the picrotoxin sensitivity of alphabeta heteromeric glycine receptor chloride channels. J. Neurochem 76 1109–1120 (2001). [DOI] [PubMed] [Google Scholar]
- 11.Meyer G, Kirsch J, Betz H & Langosch D Identification of a gephyrin binding motif on the glycine receptor beta subunit. Neuron 15, 563–572 (1995). [DOI] [PubMed] [Google Scholar]
- 12.Graham D, Pfeiffer F, Simler R & Betz H Purification and characterization of the glycine receptor of pig spinal cord. Biochemistry 24, 990–994 (1985). [DOI] [PubMed] [Google Scholar]
- 13.Dutertre S, Becker CM & Betz H Inhibitory glycine receptors: an update. J. Biol. Chem 287, 40216–40223 (2012). [DOI] [PMC free article] [PubMed] [Google Scholar]
- 14.Toyoshima C & Unwin N Three-dimensional structure of the acetylcholine receptor by cryoelectron microscopy and helical image reconstruction. J. Cell Biol 111, 2623–2635 (1990). [DOI] [PMC free article] [PubMed] [Google Scholar]
- 15.Yu H, Bai X.-c. & Wang W Characterization of the subunit composition and structure of native adult glycine receptors. bioRxiv, 2021.2005.2017.444520, doi: 10.1101/2021.05.17.444520 (2021). [DOI] [PubMed] [Google Scholar]
- 16.Kuhse J, Laube B, Magalei D & Betz H Assembly of the inhibitory glycine receptor: identification of amino acid sequence motifs governing subunit stoichiometry. Neuron 11, 1049–1056 (1993). [DOI] [PubMed] [Google Scholar]
- 17.Yu J et al. Mechanism of gating and partial agonist action in the glycine receptor. Cell 184, 957–968.21 (2021). [DOI] [PMC free article] [PubMed] [Google Scholar]
- 18.Hille B Ion Channels of Excitable Membranes. 3rd edn., (Sinauer, Sunderland, 2001). [Google Scholar]
- 19.Kumar A et al. Mechanisms of activation and desensitization of full-length glycine receptor in lipid nanodiscs. Nat. Commun 11, 3752 (2020). [DOI] [PMC free article] [PubMed] [Google Scholar]
- 20.Hibbs RE & Gouaux E Principles of activation and permeation in an anion-selective Cys-loop receptor. Nature 474, 54–60 (2011). [DOI] [PMC free article] [PubMed] [Google Scholar]
- 21.Masiulis S et al. GABAA receptor signalling mechanisms revealed by structural pharmacology. Nature 565, 454–459 (2019). [DOI] [PMC free article] [PubMed] [Google Scholar]
- 22.Todorovic J, Welsh BT, Bertaccini EJ, Trudell JR & Mihic SJ Disruption of an intersubunit electrostatic bond is a critical step in glycine receptor activation. Proc. Natl. Acad. Sci. U S A 107, 7987–7992 (2010). [DOI] [PMC free article] [PubMed] [Google Scholar]
- 23.Phulera S et al. Cryo-EM structure of the benzodiazepine-sensitive alpha1beta1gamma2S tri-heteromeric GABAA receptor in complex with GABA. Elife 7, doi: 10.7554/eLife.39383 (2018). [DOI] [PMC free article] [PubMed] [Google Scholar]
- 24.Kloda JH & Czajkowski C Agonist-, antagonist-, and benzodiazepine-induced structural changes in the alpha1 Met113-Leu132 region of the GABAA receptor. Mol. Pharmacol 71, 483–493 (2007). [DOI] [PubMed] [Google Scholar]
- 25.Liu S et al. Cryo-EM structure of the human alpha5beta3 GABAA receptor. Cell Res. 28, 958–961 (2018). [DOI] [PMC free article] [PubMed] [Google Scholar]
- 26.Walsh RM Jr. et al. Structural principles of distinct assemblies of the human alpha4beta2 nicotinic receptor. Nature 557, 261–265 (2018). [DOI] [PMC free article] [PubMed] [Google Scholar]
- 27.Green WN & Claudio T Acetylcholine receptor assembly: subunit folding and oligomerization occur sequentially. Cell 74, 57–69 (1993). [DOI] [PubMed] [Google Scholar]
- 28.Klausberger T et al. Detection and binding properties of GABA(A) receptor assembly intermediates. J. Biol. Chem 276, 16024–16032 (2001). [DOI] [PubMed] [Google Scholar]
- 29.Blount P & Merlie JP Molecular basis of the two nonequivalent ligand binding sites of the muscle nicotinic acetylcholine receptor. Neuron 3, 349–357 (1989). [DOI] [PubMed] [Google Scholar]
- 30.Hattori M, Hibbs RE & Gouaux E A fluorescence-detection size-exclusion chromatography-based thermostability assay for membrane protein precrystallization screening. Structure 20, 1293–1299 (2012). [DOI] [PMC free article] [PubMed] [Google Scholar]
Method References
- 31.Du J, Lu W, Wu S, Cheng Y & Gouaux E Glycine receptor mechanism elucidated by electron cryo-microscopy. Nature 526, 224–229 (2015). [DOI] [PMC free article] [PubMed] [Google Scholar]
- 32.Kawate T & Gouaux E Fluorescence-detection size-exclusion chromatography for precrystallization screening of integral membrane proteins. Structure 14, 673–681 (2006). [DOI] [PubMed] [Google Scholar]
- 33.Goehring A et al. Screening and large-scale expression of membrane proteins in mammalian cells for structural studies. Nat. Protoc 9, 2574–2585 (2014). [DOI] [PMC free article] [PubMed] [Google Scholar]
- 34.Cook N, Harris A, Hopkins A & Hughes K Scintillation proximity assay (SPA) technology to study biomolecular interactions. Curr. Protoc. Protein Sci. Chapter 19, Unit 19.8 (2002). [DOI] [PubMed] [Google Scholar]
- 35.Cheng Y & Prusoff WH Relationship between the inhibition constant (K1) and the concentration of inhibitor which causes 50 per cent inhibition (I50) of an enzymatic reaction. Biochem. Pharmacol 22, 3099–3108 (1973). [DOI] [PubMed] [Google Scholar]
- 36.Mastronarde DN Automated electron microscope tomography using robust prediction of specimen movements. J. Struct. Biol 152, 36–51 (2005). [DOI] [PubMed] [Google Scholar]
- 37.Zheng SQ et al. MotionCor2: anisotropic correction of beam-induced motion for improved cryo-electron microscopy. Nat. Methods 14, 331–332 (2017). [DOI] [PMC free article] [PubMed] [Google Scholar]
- 38.Zhang K Gctf: Real-time CTF determination and correction. J. Struct. Biol 193, 1–12 (2016). [DOI] [PMC free article] [PubMed] [Google Scholar]
- 39.Punjani A, Rubinstein JL, Fleet DJ & Brubaker MA cryoSPARC: algorithms for rapid unsupervised cryo-EM structure determination. Nat. Methods 14, 290–296 (2017). [DOI] [PubMed] [Google Scholar]
- 40.Henderson R Avoiding the pitfalls of single particle cryo-electron microscopy: Einstein from noise. Proc. Natl. Acad. Sci. U S A 110, 18037–18041 (2013). [DOI] [PMC free article] [PubMed] [Google Scholar]
- 41.Jakobi AJ, Wilmanns M & Sachse C Model-based local density sharpening of cryo-EM maps. Elife 6, doi: 10.7554/eLife.27131 (2017). [DOI] [PMC free article] [PubMed] [Google Scholar]
- 42.Pettersen EF et al. UCSF Chimera--a visualization system for exploratory research and analysis. J. Comput. Chem 25, 1605–1612 (2004). [DOI] [PubMed] [Google Scholar]
- 43.Emsley P & Cowtan K Coot: model-building tools for molecular graphics. Acta Crystallogr. D Biol. Crystallogr 60, 2126–2132 (2004). [DOI] [PubMed] [Google Scholar]
- 44.Afonine PV et al. Real-space refinement in PHENIX for cryo-EM and crystallography. Acta Crystallogr. D Struct. Biol 74, 531–544 (2018). [DOI] [PMC free article] [PubMed] [Google Scholar]
Associated Data
This section collects any data citations, data availability statements, or supplementary materials included in this article.
Supplementary Materials
Data Availability Statement
The coordinates and volumes for the cryo-EM data have been deposited in the Electron Microscopy Data Bank under accession codes EMD-23910, EMD-23911, EMD-23912 and EMD-23913. The coordinates have been deposited in the Protein Data Bank under accession codes 7MLU, 7MLV and 7MLY.


