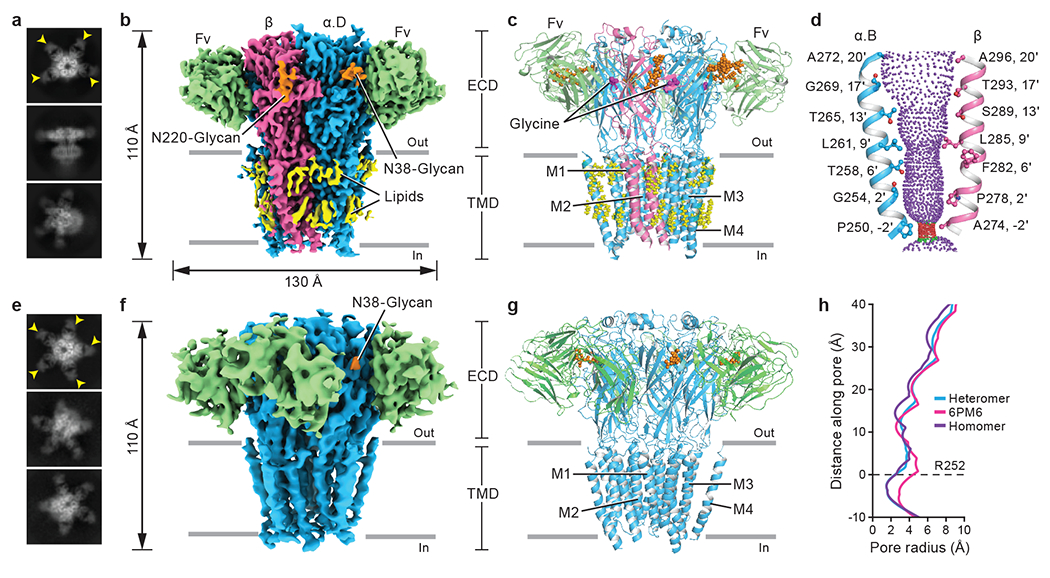
Fig. 1. Architecture of native heteromeric and homomeric GlyRs.

a, e, 2D class averages of heteromeric (a) and homomeric (e) GlyRs. Yellow arrows indicate bound 3D1 Fab. b, f, Side views of the sharpened cryo-EM maps of heteromeric (b) and homomeric (f) GlyRs. 3D1 Fabs, α, β, N-glycans and lipids are colored in green, blue, salmon, orange and yellow, respectively. The four α subunits in heteromeric GlyRs are denoted as α.A, α.B, α.C and α.D in counter clockwise direction viewed from ECD side. c, g, Side views of the atomic models of heteromeric (c) and homomeric (g) GlyRs, respectively. GlyRs are in cartoon representation, with N-glycans and lipids in sphere representation. Subunit coloring as in panels (b) and (f). d, Shape and size of the ion permeation pathway in the heteromeric GlyR. M2 helices from the α.B and β subunits are shown as cartoons and the side chains of pore-lining residues in ball-stick representation. Purple, green and red spheres define radii of > 3.3 Å, 1.8-3.3 Å, and < 1.8 Å, respectively. h, Profile of pore radii calculated by HOLE program for native heteromeric GlyR (blue), native homomeric α pentamer (purple) and open state homomeric α pentamer bound with glycine (PDB ID: 6PM6; pink). The Cα position of αArg252 in heteromeric GlyR is set to zero (0’). Figures for density maps and the corresponding models were generated by ChimeraX and Pymol.
