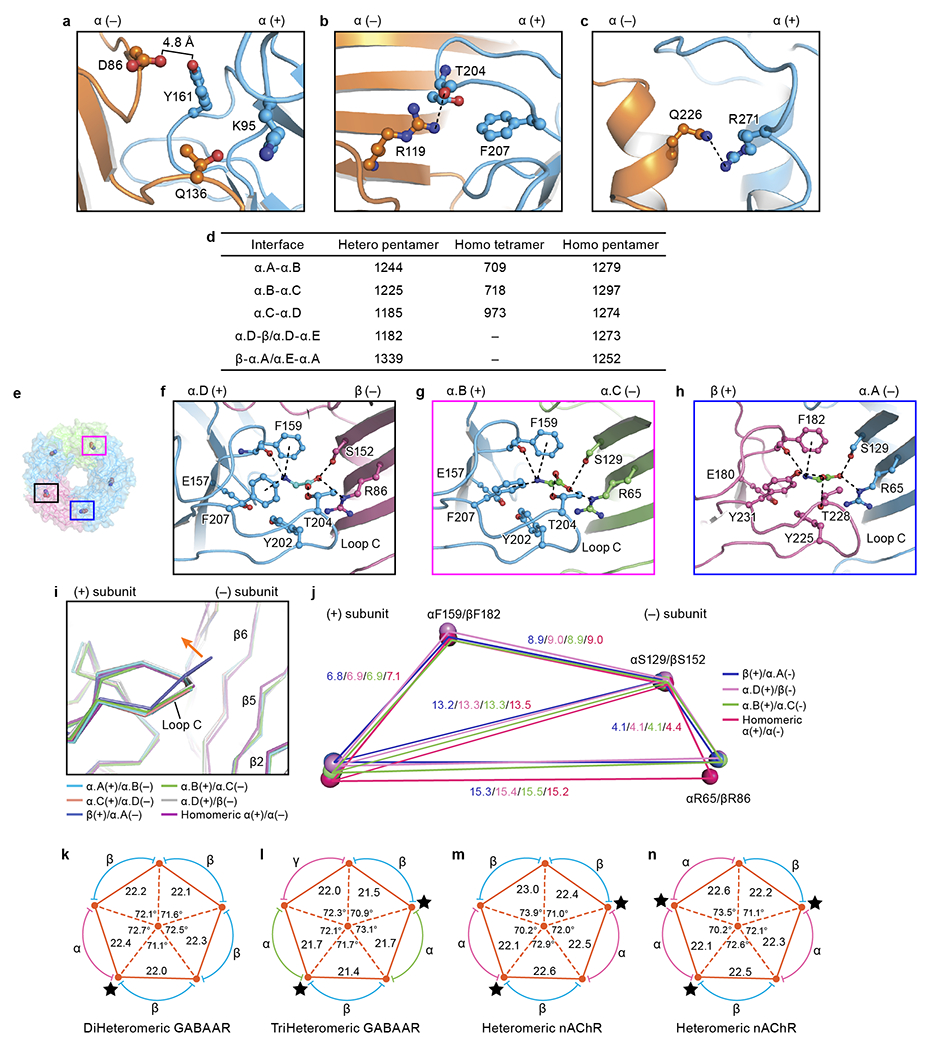
Extended Data Fig. 7. Structural metrics related with the interfaces.

a-c, View of the interface interactions of native homomeric α1 pentamer (see Fig. 2c–e). d, The summary of the buried areas for heteromeric pentamer, homomeric α tetramer and homomeric α1 pentamer. The areas are given in Å2. e, Top down view of heteromeric GlyR in surface and ribbon representation. The glycine molecules are shown in sphere representation. The α.A and α.D are in blue. The β subunit and α.C subunits are colored in salmon and lime, respectively. The boxed areas are enlarged in panels (f) to (h). f-h, Views of the binding pockets at α.D(+)/β(−) (f), α.B(+)/α.C(−) (g) and β(+)/α.A(−) (h) interfaces, respectively. The glycine molecules are shown in ball-stick representations with oxygen in red, nitrogen in blue and carbon in green. The possible hydrogen bonds and cation-pi interactions are shown as dashed lines. i, Superposition of the orthostatic binding sites. The binding sites are overlapped by the ECD of the principle side subunits. Orange arrows indicate the movement of loop C. j, Schematic diagram illustrating the relative positions of the amino acids in the binding pockets. The blue, pink, green and red polygon are created by the connection of the Cα atoms of these crucial amino acids at the β(+)/α.A(−), α.D(+)/β(−), α.B(+)/α.C(−) and native homomeric α(+)/α(−) interfaces, respectively. k-n, Schematic diagram illustrating the distances and angles related with the interfaces of Cys-loop family members including GABAAR (k, PDB ID: 6A96; l, PDB ID: 6DW1) and nAChR (m, PDB ID: 6CNJ; n, PDB ID: 6CNK; see Fig. 2f). The black star indicates the binding pocket bound with ligand. All distances are given in Å and the angles are given in degree.
