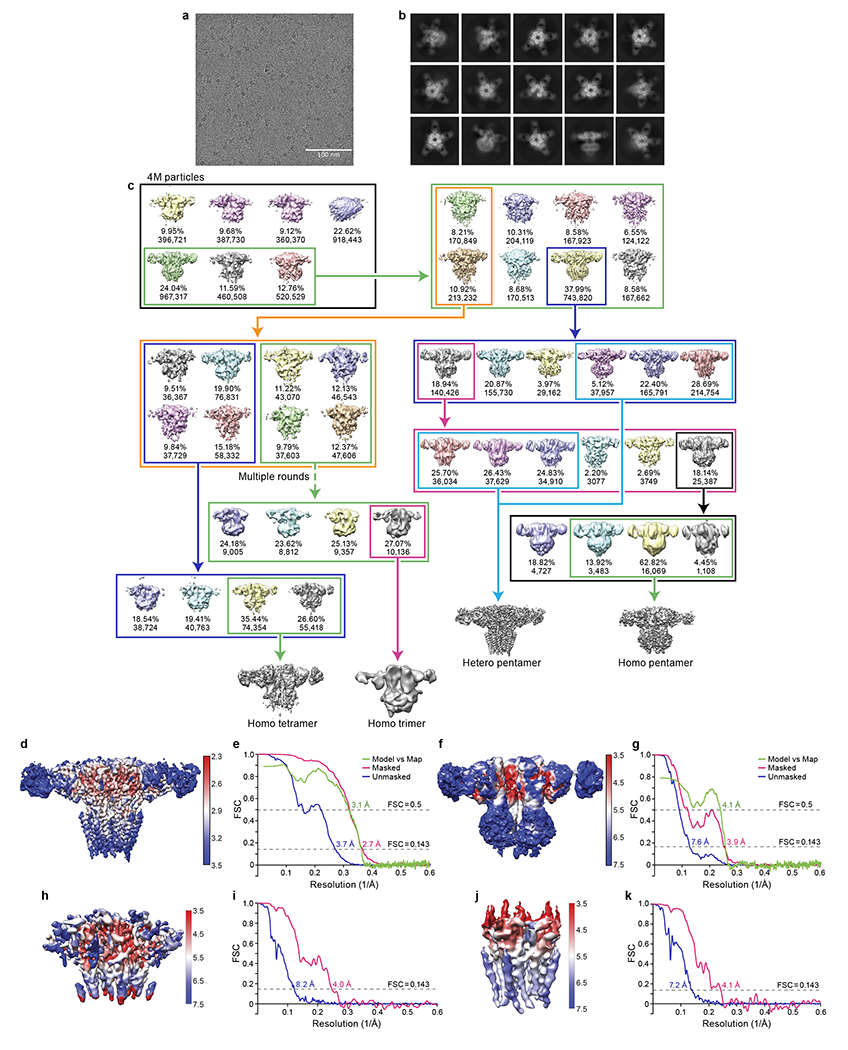
Extended Data Fig. 2. 3D reconstruction of native GlyRs.

a, A typical cryo-EM micrograph for native GlyRs. The experiments were repeated three times with similar results. b, Selected 2D class averages for native GlyR-Fab complex. c, Flow chart for cryo-EM data analysis of native GlyRs. d, f, h, j, Local resolution maps for unsharpened heteromeric pentamer (d), homomeric α tetramer (f), locally refined ECD (h) and TMD map (j) of homomeric pentamer. e, g, i, k, FSC curves for heteromeric pentamer (e), homomeric α tetramer (g), locally refined ECD (i) and TMD map (k) of homomeric α pentamer.
