

Abstract
Alzheimer’s disease (AD) is associated with abnormal calcium signaling, a pathway regulated by the calcium-dependent protein phosphatase. This study aimed to investigate the molecular function of protein phosphatase 3 regulatory subunit B (PPP3R1) underlying AD, which may provide novel insights for the predictive diagnostics, targeted prevention, and personalization of medical services in AD by targeting PPP3R1. A total of 1860 differentially expressed genes (DEGs) from 13,049 background genes were overlapped in AD/control and PPP3R1-low/high cohorts. Based on these DEGs, six co-expression modules were constructed by weight gene correlation network analysis (WGCNA). The turquoise module had the strongest correlation with AD and low PPP3R1, in which DEGs participated in axon guidance, glutamatergic synapse, long-term potentiation (LTP), mitogen-activated protein kinase (MAPK), Ras, and hypoxia-inducible factor 1 (HIF-1) signaling pathways. Furthermore, the cross-talking pathways of PPP3R1, such as axon guidance, glutamatergic synapse, LTP, and MAPK signaling pathways, were identified in the global regulatory network. The area under the curve (AUC) analysis showed that low PPP3R1 could accurately predict the onset of AD. Therefore, our findings highlight the involvement of PPP3R1 in the pathogenesis of AD via axon guidance, glutamatergic synapse, LTP, and MAPK signaling pathways, and identify downregulation of PPP3R1 as a potential biomarker for AD treatment in the context of 3P medicine—predictive diagnostics, targeted prevention, and personalization of medical services.
Supplementary Information
The online version contains supplementary material available at 10.1007/s13167-021-00261-2.
Keywords: PPP3R1, protein phosphatase 3 regulatory subunit B; Alzheimer’s disease; Pathway; Differential expression; Co-expression network; Predictive preventive personalized medicine (PPPM)
Introduction
Calcium signaling dysfunction in AD
Alzheimer’s disease (AD) is the primary cause of dementia characterized by irreversible and progressive cognitive decline, along with behavioral and psychiatric alterations of differing extent [1, 2]. This clinical entity has emerged as a public health problem affecting millions of individuals worldwide, a number that is expected to reach as high as 151 million by 2050 [3–5]. Neurodegenerative disorders including AD are generally intervened after the onset of the disease, which is an obviously delayed approach from the standpoint of predictive, preventive, and personalized medicine (PPPM) [6]. In fact, the application of PPPM could not be more relevant to AD with incurable and predictably hereditary hallmarks, a holistic strategy designed to predict individual predisposition, provide targeted prevention, and create personalized treatment across the healthcare system [7, 8]. Much effort is directed towards AD-related genes under the advanced paradigm of PPPM, such as PP2A, RGS2, TOMM40, and APOE4 [9–11], which may represent the greatest opportunity of early diagnosis and intervention with the disease. However, genetic markers associated with calcium ion (Ca2+) signaling in the pathogenesis of AD have not been well investigated. Historically, it has long been shown that Ca2+ mediates the most important signal-transduction cascades in AD, and dysregulation of Ca2+ intracellular signaling is thought to trigger AD neuropathy, including senile plaques consisted of amyloid beta (Aβ) and neurofibrillary tangles composed of hyperphosphorylated tau [12, 13]. On the other hand, Braak stages induced by Aβ aggregation and neurofibrillary tau tangles have also been observed to correspond to the severity of Ca2+ dyshomeostasis, lending support for a crucial role of Ca2+ signaling perturbation during AD neurodegeneration [14].
The structure and function of PPP3R1
With this background, we focus on the initial etiology and therapeutic targets of AD in relation to a key mediator of Ca2+-responsive signaling pathway, namely protein phosphatase 3 regulatory subunit B (PPP3R1). Structurally, PPP3R1 is a 19 kDa calcium-binding regulatory subunit of the Ca2+-dependent protein phosphatase (also termed as calcineurin) that is abundantly expressed in the cytoplasm of neurons [15, 16]. It is now known that PPP3R1, rather than another 60 kDa catalytic subunit of calcineurin, functions to regulate calcineurin activity and is inversely associated with AD neuropathy as well as clinical dementia rating (CDR) [17]. Moreover, individuals carrying rs1868402 minor allele showed a profoundly lower amount of PPP3R1 expression, which facilitated the hyperphosphorylation of tau and the deterioration of Braak tangle stage, pointing to a causal relationship between PPP3R1 and the pathophysiology of AD [18]. Nevertheless, genomic mechanisms underlying AD onset attributable to altered PPP3R1 remain elusive. Accordingly, this promotes us to perform an integrative genomic analysis based on gene expression data and functional annotations to elucidate the molecular role of PPP3R1 in the pathogenesis of AD, which is conducive to the targeted prevention and personalized treatment of AD from the perspective of PPPM.
Study assumptions and expected impacts
We infer that PPP3R1 is significantly differentially expressed in the brains of established AD patients relative to those of non-dementia controls. All functional co-expressed genes interacting with PPP3R1 are extracted to construct a global regulatory network, from which the mechanistic pathways of PPP3R1 underlying AD are identified by functional enrichment analysis. These findings would provide novel evidence that the altered PPP3R1 expression is suggestive of a potential biomarker for AD in PPPM practice.
Materials and methods
Data resources
Gene expression profiles including GSE132903, GSE118553, GSE5281, GSE37264, and GSE36980 were downloaded from the Gene Expression Omnibus (GEO, https://www.ncbi.nlm.nih.gov/geo/) database (Table 1) [19]. The details of phenotypic information of samples are listed in Supplementary Table S1. Ribonucleic acid sequencing (RNA-seq) data were obtained from temporal cortex tissues between 176 AD patients and 160 non-dementia controls. Subjects with a clinical and/or pathological diagnosis of AD should meet the standardized inclusion criteria referring to our previous study [20]. After the processing of normalization by using the normalizeBetweenArrays function, all data were merged into a new dataset. Thereafter, the removeBatchEffect function in limma package of R software was used to eliminate batch effects of the combined gene profiles [21].
Table 1.
Sample information for AD and non-dementia controls. AD, Alzheimer’s disease; GEO, Gene Expression Omnibus
Gene set enrichment analysis (GSEA)
Gene functional annotation of GSEA was conducted to enrich biological process (BP) of Gene Ontology (GO) terms adopting ClusterProfler, enrichplot, and GSEABase packages, by which the statistically significant and concordant differences of functions were evaluated in a pre-ranked gene set between two biological states [22, 23]. The number of permutations was set to 1000, with a pvaluecutoff of 0.05 for significant enrichment. The visualization of GSEA data was accomplished by utilizing the ggplot2 package.
Differential expression analysis
Using lmFit and eBayes functions, RNA-seq data were compared between AD and non-dementia controls to filter differentially expressed genes (DEGs) according to the false discovery rate (FDR) controlling procedures [24]. Analyses of two-dimensional hierarchical clustering were performed employing the limma package. During screening and clustering processes, DEG expression was visualized through volcano plots and heatmaps. Fold change (FC) ≥ 1.3 and FDR-adjusted p < 0.05 were adopted as comparison criteria and threshold to define the DEGs in AD/control and PPP3R1-low/high groups [25–27].
Co-expression network analysis
The overlapped DEGs between AD/control and PPP3R1-low/high cohorts were extracted for weight gene correlation network analysis (WGCNA). Outliers were eliminated in the sample clustering diagram adopting the hclust function, so as to assure the reliability of co-expression network results. The soft threshold power was set to 8 by using the pickSoftThreshold function, which could guarantee the integral connectivity of co-expression modules and make the network infinitely close to the real biological status [28]. Correlation coefficients between genes were calculated to construct a hierarchical clustering tree, in which branches of module eigengene (ME) > 30 genes were reassembled into co-expression modules with assigned color labels [29, 30]. The clusterProfiler package was applied to perform the functional enrichment analysis of Kyoto Encyclopedia of Genes and Genomes (KEGG) pathways.
Global regulatory network and cross-talking pathways of PPP3R1
The verboseScatterplot function was employed to plot a scatter diagram between module membership (MM, indicating the connectivity within a module) and gene significance (GS, representing the phenotype of a module) [31]. Interactions of DEGs were estimated through an online database termed STRING (Search Tool for the Retrieval of Interacting Genes, http://www.stringdb.org/), which could provide information on experimental and predicted protein-protein interactions [32]. The cytoscape software was utilized to construct a global regulatory network to visualize the interactions of PPP3R1 with other DEGs and the cross-talking pathways of PPP3R1 [33, 34].
Diagnostic performance of PPP3R1 in AD
The performance of the sequential output dichotomy was evaluated by receiver operating characteristic curve (ROC) analysis [35]. When the output threshold was within the scope of all possible values, the performance of the classifier, including sensitivity and specificity, was measured by the area under the curve (AUC) value [36]. Diagnostic performance of PPP3R1 in differentiating AD cases from non-dementia controls was assessed by the pROC function. An AUC value of 50% indicated random prediction, while an AUC value of 100% represented complete selection. All p values were bilateral, with a p < 0.05 considered as the standard of statistically significant difference.
Results
Identification of differentially expressed genes
The procedure for this study was followed by steps outlined in the flowchart (Fig. 1). As shown in Fig. 2a, the mean expression of PPP3R1 in temporal lobes of 176 AD (8.34 ± 0.72) was significantly lower than those in 160 non-dementia controls (8.89 ± 0.65; p < 0.001). After removing unannotated and duplicate genes, 13,049 background genes were integrated for differential expression analysis. There were 2163 DEGs (1067 upregulated and 1096 downregulated) in AD relative to non-dementia controls (Fig. 2b), while 2977 DEGs (1447 upregulated and 1530 downregulated) were differentially expressed in PPP3R1-low compared with high cohort (Fig. 2c). Of these, 1860 DEGs (895 upregulated and 965 downregulated) were overlapped from AD/control and PPP3R1-low/high cohorts (see Supplementary Table S2). Heatmap of the top 50 upregulated and downregulated DEGs between AD and non-dementia controls is exhibited in Fig. 2d.
Fig. 1.
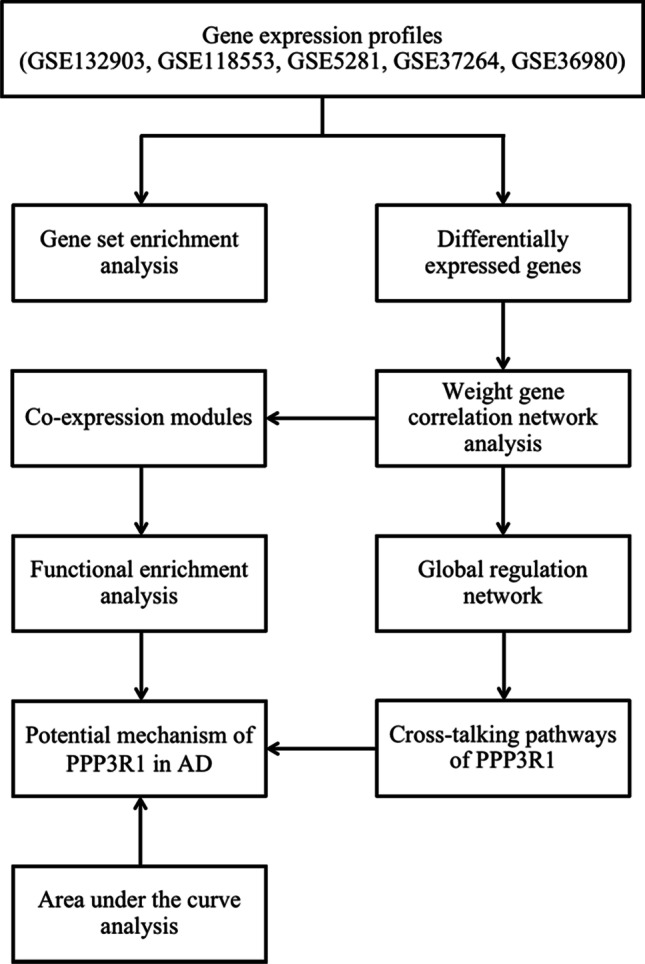
The flowchart of study design. AD: Alzheimer’s disease
Fig. 2.

Differential expression analysis. (a) Comparison of PPP3R1 expression in AD relative to non-dementia controls. (b and c) Volcano plots of DEGs in AD/control and PPP3R1-low/high groups: blue indicates downregulated and red represents upregulated. (d) The heatmap of expression for the top 50 downregulated and upregulated DEGs: green to red represents a change in gene expression from downregulated to upregulated. AD, Alzheimer’s disease; DEGs, differentially expressed genes
Co-expression module construction and functional enrichment analysis
In the clustering process, 266 out of 336 samples met the threshold of height less than 35, which were hierarchically clustered by the average linkage (Fig. 3a). Six modules were established by WGCNA, of which the grey module consisting of non-co-expressed genes was defined as a non-functional module (Fig. 3b). Heatmap of module-trait relationships (Fig. 3c) showed that the turquoise module had the strongest negative correlation with AD (correlation coefficient = − 0.45, p = 2e − 14) and the strongest positive correlation with PPP3R1 expression (correlation coefficient = 0.74, p = 2e − 46); the brown module was negatively correlated with AD (correlation coefficient = − 0.42, p = 1e − 12) and positively correlated with PPP3R1 expression (correlation coefficient = 0.4, p = 1e − 11); green, blue, and yellow modules had positive correlation with AD (green: correlation coefficient = 0.3, p = 6e − 7; blue: correlation coefficient = 0.44, p = 7e − 14; yellow: correlation coefficient = 0.39, p = 5e − 11) and negative correlation with PPP3R1 expression (green: correlation coefficient = − 0.3, p = 5e − 07; blue: correlation coefficient = − 0.59, p = 9e − 27; yellow: correlation coefficient = − 0.54, p = 1e − 21). Annotation of KEGG pathway (Fig. 3d) was conducted by functional enrichment analysis, showing that the turquoise module was involved in axon guidance, glutamatergic synapse, long-term potentiation (LTP), mitogen-activated protein kinase (MAPK), Ras, and hypoxia-inducible factor 1 (HIF-1) signaling pathways; the brown module was enriched in synaptic vesicle cycle and carbon metabolism; the green module participated in pyruvate metabolism; the blue module was implicated in carbon metabolism and regulation of actin cytoskeleton; the yellow module participated in MAPK signaling pathway.
Fig. 3.

Weighted correlation network analysis. (a) Sample dendrogram and trait heatmap. (b) Cluster dendrogram of DEGs with different module colors: grey indicates non-clustering module. (c) Module-trait relationships: green to red indicates a negative to positive correlation between modules and phenotypes. (d) KEGG pathways enriched by module genes. AD, Alzheimer’s disease; KEGG, Kyoto Encyclopedia of Genes and Genomes
Module-pathway regulatory network and AUC analysis
As shown in Fig. 4a, scatter diagram of the relationship between MM and GS displayed significant correlation of intramodular connectivity with genetic phenotypes in created modules (turquoise: correlation coefficient = 0.83, p < 1e − 200; brown: correlation coefficient = 0.19, p = 0.071; green: correlation coefficient = 0.086, p = 0.55; blue: correlation coefficient = 0.69, p = 1e − 15; yellow: correlation coefficient = 0.35, p = 0.074). Thereafter, DEGs of the turquoise module were presented in the global regulatory network (Fig. 4b), which were most strongly interacted with low PPP3R1 expression and AD. Based on these DEGs, the cross-talking pathways of PPP3R1 were determined (Fig. 4c), indicating the that low PPP3R1 expression is involved in AD through axon guidance, glutamatergic synapse, LTP, and MAPK signaling pathways. Detailed data of MM and GS for each DEG in co-expressed modules are listed in Supplementary Table S3. The result of AUC analysis (AUC = 67.4%) exhibited a good diagnostic performance of low PPP3R1 expression in AD onset (Fig. 4d).
Fig. 4.

Module-pathway regulatory network and AUC analysis. (a) Scatter plot of relationship between module membership and gene significance. (b) Global regulatory network of genes in blue and turquoise modules: larger nodes reflect higher connectivity of genes; blue and yellow indicate downregulated; red represents upregulated. (c) Cross-talking pathways of PPP3R1: yellow indicates downregulated PPP3R1. (d) AUC analysis in AD prediction. AD: Alzheimer’s disease, AUC: area under the curve, GS: gene significance, MM: module membership
Validation of biological processes by GSEA
GSEA analysis was performed to verify the overall gene enrichment differences between two predefined groups. In AD group (Fig. 5a), functions of pre-ranked gene set were distributed in the BPs of calcium ion–regulated exocytosis, neurotransmitter secretion, signal release from synapse, synaptic vesicle cycle, and synaptic vesicle transport. In PPP3R1-low group (Fig. 5b), the enriched BPs were primarily related to calcium ion–regulated exocytosis, endothelium development, neurotransmitter secretion, signal release from synapse, and synaptic vesicle transport.
Fig. 5.

Gene set enrichment analysis. (a) BP of gene set enrichment analysis enriched in AD. (b) BP of gene set enrichment analysis enriched in PPP3R1-low group. AD: Alzheimer’s disease, BP: biological process
Discussion
Screening the potential susceptibility genes and uncovering their biological pathways in AD is thought to be an effective strategy for predictive diagnosis, targeted prevention, and personalized therapy of the disease [7]. In this study, we took advantage of publicly available RNA-seq data to screen differentially expressed genes between AD and non-dementia controls, and determined downregulation of PPP3R1 as the target gene of AD. Among 13,049 background genes, 1860 DEGs were overlapped in both AD/control and PPP3R1-low/high cohorts. The original reports of GSEA analysis suggested that core enrichment genes were involved in calcium ion–regulated exocytosis, neurotransmitter secretion, signal release from synapse, and synaptic vesicle transport. Noteworthily, these biological processes were significantly associated with AD and low PPP3R1, highlighting the role of low PPP3R1 in Ca2+-responsive signaling transduction in AD development [37]. Herein, co-expression modules and a global regulatory network of DEGs interacting with PPP3R1 were constructed to illuminate the mechanistic pathways of PPP3R1 in the pathophysiology of AD, which might have crucial clinical utility for the development of AD biomarkers in the context of PPPM.
PPP3R1 mediates AD through axon guidance
The co-expression module analysis revealed that the turquoise module was overwhelmingly related to AD and PPP3R1 expression, and its DEGs were mainly enriched in axon guidance, glutamatergic synapse, LTP, MAPK, Ras, and HIF-1 signaling pathways. Among them, the cross-talking pathways of PPP3R1 in AD onset, including axon guidance, glutamatergic synapse, LTP, and MAPK signaling pathways, were enriched by pathway enrichment analyses. In terms of axon guidance, impaired axon function is detectable long before neuronal loss and clinical symptoms appear in most neurodegenerative diseases, especially AD [38–40]. Indeed, axon maintenance and repair are critical for the plasticity of the central nervous system, a process which requires the participation of axon guidance molecules such as netrin, ephrin, slit, and semaphorin [41]. For example, netrin is recognized to be a chemotactic cue of axon guidance modulating axon-neuron attraction or repulsion in Alzheimer model transgenic mice [42]. Mutations in Presenilin-1, a well-known pathogenic gene for AD, inhibit netrin expression and consequently axon growth, which provides additional evidence for a link between axon guidance and AD neurodegeneration [43]. Furthermore, axon guidance relies on a relatively large or a modest local Ca2+ signal stimulation within the growth cone, thus to enhance calcineurin activity for the repulsive conversion responses [44]. Interestingly, inhibition of calcineurin acts as an on–off switch that transforms neuro-axon repulsion into attraction, as demonstrated in cell culture lines of embryonic Xenopus spinal neurons [45]. Considering the regulatory effect of PPP3R1 on calcineurin activity [17], the above evidences are in line with our findings that low PPP3R1 is implicated in the pathogenesis of AD through axon guidance.
PPP3R1 mediates AD via glutamatergic synapse, LTP, and MAPK signaling pathways
With the exception of axon guidance, an extensive array of recent studies have shown that glutamatergic synapse pathway is also the focus of the treatment and prevention of AD [46–48]. As localized on dendritic spines, glutamatergic synapses contain α-amino3-hydroxy-5-methyl-4-isoxazolepropionic acid receptors (AMPARs) and N-methyl-D-aspartate receptors (NMDARs) known to be involved in synaptic transmission, neuronal survival, and apoptosis [49]. There is convincing evidence that Aβ oligomers not only decrease LTP (a pattern of synaptic enhancement after a transient and high frequency stimuli) via aberrant activation of NMDARs, but also increase long-term depression (LTD, a mode of synaptic attenuation after a low frequency stimuli) through internalization of AMPARs, both of which exert detrimental effects on glutamate synapses [50–53]. The resultant synaptic collapse can prevent the bond of glutamate to AMPARs and NMDARs, which in turn promotes Aβ generation and accelerates the progression of AD [54–56]. Alternatively, in vivo evidence linking MAPK signaling to AD comes from a middle-aged AβPP/PS1 mouse model, in which MAPK/ERK signaling pathway coupling with NMDARs has implications in genomic responses essential for synaptic plasticity and the encoding of long-term memories [57]. More specifically, oligomeric Aβ can inhibit glutamate uptake capacity of astrocytes and hyperactivate the NMDARs, an excitotoxic process dependent on the differential activity and complex equilibrium between MAPK cascades, including extracellular signal-regulated kinase (ERK), c-Jun N-terminal kinase (JNK), and p38 signaling [58]. Subsequently, an Aβ-induced overload of NMDA-dependent inward Ca2+ currents reinforce calcineurin activity in AD brains, which upregulates ERK and JNK signaling, and downregulates p38 signaling, leading to LTP impairment, hyperphosphorylated tau, and neuronal apoptosis [59–62]. Collectively, these data are likewise consistent with our outcomes with respect to the involvement of glutamatergic synapse, LTP, and MAPK signaling pathways in low PPP3R1-mediated AD.
The cross-talking pathways of PPP3R1 in AD
According to the scatterplot of the relationship between MM and GS, the turquoise module had the strongest correlation of DEGs with low PPP3R1 expression, which confirmed the previous conclusion of co-expression module analysis. Further cross-talking pathways of PPP3R1 were identified in the global regulatory network, supporting that the molecular functions of PPP3R1 in AD were derived from axon guidance, glutamatergic synapse, LTP, and MAPK signaling pathways. Therefore, the relationship between PPP3R1 and AD is more complicated than initially expected, and downregulation of PPP3R1 plays a pleiotropic role in the pathogenesis of AD. Several lines of evidence have converged on the hypothesis for the vulnerability to these relevant pathways induced by low PPP3R1, giving rise to deposition of Aβ and hyperphosphorylation of tau in AD neuropathology under a variety of pathogenic mechanisms [63–67]. In addition, the AUC analysis on diagnostic performance showed that low PPP3R1 could accurately distinguish AD from non-dementia controls, suggesting PPP3R1 to be a potential causative factor for AD. A large genome-wide association study using quantitative traits or endophenotypes has demonstrated that single-nucleotide polymorphisms in PPP3R1 modulate calcineurin activity to promote tau pathology and neurodegeneration in individuals with Aβ aggregation, resulting in an increased incidence of AD [18]. Similar observations were also conducted in the Cache County Dementia Progression Study (CCDPS), a population-based epidemiological research of dementia examining genetic and environmental risk factors, whereby specific variations of PPP3R1 have proven to be associated with faster cognitive decline in individuals diagnosed with AD [68]. The differential expression of PPP3R1 between AD and control group not only indicates the formation of AD pathology that can be used as a genetic marker for targeted prevention, but also implies the severity of AD clinical symptoms that can be highly recommended and implementable as an individualized diagnostic approach for patient stratification. Within the framework of PPPM, quantitative determination of PPP3R1 expression is useful for established and latent AD patients, who can be treated with different personalized interventions, such as non-pharmacological treatments (e.g., Mediterranean diet, physical exercise, music therapy, and cognitive training) for individuals with potential or mild cognitive impairment [69, 70], acetylcholinesterase inhibitors (e.g., donepezil, rivastigmine, galantamine, and tacrine) for mild-to-moderate AD [71–73], and the NMDAR antagonist (e.g., memantine) for moderate-to-severe AD [74]. It is encouragingly speculated that upregulating the expression of PPP3R1 in AD brains may alleviate the onset and progression of AD, which would be the optimal application of PPP3R1 in targeted prevention and therapeutics. Therefore, our findings combined with previous experimental data suggest that personalized measurements of PPP3R1 expression in AD neurodegeneration have important and profound implications for patient stratification, predictive diagnostics, targeted prevention, and personalization of medical services.
Limitations and future studies
There are some limitations of the present study that should be taken into consideration. One is that the definition of BP enrichment is largely based on different functional categories defined by GO terms, which possibly lacks sufficient rigorous expert scrutiny and high threshold for inclusion worthy of cautious interpretation [75, 76]. Another limitation is that the cross-talking pathways have not been validated by performing quantitative real-time polymerase chain reaction (qRT-PCR), Western blot, or immunohistological assays using cell lines, animal models, or AD patient samples, which may strengthen the reliability of our results. The dose–response relationship between the alteration of PPP3R1 expression and the occurrence and progression of AD needs to be further assessed by in vivo and in vitro experiments. Future long-term longitudinal observational research is also deserved to develop normal reference values for PPP3R1 that can be utilized to distinguish diagnosed or even potential AD from non-dementia controls and thus to optimize the strategy of PPPM for AD.
Conclusions and expert recommendations
Overall logic and objectives of the study
Through integrative genomic analysis on RNA-seq data, molecular identification and functional analysis of PPP3R1 in AD contribute to screening and mechanistic understanding of genetic markers for targeted prevention, differential diagnosis, disease prediction, and progression monitoring, an approach worthy of use in clinical practice conforming to subsequent steps of research to meet patient requirements and advance healthcare [77, 78]. In this study, we screened out 1860 overlapping DEGs between AD/control and PPP3R1-low/high cohorts. All the DEGs were grouped into five co-expressed modules with high statistical significance, indicating that genes in each module are transcriptionally correlated. Then, pathway enrichment analyses over genes in each module were performed to find out in what cellular processes the correlated genes working in, thereby providing a cellular level understanding of the co-expressed genes. We noted that pathways enriched by genes associated with low PPP3R1 expression and in the turquoise module exhibited strong statistical correlation with biological pathways that have previously identified to be strongly associated with AD. Having all such statistical results, DEGs of the turquoise module were extracted together to build a global regulatory network, in which the cross-talking pathways of PPP3R1, including axon guidance, glutamatergic synapse, LTP, and MAPK signaling pathways, were determined, thus discerning how low PRKCB expression is involved in the pathogenesis of AD. The AUC analysis exhibits a good performance of PPP3R1 in AD prediction, supporting the use of PPP3R1 as an effective biomarker of AD for targeted prevention, early diagnosis, and tailored treatments of pre-stages. Moreover, these findings provide novel insights and mechanistic pathways of PPP3R1 during the course of AD neurodegeneration, which also lay a foundation for targeted prevention, progression monitoring, prognostic assessment, and personalized medicine, thus to advance the development of PPP3R1 target-based strategies for PPPM practice.
Recommendations within the framework of PPPM practice
Herein, the downregulation of PPP3R1 in AD patients suggests dysregulation of Ca2+ intracellular signaling in AD pathophysiology, a gene that could be served as a potential predicative/therapeutic target for the onset and progression of AD. We recommended prospective clinical trials with large sample size to estimate the dose–response association of PPP3R1 expression with the risk and progression of AD by detecting PPP3R1 expression levels at different stages of Braak and/or CDR, which has more application value for early diagnosis, patient stratification, and prognostic assessment in AD. In addition, the pathogenesis of AD induced by low PPP3R1 is possibly mediated by axon guidance, glutamate synapses, LTP, and MAPK signaling pathways. These findings strongly imply the potential utility of the relevant cross-talking pathways for targeted prevention and personalized medicine of AD. Accordingly, we also recommend that further studies should focus on customized immunotherapy and gene therapy to modify or upregulate the expression of PPP3R1 in different individuals based on the susceptibility of low PPP3R1 to these cross-talking pathways, thereby providing greater possibilities for personalized therapy in the AD PPPM context.
Supplementary Information
Below is the link to the electronic supplementary material.
Clinical phenotypic data of samples. AD: Alzheimer’s disease Supplementary file1 (XLSX 21 KB)
Differentially expression of genes overlapped between AD/Control and PPP3R1-low/high groups. AD: Alzheimer’s disease Supplementary file2 (XLSX 184 KB)
MM and GS for each differentially expressed gene in different co-expression modules. MM, Module membership; GS, Gene significance Supplementary file3 (XLSX 431 KB)
Abbreviations
- Aβ
Amyloid beta
- AD
Alzheimer’s disease
- AMPARs
α-Amino3-hydroxy-5-methyl-4-isoxazolepropionic acid receptors
- AUC
Area under the curve
- BP
Biological process
- Ca2+
Calcium ion
- CCDPS
Cache County Dementia Progression Study
- CDR
Clinical dementia rating
- DEGs
Differentially expressed genes
- ERK
Extracellular signal-regulated kinase
- FC
Fold change
- FDR
False discovery rate
- GEO
Gene Expression Omnibus
- GO
Gene Ontology
- GS
Gene significance
- GSEA
Gene set enrichment analysis
- HIF-1
Hypoxia-inducible factor 1
- JNK
C-Jun N-terminal kinase
- KEGG
Kyoto Encyclopedia of Genes and Genomes
- LTD
Long-term depression
- LTP
Long-term potentiation
- MAPK
Mitogen-activated protein kinase
- ME
Module eigengene
- MM
Module membership
- NMDARs
N-methyl-D-aspartate receptors
- PPP3R1
Protein phosphatase 3 regulatory subunit B
- PPPM
Predictive, preventive, personalized medicine
- qRT-PCR
Quantitative real-time polymerase chain reaction
- RNA-seq
Ribonucleic acid sequencing
- ROC
Receiver operating characteristic curve
- STRING
Search Tool for the Retrieval of Interacting Genes
- WGCNA
Weight gene correlation network analysis
Author contribution
CSZ, MZ, and ZKZ conceived and designed the research. JB, KXK, RWZ, SSZ, XQZ, and ZKZ performed the experiments and analyzed the data. MZ and ZKZ accomplished the original draft writing. CSZ, YX, and ZKZ reviewed and edited the paper. All authors read and approved the final version of the manuscript.
Funding
This work is supported by the National Natural Science Foundation of China (CSZ, No. 82071467); the National Natural Science Foundation of China (XQZ, No. 81801053); the Natural Science Foundation of Liaoning Province (ZKZ, No. 20180540150); Innovation Team Support Plan of Universities in Liaoning Province (CSZ, No. LT2019015); Guidance plan for key research and development plans of Liaoning Province (CSZ, No. 2019JH8/10300002); Discipline Cultivation Support Plan-Stroke Center of China Medical University (CSZ); Scientific Research Fund of Education Department of Liaoning Province (CSZ, No. ZF2019012); Revitalizing Talents Plan of Liaoning Province (CSZ).
Data availability
The datasets generated and/or analyzed during this study are available in the GEO repository (https://www.ncbi.nlm.nih.gov/geo/), which are also obtainable from the authors upon reasonable request.
Declarations
Ethical approval and consent to participate
No experiments involving patients and/or animals have been conducted.
Consent for publication
All authors agree to publish the paper.
Conflict of interest
The authors declare no competing interests.
Footnotes
Publisher's Note
Springer Nature remains neutral with regard to jurisdictional claims in published maps and institutional affiliations.
Chuansheng Zhao and Mei Zhao contributed equally to this work.
Contributor Information
Chuansheng Zhao, Email: cszhao@cmu.edu.cn.
Mei Zhao, Email: zhaom1@sj-hospital.org.
References
- 1.Rynearson KD, Ponnusamy M, Prikhodko O, Xie Y, Zhang C, Nguyen P, et al. Preclinical validation of a potent γ-secretase modulator for Alzheimer’s disease prevention. J Exp Med 2021 218 4. 10.1084/jem.20202560. [DOI] [PMC free article] [PubMed]
- 2.Scheltens P, Blennow K, Breteler MMB, de Strooper B, Frisoni GB, Salloway S, et al. Alzheimer’s disease. Lancet. 2016;388(10043):505–517. doi: 10.1016/S0140-6736(15)01124-1. [DOI] [PubMed] [Google Scholar]
- 3.Chan KY, Wang W, Wu JJ, Liu L, Theodoratou E, Car J, et al. Epidemiology of Alzheimer’s disease and other forms of dementia in China, 1990–2010: a systematic review and analysis. Lancet. 2013;381(9882):2016–2023. doi: 10.1016/S0140-6736(13)60221-4. [DOI] [PubMed] [Google Scholar]
- 4.Novikova G, Andrews SJ, Renton AE, Marcora E. Beyond association: successes and challenges in linking non-coding genetic variation to functional consequences that modulate Alzheimer’s disease risk. Mol Neurodegener. 2021;16(1):27. doi: 10.1186/s13024-021-00449-0. [DOI] [PMC free article] [PubMed] [Google Scholar]
- 5.Livingston G, Huntley J, Sommerlad A, Ames D, Ballard C, Banerjee S, et al. Dementia prevention, intervention, and care: 2020 report of the Lancet Commission. Lancet. 2020;396(10248):413–446. doi: 10.1016/S0140-6736(20)30367-6. [DOI] [PMC free article] [PubMed] [Google Scholar]
- 6.Golubnitschaja O, Baban B, Boniolo G, Wang W, Bubnov R, Kapalla M, et al. Medicine in the early twenty-first century: paradigm and anticipation - EPMA position paper 2016. EPMA J. 2016;7:23. doi: 10.1186/s13167-016-0072-4. [DOI] [PMC free article] [PubMed] [Google Scholar]
- 7.Golubnitschaja O, Costigliola V. General report & recommendations in predictive, preventive and personalised medicine 2012: white paper of the European Association for Predictive, Preventive and Personalised Medicine. EPMA J. 2012;3(1):14. doi: 10.1186/1878-5085-3-14. [DOI] [PMC free article] [PubMed] [Google Scholar]
- 8.Golubnitschaja O, Watson ID, Topic E, Sandberg S, Ferrari M, Costigliola V. Position paper of the EPMA and EFLM: a global vision of the consolidated promotion of an integrative medical approach to advance health care. EPMA J. 2013;4(1):12. doi: 10.1186/1878-5085-4-12. [DOI] [PMC free article] [PubMed] [Google Scholar]
- 9.Grossman I, Lutz MW, Crenshaw DG, Saunders AM, Burns DK, Roses AD. Alzheimer’s disease: diagnostics, prognostics and the road to prevention. EPMA J. 2010;1(2):293–303. doi: 10.1007/s13167-010-0024-3. [DOI] [PMC free article] [PubMed] [Google Scholar]
- 10.Gozes I. Tau pathology: predictive diagnostics, targeted preventive and personalized medicine and application of advanced research in medical practice. EPMA J. 2010;1(2):305–316. doi: 10.1007/s13167-010-0029-y. [DOI] [PMC free article] [PubMed] [Google Scholar]
- 11.Gozes I. Specific protein biomarker patterns for Alzheimer’s disease: improved diagnostics in progress. EPMA J. 2017;8(3):255–259. doi: 10.1007/s13167-017-0110-x. [DOI] [PMC free article] [PubMed] [Google Scholar]
- 12.Braak H, Braak E. Neuropathological stageing of Alzheimer-related changes. Acta Neuropathol. 1991;82(4):239–259. doi: 10.1007/BF00308809. [DOI] [PubMed] [Google Scholar]
- 13.LaFerla FM. Calcium dyshomeostasis and intracellular signalling in Alzheimer’s disease. Nat Rev Neurosci. 2002;3(11):862–872. doi: 10.1038/nrn960. [DOI] [PubMed] [Google Scholar]
- 14.Reese LC, Taglialatela G. A role for calcineurin in Alzheimer’s disease. Curr Neuropharmacol. 2011;9(4):685–692. doi: 10.2174/157015911798376316. [DOI] [PMC free article] [PubMed] [Google Scholar]
- 15.Dawson TM, Steiner JP, Lyons WE, Fotuhi M, Blue M, Snyder SH. The immunophilins, FK506 binding protein and cyclophilin, are discretely localized in the brain: relationship to calcineurin. Neuroscience. 1994;62(2):569–580. doi: 10.1016/0306-4522(94)90389-1. [DOI] [PubMed] [Google Scholar]
- 16.Li Y, Sheftic SR, Grigoriu S, Schwieters CD, Page R, Peti W. The structure of the RCAN1:CN complex explains the inhibition of and substrate recruitment by calcineurin. Sci Adv 2020 6 27. 10.1126/sciadv.aba3681. [DOI] [PMC free article] [PubMed]
- 17.Karch CM, Jeng AT, Goate AM. Calcium phosphatase calcineurin influences tau metabolism. Neurobiol Aging. 2013;34(2):374–386. doi: 10.1016/j.neurobiolaging.2012.05.003. [DOI] [PMC free article] [PubMed] [Google Scholar]
- 18.Cruchaga C, Kauwe JSK, Mayo K, Spiegel N, Bertelsen S, Nowotny P, et al. SNPs associated with cerebrospinal fluid phospho-tau levels influence rate of decline in Alzheimer’s disease. PLoS Genet. 2010;6(9):e1001101. doi: 10.1371/journal.pgen.1001101. [DOI] [PMC free article] [PubMed] [Google Scholar]
- 19.Barrett T, Wilhite SE, Ledoux P, Evangelista C, Kim IF, Tomashevsky M, et al. NCBI GEO: archive for functional genomics data sets--update. Nucleic Acids Res. 2013;41(Database issue):D991-D5. 10.1093/nar/gks1193. [DOI] [PMC free article] [PubMed]
- 20.Zhou Z, Bai J, Zhong S, Zhang R, Kang K, Zhang X, et al. Integrative functional genomic analysis of molecular signatures and mechanistic pathways in the cell cycle underlying Alzheimer’s disease. Oxid Med Cell Longev. 2021;2021:5552623. doi: 10.1155/2021/5552623. [DOI] [PMC free article] [PubMed] [Google Scholar]
- 21.Wang Y, LêCao K-A. Managing batch effects in microbiome data. Brief Bioinform. 2020;21(6):1954–1970. doi: 10.1093/bib/bbz105. [DOI] [PubMed] [Google Scholar]
- 22.Mootha VK, Lindgren CM, Eriksson K-F, Subramanian A, Sihag S, Lehar J, et al. PGC-1alpha-responsive genes involved in oxidative phosphorylation are coordinately downregulated in human diabetes. Nat Genet. 2003;34(3):267–273. doi: 10.1038/ng1180. [DOI] [PubMed] [Google Scholar]
- 23.Subramanian A, Tamayo P, Mootha VK, Mukherjee S, Ebert BL, Gillette MA, et al. Gene set enrichment analysis: a knowledge-based approach for interpreting genome-wide expression profiles. Proc Natl Acad Sci USA. 2005;102(43):15545–15550. doi: 10.1073/pnas.0506580102. [DOI] [PMC free article] [PubMed] [Google Scholar]
- 24.Reiner A, Yekutieli D, Benjamini Y. Identifying differentially expressed genes using false discovery rate controlling procedures. Bioinformatics. 2003;19(3):368–375. doi: 10.1093/bioinformatics/btf877. [DOI] [PubMed] [Google Scholar]
- 25.Law CW, Chen Y, Shi W, Smyth GK. voom: Precision weights unlock linear model analysis tools for RNA-seq read counts. Genome Biol. 2014;15(2):R29. doi: 10.1186/gb-2014-15-2-r29. [DOI] [PMC free article] [PubMed] [Google Scholar]
- 26.Ritchie ME, Phipson B, Wu D, Hu Y, Law CW, Shi W, et al. limma powers differential expression analyses for RNA-sequencing and microarray studies. Nucleic Acids Res. 2015;43(7):e47. doi: 10.1093/nar/gkv007. [DOI] [PMC free article] [PubMed] [Google Scholar]
- 27.Soria FN, Pérez-Samartín A, Martin A, Gona KB, Llop J, Szczupak B, et al. Extrasynaptic glutamate release through cystine/glutamate antiporter contributes to ischemic damage. J Clin Invest. 2014;124(8):3645–3655. doi: 10.1172/JCI71886. [DOI] [PMC free article] [PubMed] [Google Scholar]
- 28.Zhang B, Horvath S. A general framework for weighted gene co-expression network analysis. Stat Appl Genet Mol Biol 2005 4 17. [DOI] [PubMed]
- 29.Langfelder P, Horvath S. WGCNA: an R package for weighted correlation network analysis. BMC Bioinformatics. 2008;9:559. doi: 10.1186/1471-2105-9-559. [DOI] [PMC free article] [PubMed] [Google Scholar]
- 30.Yang Q, Wang R, Wei B, Peng C, Wang L, Hu G, et al. Candidate biomarkers and molecular mechanism investigation for glioblastoma multiforme utilizing WGCNA. Biomed Res Int. 2018;2018:4246703. doi: 10.1155/2018/4246703. [DOI] [PMC free article] [PubMed] [Google Scholar]
- 31.Fredlund E, Staaf J, Rantala JK, Kallioniemi O, Borg A, Ringnér M. The gene expression landscape of breast cancer is shaped by tumor protein p53 status and epithelial-mesenchymal transition. Breast Cancer Res. 2012;14(4):R113. doi: 10.1186/bcr3236. [DOI] [PMC free article] [PubMed] [Google Scholar]
- 32.Szklarczyk D, Morris JH, Cook H, Kuhn M, Wyder S, Simonovic M, et al. The STRING database in 2017: quality-controlled protein-protein association networks, made broadly accessible. Nucleic Acids Res. 2017;45(D1):D362–D368. doi: 10.1093/nar/gkw937. [DOI] [PMC free article] [PubMed] [Google Scholar]
- 33.Otasek D, Morris JH, Bouças J, Pico AR, Demchak B. Cytoscape automation: empowering workflow-based network analysis. Genome Biol. 2019;20(1):185. doi: 10.1186/s13059-019-1758-4. [DOI] [PMC free article] [PubMed] [Google Scholar]
- 34.Shannon P, Markiel A, Ozier O, Baliga NS, Wang JT, Ramage D, et al. Cytoscape: a software environment for integrated models of biomolecular interaction networks. Genome Res. 2003;13(11):2498–2504. doi: 10.1101/gr.1239303. [DOI] [PMC free article] [PubMed] [Google Scholar]
- 35.Robin X, Turck N, Hainard A, Tiberti N, Lisacek F, Sanchez J-C, et al. pROC: an open-source package for R and S+ to analyze and compare ROC curves. BMC Bioinformatics. 2011;12:77. doi: 10.1186/1471-2105-12-77. [DOI] [PMC free article] [PubMed] [Google Scholar]
- 36.Sonego P, Kocsor A, Pongor S. ROC analysis: applications to the classification of biological sequences and 3D structures. Brief Bioinform. 2008;9(3):198–209. doi: 10.1093/bib/bbm064. [DOI] [PubMed] [Google Scholar]
- 37.O'Day DH. Calmodulin binding proteins and Alzheimer’s disease: biomarkers, regulatory enzymes and receptors that are regulated by calmodulin. Int J Mol Sci. 2020;21(19):7344. doi: 10.3390/ijms21197344. [DOI] [PMC free article] [PubMed] [Google Scholar]
- 38.Luo L, O'Leary DDM. Axon retraction and degeneration in development and disease. Annu Rev Neurosci. 2005;28:127–156. doi: 10.1146/annurev.neuro.28.061604.135632. [DOI] [PubMed] [Google Scholar]
- 39.Raff MC, Whitmore AV, Finn JT. Axonal self-destruction and neurodegeneration. Science. 2002;296(5569):868–871. doi: 10.1126/science.1068613. [DOI] [PubMed] [Google Scholar]
- 40.Sagot Y, Tan SA, Hammang JP, Aebischer P, Kato AC. GDNF slows loss of motoneurons but not axonal degeneration or premature death of pmn/pmn mice. J Neurosci. 1996;16(7):2335–2341. doi: 10.1523/JNEUROSCI.16-07-02335.1996. [DOI] [PMC free article] [PubMed] [Google Scholar]
- 41.Saxena S, Caroni P. Mechanisms of axon degeneration: from development to disease. Prog Neurobiol. 2007;83(3):174–191. doi: 10.1016/j.pneurobio.2007.07.007. [DOI] [PubMed] [Google Scholar]
- 42.Lourenço FC, Galvan V, Fombonne J, Corset V, Llambi F, Müller U, et al. Netrin-1 interacts with amyloid precursor protein and regulates amyloid-beta production. Cell Death Differ. 2009;16(5):655–663. doi: 10.1038/cdd.2008.191. [DOI] [PMC free article] [PubMed] [Google Scholar]
- 43.Bai G, Chivatakarn O, Bonanomi D, Lettieri K, Franco L, Xia C, et al. Presenilin-dependent receptor processing is required for axon guidance. Cell. 2011;144(1):106–118. doi: 10.1016/j.cell.2010.11.053. [DOI] [PMC free article] [PubMed] [Google Scholar]
- 44.Hong K, Nishiyama M, Henley J, Tessier-Lavigne M, Poo M. Calcium signalling in the guidance of nerve growth by netrin-1. Nature. 2000;403(6765):93–98. doi: 10.1038/47507. [DOI] [PubMed] [Google Scholar]
- 45.Wen Z, Guirland C, Ming G-L, Zheng JQ. A CaMKII/calcineurin switch controls the direction of Ca(2+)-dependent growth cone guidance. Neuron. 2004;43(6):835–846. doi: 10.1016/j.neuron.2004.08.037. [DOI] [PubMed] [Google Scholar]
- 46.Benarroch EE. Glutamatergic synaptic plasticity and dysfunction in Alzheimer disease: emerging mechanisms. Neurology. 2018;91(3):125–132. doi: 10.1212/WNL.0000000000005807. [DOI] [PubMed] [Google Scholar]
- 47.Cheng Y-J, Lin C-H, Lane H-Y. Involvement of cholinergic, adrenergic, and glutamatergic network modulation with cognitive dysfunction in Alzheimer’s disease. Int J Mol Sci 2021 22 5. 10.3390/ijms22052283. [DOI] [PMC free article] [PubMed]
- 48.Rudy CC, Hunsberger HC, Weitzner DS, Reed MN. The role of the tripartite glutamatergic synapse in the pathophysiology of Alzheimer’s disease. Aging Dis. 2015;6(2):131–148. doi: 10.14336/AD.2014.0423. [DOI] [PMC free article] [PubMed] [Google Scholar]
- 49.Zádori D, Veres G, Szalárdy L, Klivényi P, Toldi J, Vécsei L. Glutamatergic dysfunctioning in Alzheimer’s disease and related therapeutic targets. J Alzheimers Dis. 2014;42(Suppl 3):S177–S187. doi: 10.3233/JAD-132621. [DOI] [PubMed] [Google Scholar]
- 50.Hsieh H, Boehm J, Sato C, Iwatsubo T, Tomita T, Sisodia S, et al. AMPAR removal underlies Abeta-induced synaptic depression and dendritic spine loss. Neuron. 2006;52(5):831–843. doi: 10.1016/j.neuron.2006.10.035. [DOI] [PMC free article] [PubMed] [Google Scholar]
- 51.Roselli F, Tirard M, Lu J, Hutzler P, Lamberti P, Livrea P, et al. Soluble beta-amyloid1-40 induces NMDA-dependent degradation of postsynaptic density-95 at glutamatergic synapses. J Neurosci. 2005;25(48):11061–11070. doi: 10.1523/JNEUROSCI.3034-05.2005. [DOI] [PMC free article] [PubMed] [Google Scholar]
- 52.Shankar GM, Bloodgood BL, Townsend M, Walsh DM, Selkoe DJ, Sabatini BL. Natural oligomers of the Alzheimer amyloid-beta protein induce reversible synapse loss by modulating an NMDA-type glutamate receptor-dependent signaling pathway. J Neurosci. 2007;27(11):2866–2875. doi: 10.1523/JNEUROSCI.4970-06.2007. [DOI] [PMC free article] [PubMed] [Google Scholar]
- 53.Snyder EM, Nong Y, Almeida CG, Paul S, Moran T, Choi EY, et al. Regulation of NMDA receptor trafficking by amyloid-beta. Nat Neurosci. 2005;8(8):1051–1058. doi: 10.1038/nn1503. [DOI] [PubMed] [Google Scholar]
- 54.Mookherjee P, Green PS, Watson GS, Marques MA, Tanaka K, Meeker KD, et al. GLT-1 loss accelerates cognitive deficit onset in an Alzheimer’s disease animal model. J Alzheimers Dis. 2011;26(3):447–455. doi: 10.3233/JAD-2011-110503. [DOI] [PMC free article] [PubMed] [Google Scholar]
- 55.Cowburn R, Hardy J, Roberts P, Briggs R. Presynaptic and postsynaptic glutamatergic function in Alzheimer’s disease. Neurosci Lett. 1988;86(1):109–113. doi: 10.1016/0304-3940(88)90192-9. [DOI] [PubMed] [Google Scholar]
- 56.Procter AW, Palmer AM, Francis PT, Lowe SL, Neary D, Murphy E, et al. Evidence of glutamatergic denervation and possible abnormal metabolism in Alzheimer’s disease. J Neurochem. 1988;50(3):790–802. doi: 10.1111/j.1471-4159.1988.tb02983.x. [DOI] [PubMed] [Google Scholar]
- 57.Guillot F, Kemppainen S, Lavasseur G, Miettinen PO, Laroche S, Tanila H, et al. Brain-specific basal and novelty-induced alternations in PI3K-Akt and MAPK/ERK signaling in a middle-aged AβPP/PS1 mouse model of Alzheimer’s disease. J Alzheimers Dis. 2016;51(4):1157–1173. doi: 10.3233/JAD-150926. [DOI] [PubMed] [Google Scholar]
- 58.Matos M, Augusto E, Oliveira CR, Agostinho P. Amyloid-beta peptide decreases glutamate uptake in cultured astrocytes: involvement of oxidative stress and mitogen-activated protein kinase cascades. Neuroscience. 2008;156(4):898–910. doi: 10.1016/j.neuroscience.2008.08.022. [DOI] [PubMed] [Google Scholar]
- 59.Alberdi E, Sánchez-Gómez MV, Cavaliere F, Pérez-Samartín A, Zugaza JL, Trullas R, et al. Amyloid beta oligomers induce Ca2+ dysregulation and neuronal death through activation of ionotropic glutamate receptors. Cell Calcium. 2010;47(3):264–272. doi: 10.1016/j.ceca.2009.12.010. [DOI] [PubMed] [Google Scholar]
- 60.Li S, Jin M, Koeglsperger T, Shepardson NE, Shankar GM, Selkoe DJ. Soluble Aβ oligomers inhibit long-term potentiation through a mechanism involving excessive activation of extrasynaptic NR2B-containing NMDA receptors. J Neurosci. 2011;31(18):6627–6638. doi: 10.1523/JNEUROSCI.0203-11.2011. [DOI] [PMC free article] [PubMed] [Google Scholar]
- 61.Talantova M, Sanz-Blasco S, Zhang X, Xia P, Akhtar MW, Okamoto S-i, et al. Aβ induces astrocytic glutamate release, extrasynaptic NMDA receptor activation, and synaptic loss. Proc Natl Acad Sci U S A 2013 110 27 E2518 E27. 10.1073/pnas.1306832110. [DOI] [PMC free article] [PubMed]
- 62.Molkentin JD. Calcineurin-NFAT signaling regulates the cardiac hypertrophic response in coordination with the MAPKs. Cardiovasc Res. 2004;63(3):467–475. doi: 10.1016/j.cardiores.2004.01.021. [DOI] [PubMed] [Google Scholar]
- 63.Evans MD, Dumitrescu AS, Kruijssen DLH, Taylor SE, Grubb MS. Rapid modulation of axon initial segment length influences repetitive spike firing. Cell Rep. 2015;13(6):1233–1245. doi: 10.1016/j.celrep.2015.09.066. [DOI] [PMC free article] [PubMed] [Google Scholar]
- 64.Feld M, Krawczyk MC, Sol Fustiñana M, Blake MG, Baratti CM, Romano A, et al. Decrease of ERK/MAPK overactivation in prefrontal cortex reverses early memory deficit in a mouse model of Alzheimer’s disease. J Alzheimers Dis. 2014;40(1):69–82. doi: 10.3233/JAD-131076. [DOI] [PubMed] [Google Scholar]
- 65.Goodell DJ, Zaegel V, Coultrap SJ, Hell JW, Bayer KU. DAPK1 mediates LTD by making CaMKII/GluN2B binding LTP specific. Cell Rep. 2017;19(11):2231–2243. doi: 10.1016/j.celrep.2017.05.068. [DOI] [PMC free article] [PubMed] [Google Scholar]
- 66.Person AL, Raman IM. Deactivation of L-type Ca current by inhibition controls LTP at excitatory synapses in the cerebellar nuclei. Neuron. 2010;66(4):550–559. doi: 10.1016/j.neuron.2010.04.024. [DOI] [PMC free article] [PubMed] [Google Scholar]
- 67.Sun B, Halabisky B, Zhou Y, Palop JJ, Yu G, Mucke L, et al. Imbalance between GABAergic and glutamatergic transmission impairs adult neurogenesis in an animal model of Alzheimer’s disease. Cell Stem Cell. 2009;5(6):624–633. doi: 10.1016/j.stem.2009.10.003. [DOI] [PMC free article] [PubMed] [Google Scholar]
- 68.Peterson D, Munger C, Crowley J, Corcoran C, Cruchaga C, Goate AM, et al. Variants in PPP3R1 and MAPT are associated with more rapid functional decline in Alzheimer’s disease: the Cache County Dementia Progression Study. Alzheimers Dement. 2014;10(3):366–371. doi: 10.1016/j.jalz.2013.02.010. [DOI] [PMC free article] [PubMed] [Google Scholar]
- 69.Wang L-Y, Pei J, Zhan Y-J, Cai Y-W. Overview of meta-analyses of five non-pharmacological interventions for Alzheimer’s disease. Frontiers in aging neuroscience. 2020;12:594432. doi: 10.3389/fnagi.2020.594432. [DOI] [PMC free article] [PubMed] [Google Scholar]
- 70.Canu E, Sarasso E, Filippi M, Agosta F. Effects of pharmacological and nonpharmacological treatments on brain functional magnetic resonance imaging in Alzheimer’s disease and mild cognitive impairment: a critical review. Alzheimers Res Ther. 2018;10(1):21. doi: 10.1186/s13195-018-0347-1. [DOI] [PMC free article] [PubMed] [Google Scholar]
- 71.Marwick K, Skehel P, Hardingham G, Wyllie D. Effect of a GRIN2A de novo mutation associated with epilepsy and intellectual disability on NMDA receptor currents and Mg(2+) block in cultured primary cortical neurons. Lancet. 2015;385(Suppl 1):S65. doi: 10.1016/S0140-6736(15)60380-4. [DOI] [PubMed] [Google Scholar]
- 72.Ong W-Y, Tanaka K, Dawe GS, Ittner LM, Farooqui AA. Slow excitotoxicity in Alzheimer’s disease. J Alzheimers Dis. 2013;35(4):643–668. doi: 10.3233/JAD-121990. [DOI] [PubMed] [Google Scholar]
- 73.Hardingham GE. Targeting synaptic NMDA receptor co-agonism as a therapy for Alzheimer’s disease? Cell Metab. 2020;31(3):439–440. doi: 10.1016/j.cmet.2020.02.009. [DOI] [PubMed] [Google Scholar]
- 74.Lipton SA. Paradigm shift in neuroprotection by NMDA receptor blockade: memantine and beyond. Nat Rev Drug Discov. 2006;5(2):160–170. doi: 10.1038/nrd1958. [DOI] [PubMed] [Google Scholar]
- 75.Koopmans F, van Nierop P, Andres-Alonso M, Byrnes A, Cijsouw T, Coba MP, et al. SynGO: an evidence-based, expert-curated knowledge base for the synapse. Neuron. 2019 103 2. 10.1016/j.neuron.2019.05.002. [DOI] [PMC free article] [PubMed]
- 76.Sierksma A, Escott-Price V, De Strooper B. Translating genetic risk of Alzheimer’s disease into mechanistic insight and drug targets. Science. 2020;370(6512):61–66. doi: 10.1126/science.abb8575. [DOI] [PubMed] [Google Scholar]
- 77.Wang H, Tian Q, Zhang J, Liu H, Zhang J, Cao W, et al. Blood transcriptome profiling as potential biomarkers of suboptimal health status: potential utility of novel biomarkers for predictive, preventive, and personalized medicine strategy. EPMA J. 2021;12(2):103–115. doi: 10.1007/s13167-021-00238-1. [DOI] [PMC free article] [PubMed] [Google Scholar]
- 78.Li N, Zhan X. Identification of clinical trait-related lncRNA and mRNA biomarkers with weighted gene co-expression network analysis as useful tool for personalized medicine in ovarian cancer. EPMA J. 2019;10(3):273–290. doi: 10.1007/s13167-019-00175-0. [DOI] [PMC free article] [PubMed] [Google Scholar]
Associated Data
This section collects any data citations, data availability statements, or supplementary materials included in this article.
Supplementary Materials
Clinical phenotypic data of samples. AD: Alzheimer’s disease Supplementary file1 (XLSX 21 KB)
Differentially expression of genes overlapped between AD/Control and PPP3R1-low/high groups. AD: Alzheimer’s disease Supplementary file2 (XLSX 184 KB)
MM and GS for each differentially expressed gene in different co-expression modules. MM, Module membership; GS, Gene significance Supplementary file3 (XLSX 431 KB)
Data Availability Statement
The datasets generated and/or analyzed during this study are available in the GEO repository (https://www.ncbi.nlm.nih.gov/geo/), which are also obtainable from the authors upon reasonable request.