

Abstract
Background
Elderly patients have a higher burden of comorbidities that influence clinical outcomes. We aimed to compare in‐hospital outcomes in patients ≥80 years old to younger patients, and to determine the factors associated with increased risk of major adverse events (MAE) after left atrial appendage closure.
Methods and Results
The National Inpatient Sample was used to identify discharges after left atrial appendage closure between October 2015 and December 2018. The primary outcome was in‐hospital MAE defined as the composite of postprocedural bleeding, vascular and cardiac complications, acute kidney injury, stroke, and death. A total of 6779 hospitalizations were identified, of which, 2371 (35%) were ≥80 years old and 4408 (65%) were <80 years old. Patients ≥80 years old experienced a higher rate of MAE compared with those aged <80 years old (6.0% versus 4.6%, P=0.01), and this difference was driven by a numerically higher rate of cardiac complications (2.4% versus 1.8%, P=0.09) and death (0.3% versus 0.1%, P=0.05) among individuals ≥80 years old. In patients ≥80 years old, higher odds of in‐hospital MAE were observed in women (1.61‐fold), and those with preprocedural congestive heart failure (≈2‐fold), diabetes (≈1.5‐fold), renal disease (≈2.6‐fold), anemia (≈2.7‐fold), and dementia (≈5‐fold). In patients <80 years old, a higher risk of in‐hospital MAE was encountered among women (≈1.4‐fold) and those with diabetes (≈1.3‐fold), renal disease (≈2.6‐fold), anemia (≈2‐fold), and dyslipidemia (≈1.2‐fold).
Conclusions
Patients ≥80 years old had higher rates of in‐hospital MAE compared with patients aged <80 years old. Female sex and the presence of heart failure, diabetes, renal disease, and anemia were factors associated with in‐hospital MAE among both groups.
Keywords: anticoagulation, atrial fibrillation, comorbidities, elderly, left atrial appendage closure, octogenarians, stroke
Subject Categories: Atrial Fibrillation, Aging, Epidemiology, Health Services, Anticoagulants
Nonstandard Abbreviations and Acronyms
- CHA2DS2‐VASc
Congestive heart failure, Hypertension, Age ≥75 years, Diabetes mellitus, prior stroke or transient ischemic attack, age 65 to 74 years, vascular disease (including previous myocardial infarction), and female sex
- LAAC
left atrial appendage closure
Clinical Perspective
What Is New?
This study represents a comprehensive appraisal on age‐related differences and in‐hospital outcomes following left atrial appendage closure.
Patients ≥80 years old had higher rates of in‐hospital complications compared with patients <80 years old.
Burden of comorbidities was associated with in‐hospital adverse events following left atrial appendage closure in patients ≥80 years old and those aged <80 years old.
What Are the Clinical Implications?
These findings have significant implications for the understanding of how age‐related outcomes may differ in patients undergoing left atrial appendage closure.
The prevalence of atrial fibrillation increases with age, 1 as does the risk of cerebrovascular accidents. 2 , 3 , 4 , 5 Moreover, its has been shown that individuals aged 80 years or older have >20% of atrial fibrillation–related strokes 5 and these are often more severe in terms of disability and mortality. 5 , 6 , 7 While oral anticoagulation therapy is the mainstay for thromboembolic cerebrovascular accidents prevention, 6 , 8 elderly patients are at increased risk of bleeding events 3 , 9 ; hence, these drugs are often underused, mainly because of advanced age or the perceived high‐risk of bleeding complications, falls, or even polypharmacy. 3 , 6 , 7 , 10
Studies have demonstrated the safety and efficacy of left atrial appendage closure (LAAC) to reduce the risk of stroke in patients with atrial fibrillation, 11 , 12 , 13 and current guidelines recommend LAAC for individuals in whom long‐term oral anticoagulation is considered either suboptimal or contraindicated. 6 , 8 Patients referred for LAAC often present with overlapping risks of systemic thromboembolism and bleeding events. In addition, elderly patients are generally frailer and have higher comorbidity burden, both of which often co‐exist and influence clinical outcomes. 14 , 15 Therefore, we aimed to compare in‐hospital outcomes in patients ≥80 years old to younger patients, and to determine the factors associated with increased risk of adverse events after LAAC.
METHODS
Data Source
We conducted a cohort‐based observational study using the National Inpatient Sample (NIS) database, a nationally representative and all‐payer publicly available database of hospitalized patients in the United States. The NIS database was developed by the Agency for Healthcare Research and Quality as a part of the Healthcare Cost and Utilization Project, which includes hospital information for >7 million hospital discharges annually and ≈20% stratified weighted sample of all discharges from United States community hospitals. 16 The authors declare that all supporting data are available within the article and its online supplementary files. Institutional review board and ethics committee approval was obtained from The Western University Health Science Research Ethics Board, and patient consent was not required because of the nature of this study.
Study Population
Between October 2015 and December 2018, hospitalizations for LACC, as a primary procedure, were identified using the International Classification of Diseases, Tenth Revision, Clinical Modification (ICD‐10‐CM) procedure code 02L73DK (occlusion of left atrial appendage with intraluminal device, percutaneous approach). For this study, individuals were divided into 2 groups, those ≥80 years old and those <80 years old, and ICD‐10‐CM codes were used to identify patient's baseline characteristics through the Charlson comorbidity index 17 (CCI, Table S1), and the Elixhauser comorbidity score 18 (ECS, Table S2). The CHA2DS2‐VASc score was used to estimate the thromboembolic risk.
Outcome Measures
The primary outcome of interest was the occurrence of in‐hospital major adverse events (MAE). In‐hospital MAE were identified using ICD‐10‐CM codes and detailed in Table S3, and this included a composite of postprocedural bleeding, cardiac and vascular complications, acute kidney injury, stroke, or transient ischemic attack and death.
Statistical Analysis
Categorical variables are expressed as counts and percentages and continuous variables are presented as mean±SD or median (interquartile range [IQR]) according to variable distribution. Because of Healthcare Cost and Utilization Project data use agreement, variables in tables with <10 discharge records are displayed as “<10”. Differences between patients ≥80 and <80 years old were evaluated using 2‐sided Student t test or Wilcoxon rank‐sum test for continuous variables and the χ2 test for categorical variables, accordingly, adjusting for a survey sampling design. P values for each variable were computed adjusting for sampling discharge‐level weights, cluster, and strata provided by NIS and as recommended by Agency for Healthcare Research and Quality during survey‐specific analysis.
The Cochran‐Armitage trend test was used for detecting linear trends for complications over the time. Length of stay was calculated by subtracting the admission date from the discharge date. Hospital volumes were determined based on the annual number of LAAC performed by each hospital in a given year.
Factors associated with the primary outcome for patients ≥80 and <80 years old were assessed separately. We first conducted the univariate analysis for each outcome with a single variable; then, the variables associated with outcome variable from univariate analysis with a P value of <0.10 were included in multivariable models along with comorbidities. In addition, clinically relevant variables, chosen a priori, such as age, sex, and race were also included in multivariable models.
To account for the 2‐level hierarchical structure of the NIS database (patients are nested within hospitals), multilevel modeling was applied, allowing the intercepts to vary across hospitals for in‐hospital MAE with adjustment of the sampling weight. To assess the effect of age ≥80 years old in the whole cohort, the multilevel logistic regression model was fitted first adjusting for, in addition to sex, race and relevant comorbidities, then separately for patients ≥80 and <80 years old.
Area under the receiver operating characteristic curve analysis was conducted for each model to assess its discrimination ability for in‐hospital MAE. The goodness‐of‐fit of the model was assessed using Akaike information criterion and comparatively, a lower Akaike information criterion indicates that a model fits the data better. The model's calibration was evaluated by the Brier score that was calculated from mean squared error of prediction for each model. Differences were considered statistically significant at P values of <0.05. Statistical analyses were performed using R version 3.6.1 (R Foundation for Statistical Computing, Vienna, Austria).
RESULTS
Study Population
A total of 6779 hospitalizations were identified in the NIS dataset as having undergone LAAC as a primary procedure between October 1, 2015 and December 31, 2018. Of these, 2371 (35%) were ≥80 years old (mean age 84.1±3.0 years old) and 4408 (65%) were <80 years old (mean age 71.6±6.3 years old). Interestingly, while the CCI was lower in patients ≥80 years old compared with <80 years old (1.9±1.7 versus 2.1±1.7, P<0.001), the ECS was higher in those ≥80 years old compared with <80 years old (9.9±5.7 versus 9.6±5.9, P=0.03). The group‐based distribution of CCI and ECS are presented in Figures 1 and 2, respectively. Patients ≥80 years old showed a higher CHA2DS2‐VASc score (4.7±1.4 versus 4.0±1.5, P<0.001) and 100% of them presented with a high thromboembolic risk (CHA2DS2‐VASc score ≥2, Figure 3) while 97% in the <80 years old cohort did (Table 1). Remaining baseline characteristics are presented in Table 1.
Figure 1. Proportion of components in Charlson Comorbidity Index.
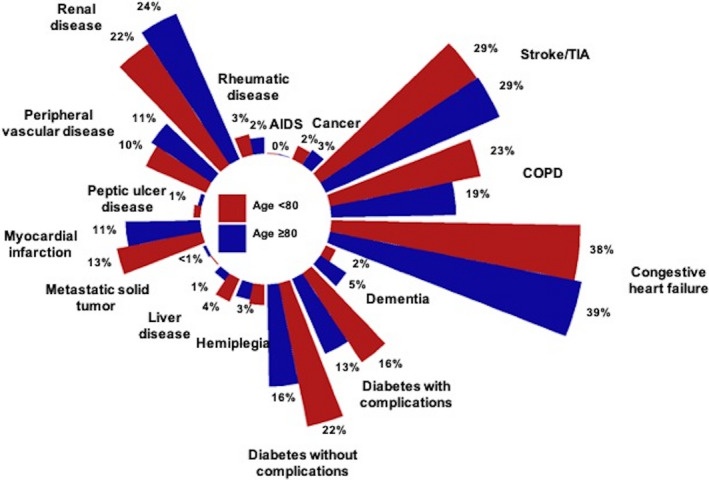
Because of the very low proportions, mild liver disease and moderate–severe liver disease were pooled, leading to 16 variables instead of 17. COPD indicates chronic obstructive pulmonary disease; and TIA, transient ischemic attack.
Figure 2. Proportion of components in Elixhauser Comorbidity Score.
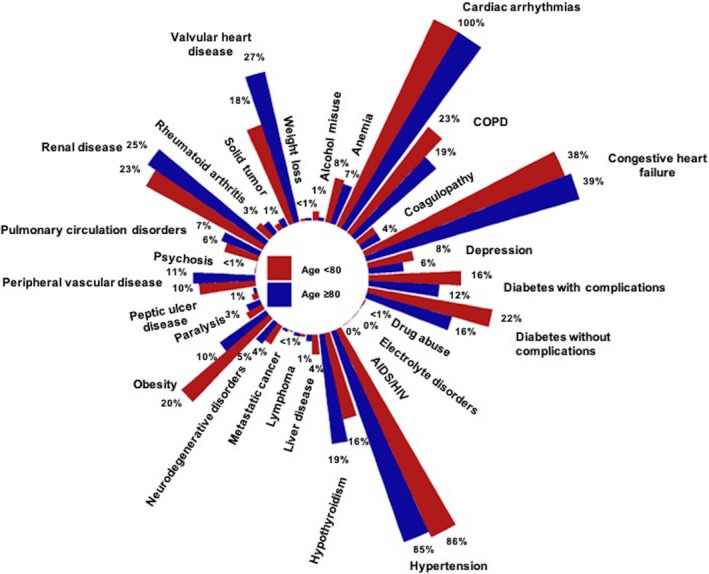
Because of the very low proportions, deficiency anemia and blood loss anemia were pooled, leading to 29 variables instead of 30.
Figure 3. Proportion of components in CHA2DS2‐VASc score.
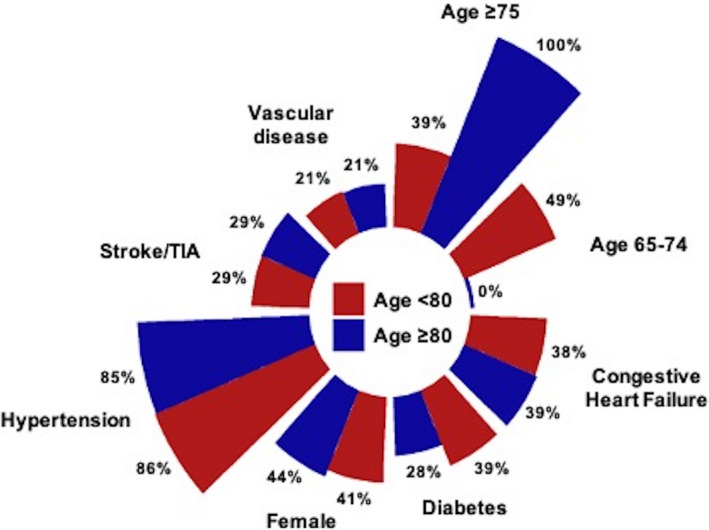
CHA2DS2‐VASc indicates Congestive heart failure, Hypertension, Age ≥75 years, Diabetes, prior Stroke or transient ischemic attack, Vascular disease (including previous myocardial infarction), Age 65 to 74 years, Sex category; and TIA, transient ischemic attack.
Table 1.
Baseline Characteristics and In‐Hospital Outcomes of the Study Population
| Patient characteristics | All (n=6779) | ≥80 y (n=2371) | <80 y (n=4408) | Adjusted P value* |
|---|---|---|---|---|
| Mean age, y | 76.0±8.0 | 84.1±3.0 | 71.6±6.3 | <0.001 |
| Women | 2830 (42) | 1041 (43.9) | 1789 (40.6) | 0.01 |
| Race ‡ | ||||
| White | 5663 (86) | 2037 (89) | 3626 (85) | <0.001 |
| Non‐White † | 908 (14) | 264 (11) | 644 (15) | |
| Type of admission § | ||||
| Elective | 6175 (91) | 205 (91) | 379 (91) | 0.95 |
| Nonelective | 584 (9) | 2159 (9) | 4016 (9) | |
| Median household income ‖ | ||||
| 0–25th percentile | 1353 (20) | 423 (18) | 930 (21) | 0.01 |
| 26–50th percentile | 1740 (26) | 605 (26) | 1135 (26) | |
| 51–75th percentile | 1864 (28) | 672 (29) | 1192 (27) | |
| 76–100th percentile | 1725 (26) | 638 (27) | 1087 (25) | |
| Patient location ¶ | ||||
| Urban | 5688 (84) | 2044 (86) | 3644 (83) | <0.001 |
| Rural | 1082 (16) | 324 (14) | 758 (17) | |
| Hospital teaching status and location | ||||
| Rural | 124 (1.8) | 43 (1.8) | 81 (1.8) | |
| Urban nonteaching | 630 (9.3) | 228 (9.6) | 402 (9.1) | 0.80 |
| Urban teaching | 6025 (89) | 2100 (89) | 3925 (89) | |
| Hospital bed‐size | ||||
| Small | 727 (11) | 288 (12) | 439 (10) | |
| Medium | 1423 (21) | 499 (21) | 924 (21) | 0.02 |
| Large | 4629 (68) | 1584 (67) | 3045 (69) | |
| Primary payer | ||||
| Medicare | 6011 (89) | 2246 (95) | 3765 (86) | <0.001 |
| Medicaid | 81 (1.2) | <10 (0.3) | 73 (1.7) | |
| Private insurance | 547 (8.1) | 78 (3.3) | 469 (11) | |
| Other | 126 (1.9) | 34 (1.4) | 92 (2.1) | |
| Comorbidities | ||||
| Smoking | 2358 (35) | 787 (33) | 1571 (36) | 0.04 |
| Dyslipidemia | 4058 (60) | 1414 (60) | 2644 (60) | 0.78 |
| Hypertension | 5822 (86) | 2025 (85) | 3797 (86) | 0.41 |
| Diabetes | 2357 (35) | 660 (28) | 1697 (38) | <0.001 |
| Previous myocardial infarction | 852 (13) | 270 (11) | 582 (13) | 0.03 |
| Previous CABG | 1012 (15) | 400 (17) | 612 (14) | 0.001 |
| Congestive heart failure | 2604 (38) | 917 (39) | 1677 (38) | 0.39 |
| Valvular disease | 1441 (21) | 638 (27) | 803 (18) | <0.001 |
| Previous cerebrovascular disease | 1951 (29) | 685 (29) | 1266 (29) | 0.88 |
| Peripheral vascular disease | 703 (10) | 260 (11) | 443 (10) | 0.24 |
| Renal disease | 1553 (23) | 574 (24) | 979 (22) | 0.06 |
| Chronic pulmonary disease | 1481 (22) | 451 (19) | 1030 (23) | <0.001 |
| Obesity | 1129 (17) | 235 (9.9) | 894 (20) | <0.001 |
| Dementia | 187 (2.8) | 113 (4.8) | 74 (1.7) | <0.001 |
| Rheumatic disease | 199 (2.9) | 60 (2.5) | 139 (3.2) | 0.15 |
| Liver disease | 87 (2.6) | 14 (1.3) | 73 (3.3) | 0.001 |
| Hypothyroidism | 1138 (16) | 458 (19) | 680 (15) | <0.001 |
| Depression | 510 (7.5) | 147 (6.2) | 363 (8.2) | 0.002 |
| Cancer | 160 (2.4) | 65 (2.7) | 95 (2.2) | 0.13 |
| Anemia | 1130 (17) | 406 (17) | 724 (16) | 0.46 |
| Charlson Comorbidity Index | 2.1±1.7 | 1.9±1.7 | 2.1±1.7 | <0.001 |
| 0 | 1183 (18) | 458 (19) | 725 (16) | 0.001 |
| 1 | 1857 (27) | 672 (28) | 1185 (27) | |
| 2 | 1477 (22) | 509 (22) | 968 (22) | |
| ≥3 | 2262 (33) | 732 (31) | 1530 (35) | |
| Elixhauser Comorbidity Score | 9.8±5.9 | 9.9±5.7 | 9.6±5.9 | 0.03 |
| ≤0 | 84 (1.2) | 21 (0.9) | 63 (1.4) | 0.05 |
| 1–5 | 2401 (36) | 814 (4) | 1587 (36) | |
| 6–10 | 1418 (21) | 489 (21) | 929 (21) | |
| ≥11 | 2876 (42) | 1047 (44) | 1829 (42) | |
| CHADS2 score | 2.8±1.3 | 3.1±1.2 | 2.6±1.3 | <0.001 |
| ≥2 | 5726 (84) | 2212 (93) | 3514 (80) | <0.001 |
| CHA2DS2‐VASc score | 4.3±1.5 | 4.7±1.4 | 4.0±1.5 | <0.001 |
| ≥2 | 6629 (98) | 2371 (100) | 4258 (97) | <0.001 |
| Year of procedure | ||||
| 2015 (October–December) | 114 (1.7) | 30 (1.3) | 84 (2.0) | 0.01 |
| 2016 (January–December) | 1017 (15) | 340 (14) | 677 (15) | |
| 2017 (January–December) | 2163 (32) | 719 (30) | 1444 (33) | |
| 2018 (January–December) | 3485 (51) | 1282 (54) | 2203 (50) | |
| In‐hospital MAE | 345 (5.1) | 142 (6.0) | 203 (4.6) | 0.01 |
| Bleeding complications | 38 (0.6) | 15 (0.6) | 23 (0.5) | 0.55 |
| Cardiac complications | 139 (2.1) | 58 (2.4) | 81 (1.8) | 0.09 |
| Vascular complications | 30 (0.4) | 14 (0.6) | 16 (0.4) | 0.18 |
| Stroke | 24 (0.4) | 12 (0.5) | 12 (0.3) | 0.12 |
| Acute kidney injury | 161 (2.4) | 60 (2.5) | 101 (2.3) | 0.53 |
| Death | <10 (0.1) | <10 (0.3) | <10 (0.1) | 0.05 |
| Length of stay, d | 1 (1–1) | 1 (1–1) | 1 (1–1) | 0.23 |
| Length of stay (d, range) | 0–35 | 0–35 | 0–33 | … |
| ≤1 d | 5811 (86) | 2010 (85) | 3801 (86) | 0.10 |
| >1 d | 361 (14) | 361 (15) | 607 (14) | |
| Index admission cost # , USD | 24 343 (18 588–30 166) | 24 168 (18 886–29 753) | 24 469 (18 487–30 381) | 0.38 |
Values are expressed as mean±SD, median (interquartile range), or % unless otherwise noted. Exact counts (n) for variables with <10 patients are not detailed as per the Healthcare Cost and Utilization Project data use agreement. The rate of the overall incidence of cardiac tamponade (computed as cardiac complication) was 0.62% (0.76% among those ≥80 years old and 0.55% among those <80 years old). CABG indicates coronary artery bypass surgery; CHA2DS2‐VASc, Congestive heart failure, Hypertension, Age ≥75 years, Diabetes mellitus, prior Stroke or transient ischemic attack, Vascular disease (including previous myocardial infarction), Age 65 to 74 years, Sex category; MAE, major adverse event; and USD, United States dollar.
Adjusted P values for each variable were computed from adjusting sampling design by discharge‐level weights, cluster, and strata.
Non‐white race/ethnicity included Black, Hispanic, Asian/Pacific islander, Native Americans and “other” as per National Inpatient Sample (NIS) categorization.
Race was missing in 3.1%.
Type of admission was missing in 0.3%.
Median household income was missing in 1.4%.
Urban location was defined as counties in metro areas of ≥50 000 population.
Index admission cost was missing in 0.6%.
In‐Hospital Complications
The composite of in‐hospital MAE occurred in 5.1% of patients, with statistical difference between patients ≥80 and <80 years old (6.0% versus 4.6%, P=0.01); and this difference was mainly driven by the numerically higher rate of cardiac complications (2.4% versus 1.8%, P=0.09) and death (0.3% versus 0.1%, P=0.05) among individuals ≥80 years old as compared with <80 years old (Table 1).
A quarterly analysis indicates that the number of LAAC procedures increased over time. Based on the Cochran‐Armitage trend test, while the incidence of in‐hospital MAE significantly decreased from 16.7% in October to December 2015 to 7.6% in October to December 2018 in patients ≥80 years old (P trend=0.02), it remained steady (6.0%–6.5%, P trend=1.00) among those <80 years old (Figure 4).
Figure 4. Temporal trends in left atrial appendage closure procedures performed quarterly and in‐hospital complications from 2015 to 2018 according to age ≥80 years old and <80 years old.
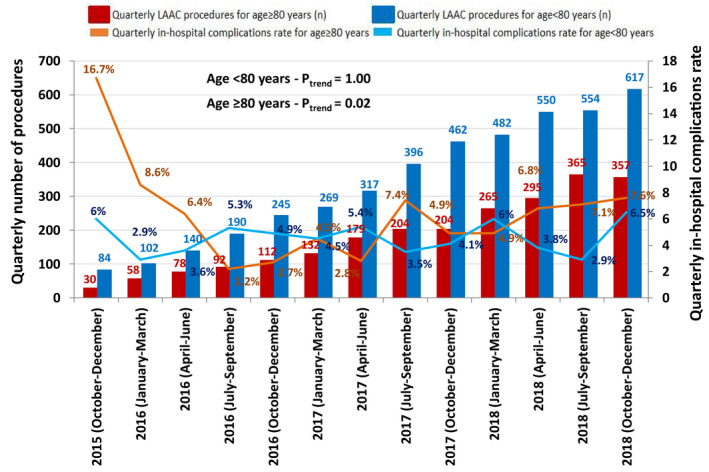
Cochran‐Armitage trend test shows statistically significant decrease in complication rates over time among ≥80 year‐old patients. LAAC indicates left atrial appendage closure.
To further evaluate the factors associated with in‐hospital MAE, the patient's baseline, and periprocedural characteristics according to age ≥80 and <80 years old are detailed in Table 2. Patients in the ≥80‐year‐old group who experienced in‐hospital MAE had more previous history of diabetes (39% versus 27%, P=0.003), congestive heart failure (51% versus 37%, P=0.003), renal disease (42% versus 23%, P<0.001), dementia (9.2% versus 4.5%, P=0.01), depression (13% versus 5.7%, P<0.001), and anemia (35% versus 16%, P<0.001). Patients in the <80‐year‐old group who experienced in‐hospital MAE had more previous history of dyslipidemia (67% versus 60%, P=0.03), diabetes (47% versus 38%, P=0.01), congestive heart failure (49% versus 38%, P=0.001), renal disease (42% versus 21%, P<0.001), and anemia (33% versus 16%, P<0.001). In both cohorts, the proportion of patients with in‐hospital MAE increased with the increase in comorbidity burden as assessed by the CCI (2.7±1.8 versus 1.8±1.9, in patients ≥80 years old and 2.7±2.0 versus 2.1±1.7 in those <80 years old, P<0.001 for both), and ECS (11.6±6.2 versus 9.9±5.6, P=0.001, in patients ≥80 years old, and 11.93±6.6 versus 9.5±5.9, P<0.001, in those <80 years old), Table 2.
Table 2.
Baseline Characteristics of the Study Population According to the Occurrence of In‐Hospital MAE
| Patients' characteristics | ≥80 y (n=2371) | <80 y (n=4408) | Adjusted P value† | Adjusted P value‡ | ||||
|---|---|---|---|---|---|---|---|---|
|
With in‐hospital MAE n=142 |
Without in‐hospital MAE n=2229 |
Adjusted P value* |
With in‐hospital MAE n=203 |
Without in‐hospital MAE n=4205 |
Adjusted P value* | |||
| Mean age, y | 84.1±2.8 | 84.1±3.0 | 0.87 | 71.2±7.0 | 71.6±6.2 | 0.47 | <0.001 | <0.001 |
| Women | 77 (54) | 964 (43) | 0.01 | 96 (47) | 1693 (40) | 0.05 | 0.22 | 0.02 |
| Race ‖ | ||||||||
| White | 119 (85) | 1918 (89) | 0.18 | 151 (77) | 3475 (85) | 0.001 | 0.06 | <0.001 |
| Non‐White § | 21 (15) | 243 (11) | 46 (23) | 85 (15) | ||||
| Median household income ¶ | ||||||||
| 0–25th percentile | 26 (19) | 397 (18) | 0.63 | 41 (21) | 889 (21) | 0.99 | 0.84 | 0.01 |
| 26–50th percentile | 35 (25) | 570 (26) | 50 (26) | 1085 (26) | ||||
| 51–75th percentile | 45 (33) | 627 (29) | 55 (28) | 1137 (28) | ||||
| 76–100th percentile | 32 (23) | 606 (27) | 49 (25) | 1038 (25) | ||||
| Patient location # | ||||||||
| Urban | 121 (86) | 1923 (86) | 0.97 | 163 (80) | 3481 (83) | 0.34 | 0.13 | <0.001 |
| Rural | 19 (14) | 305 (14) | 40 (20) | 718 (17) | ||||
| Hospital teaching status and location | ||||||||
| Rural | <10 (2.1) | 40 (1.8) | 0.58 | <10 (1.5) | 78 (1.9) | 0.92 | 0.62 | 0.89 |
| Urban nonteaching | 17 (12) | 211 (9.5) | 19 (9.4) | 383 (9.1) | ||||
| Urban teaching | 122 (86) | 1978 (89) | 181 (89) | 3744 (89) | ||||
| Hospital bed‐size | ||||||||
| Small | 20 (14) | 268 (12) | 0.52 | 15 (7.4) | 424 (10) | 0.44 | 0.10 | 0.04 |
| Medium | 25 (18) | 474 (21) | 45 (22) | 879 (21) | ||||
| Large | 97 (68) | 1487 (67) | 143 (70) | 2902 (69) | ||||
| Primary payer | ||||||||
| Medicare | 136 (96) | 2110 (95) | 0.77 | 176 (87) | 3589 (86) | 0.67 | 0.02 | <0.001 |
| Medicaid | <10 (0) | <10 (0.4) | <10 (2.5) | 68 (1.6) | ||||
| Private insurance | <10 (3.5) | 73 (3.3) | 18 (8.9) | 451 (11) | ||||
| Other | <10 (0.7) | 33 (1.5) | <10 (2.0) | 88 (2.1) | ||||
| Comorbidities | ||||||||
| Smoking | 33 (23) | 754 (34) | 0.01 | 66 (33) | 1505 (36) | 0.34 | 0.07 | 0.12 |
| Dyslipidemia | 87 (61) | 1327 (60) | 0.68 | 137 (67) | 2507 (60) | 0.03 | 0.25 | 0.95 |
| Hypertension | 125 (88) | 1900 (85) | 0.36 | 183 (90) | 3614 (86) | 0.09 | 0.52 | 0.44 |
| Diabetes | 55 (39) | 605 (27) | 0.003 | 95 (47) | 1602 (38) | 0.01 | 0.14 | <0.001 |
| Previous myocardial infarction | 20 (14) | 250 (11) | 0.30 | 26 (13) | 556 (13) | 0.86 | 0.73 | 0.02 |
| Previous CABG | 24 (17) | 376 (17) | 0.99 | 30 (15) | 582 (14) | 0.71 | 0.60 | 0.001 |
| Congestive heart failure | 72 (51) | 855 (37) | 0.003 | 99 (49) | 1578 (38) | 0.001 | 0.72 | 0.51 |
| Valvular disease | 42 (30) | 596 (27) | 0.46 | 42 (21) | 761 (18) | 0.35 | 0.06 | <0.001 |
| Previous cerebrovascular disease | 45 (32) | 640 (28) | 0.45 | 52 (26) | 1214 (29) | 0.32 | 0.20 | 0.89 |
| Peripheral vascular disease | 21 (15) | 239 (11) | 0.13 | 25 (12) | 418 (10) | 0.27 | 0.50 | 0.33 |
| Renal disease | 59 (42) | 515 (23) | <0.001 | 86 (42) | 893 (21) | <0.001 | 0.88 | 0.09 |
| Chronic pulmonary disease | 33 (23) | 418 (19) | 0.19 | 52 (26) | 978 (23) | 0.44 | 0.61 | <0.001 |
| Obesity | 19 (13) | 216 (9.7) | 0.15 | 47 (23) | 847 (20) | 0.30 | 0.02 | <0.001 |
| Dementia | 13 (9.2) | 100 (4.5) | 0.01 | <10 (2.5) | 69 (1.6) | 0.37 | 0.004 | <0.001 |
| Rheumatic disease | <10 (0.7) | 59 (2.6) | 0.15 | <10 (3.4) | 132 (3.1) | 0.81 | 0.09 | 0.26 |
| Liver disease | <10 (1.4) | 26 (1.2) | 0.80 | <10 (3.0) | 72 (3.5) | 0.66 | 0.34 | <0.001 |
| Hypothyroidism | 31 (22) | 427 (19) | 0.43 | 36 (18) | 644 (15) | 0.35 | 0.33 | <0.001 |
| Anemia | 50 (35) | 356 (16) | <0.001 | 68 (33) | 656 (16) | <0.001 | 0.74 | 0.70 |
| Depression | 19 (13) | 128 (5.7) | <0.001 | 13 (6.4) | 350 (8.3) | 0.33 | 0.03 | <0.001 |
| Cancer | <10 (2.8) | 61 (2.7) | 0.95 | <10 (3.0) | 89 (2.1) | 0.42 | 0.93 | 0.12 |
| Charlson comorbidity index | 2.7±1.8 | 1.8±1.9 | <0.001 | 2.7±2.0 | 2.1±1.7 | <0.001 | 0.49 | <0.001 |
| 0 | 15 (11) | 443 (20) | <0.001 | 22 (11) | 703 (17) | <0.001 | 0.68 | 0.001 |
| 1 | 38 (27) | 634 (28) | 43 (21) | 1142 (27) | ||||
| 2 | 23 (16) | 486 (22) | 38 (19) | 930 (22) | ||||
| ≥3 | 66 (46) | 666 (30) | 100 (49) | 1430 (34) | ||||
| Elixhauser comorbidity score | 11.6±6.2 | 9.9±5.6 | 0.001 | 11.9±6.6 | 9.5±5.9 | <0.001 | 0.75 | 0.03 |
| ≤0 | <10 (1.4) | 19 (0.9) | 0.004 | <10 (2.0) | 59 (1.4) | <0.001 | 0.88 | 0.06 |
| 1–5 | 29 (20) | 785 (35) | 44 (22) | 1543 (37) | ||||
| 6–10 | 34 (24) | 455 (20) | 42 (21) | 887 (21) | ||||
| ≥11 | 77 (54) | 970 (44) | 113 (56) | 1716 (41) | ||||
| CHADS2 score | 3.4±1.3 | 3.1±1.2 | 0.004 | 2.8±1.3 | 2.6±1.3 | 0.06 | <0.001 | <0.001 |
| ≥2 | 132 (93) | 2080 (93) | 0.86 | 172 (85) | 3342 (79) | 0.07 | 0.02 | <0.001 |
| CHA2DS2‐VASc score | 5.2±1.5 | 4.7±1.4 | 0.001 | 4.3±1.5 | 4.0±1.5 | 0.01 | <0.001 | <0.001 |
| ≥2 | 142 (100) | 2229 (100) | … | 200 (99) | 4058 (97) | 0.12 | 0.15 | <0.001 |
| Length of stay, d | 2 (1–5) | 1 (1–1) | <0.001 | 3 (1–5) | 1 (1–1) | <0.001 | 0.30 | 0.51 |
| ≤1 d | 48 (34) | 1962 (88) | <0.001 | 62 (31) | 3739 (89) | <0.001 | 0.52 | 0.28 |
| >1 d | 94 (66) | 267 (12) | 141 (69) | 466 (11) | ||||
| Index admission cost**, USD | 28 727 (21 145–37 480) | 24 054 (18 803–29 338) | <0.001 | 30 934 (23 706–38 334) | 24 240 (18 357–29 974) | <0.001 | 0.13 | 0.48 |
Values are expressed as mean±SD, median (interquartile range), or n (%) unless otherwise noted. Exact counts (n) for variables with <10 patients are not detailed as per the Healthcare Cost and Utilization Project data use agreement. CABG indicates coronary artery bypass surgery; CHA2DS2‐VASc, Congestive heart failure, Hypertension, Age ≥75 years, Diabetes mellitus, prior Stroke or transient ischemic attack, Vascular disease (including previous myocardial infarction), Age 65 to 74 years, Sex category; MAE, major adverse event; and USD, United States dollar.
*Adjusted P values for each variable were computed from adjusting sampling design by discharge‐level weights, cluster, and strata.
Differences between ≥80 and <80 years with † and without ‡ in‐hospital MAE.
Non‐white race/ethnicity included Black, Hispanic, Asian/Pacific islander, Native Americans and “other” as per National Inpatient Sample (NIS) categorization.
Race was missing 3.0% in ≥80 years old cohort and 3.1% in <80 years old cohort.
Median household income was missing 1.4% in ≥80 years old cohort and 1.5% in <80 years old cohort.
Urban location was defined as counties in metro areas of ≥50 000 population.
Index admission cost was missing 0.6% in ≥80 years old cohort and 0.6% in <80 years old cohort.
Length of Hospital Stay and Cost
The overall median length of stay was similar for patients ≥80 and <80 years (P=0.38), Table 1. The length of stay was significantly longer among those ≥80 years old and <80 years old who experienced in‐hospital MAE compared with counterparts who did not experience in‐hospital MAE (Wilcoxon rank‐sum test, P<0.001, for both). Patients ≥80 years old and <80 years old who experienced in‐hospital MAE had a significantly higher index cost compared with those who did not have complications ($28 727; IQR, $21 145–37 480 USD versus $24 054; IQR, $18 803–29 338 USD and $30 934; IQR, $23 706–38 334 USD versus $24 240; IQR, $18 357–29 974 USD, respectively) (Table 2).
Associations With In‐Hospital Complications
After multilevel modeling adjusting for age, sex, race, and relevant comorbidities, the risk of in‐hospital MAE for the whole cohort was significantly increased by factoring age ≥80 years old (1.4‐fold) as well as female sex (1.3‐fold). The presence of congestive heart failure (odds ratio [OR], 1.32 [95% CI, 1.16–1.49]), diabetes (OR, 1.28 [95% CI, 1.13–1.45]), renal disease (OR, 2.38 [95% CI, 2.08–2.72]), weight loss (OR, 3.39 [95% CI, 1.79–6.43]), dementia (OR, 2.29, [95% CI, 1.72–3.04]), anemia (OR, 2.27, [95% CI, 1.98–2.60]), and dyslipidemia (OR, 1.16 [95% CI, 1.02–1.32]) had higher impact on the risk of MAE (Figure 5A). Among patients ≥80 years old, higher odds of in‐hospital MAE were observed in women (1.61‐fold), and individuals with congestive heart failure (≈2‐fold), diabetes (≈1.5‐fold), renal disease (2.6‐fold), anemia (≈2.7‐fold), and dementia (≈5‐fold), Figure 5B. In patients <80 years, higher risk of in‐hospital MAEs were encountered among women (≈1.4‐fold) as well as patients with diabetes (≈1.3‐fold), renal disease (≈2.6‐fold), anemia (≈2‐fold), and dyslipidemia (1.2‐fold) (Figure 5C).
Figure 5. Multilevel multivariable logistic regression analyses of factors associated with in‐hospital MAE.
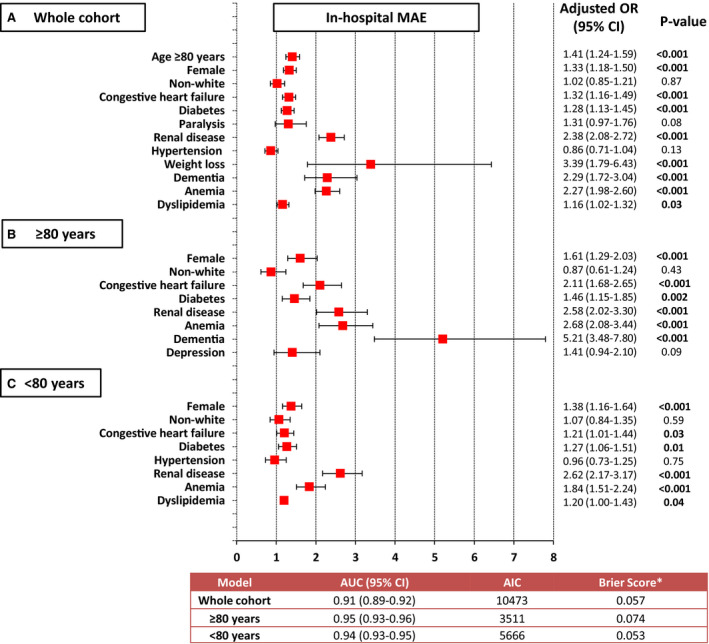
A, Whole cohort, (B) ≥80 years old, and (C) <80 years old. AIC indicates Akaike's information criterion (lower values indicate better fit of the model); AUC, area under receiver operating characteristic curve; MAE, major adverse events; and OR, odds ratio. For continuous variables, the OR are per unit of increase in each of the predictive factors. *Lower values (close to 0) indicate better calibration of the model.
In the whole cohort, the area under the receiver operating characteristic curves, Akaike information criterion, and Brier score were 0.91 (95% CI, 0.89–0.92), 10 473, and 0.057, respectively. In those ≥80 years old, the area under the receiver operating characteristic curves, Akaike information criterion, and Brier score were 0.95 (95% CI, 0.93–0.96), 3511, and 0.074, respectively; whereas these values were 0.94 (95% CI, 0.93–0.95), 5666, and 0.053, respectively, in those ≥80 years old, (Figure 5).
DISCUSSION
In this cohort of 6779 hospitalizations for LAAC, close to 1 in 3 patients were ≥80 years old and, therefore, represents one of the largest cohorts of patients ≥80 years of age who underwent LAAC. The overall cohort presented with high burden of comorbidities. Patients ≥80 years old experienced higher rates of in‐hospital complications mainly driven by the numerically higher rate of cardiac complications and death among individuals ≥80 years old as compared with <80 years old. Women and the presence of heart failure, diabetes, renal disease, and anemia were factors commonly associated with in‐hospital adverse events among both groups.
Contribution to Previous Studies
Studies have shown that among individuals ≥80 years of age, >80% of this population present with multiple comorbid conditions, and comorbidity burden is a strong predictor of poor outcomes. 14 , 15 , 19 , 20 , 21 , 22 , 23 One potential explanation for the differences in CCI and ECS (lower CCI in patients ≥80 years old while higher ECS as compared with <80 years old) would be the fact that the CCI captures about half the number of comorbidities than the ECS and, therefore, the differences in P values are likely driven by the difference in sample sizes.
Elderly patients are generally more fragile, and more prone to complications during interventional procedures; therefore, the benefit of LAAC may indeed be limited or at least questioned. Nonetheless, as above‐stated, elderly patients show a combined increased risk of thromboembolic and bleeding events. Previous registry data showed similar periprocedural complications in patients <75 versus ≥75 years old, although older patients had a higher incidence of cardiac tamponade. 24 Another registry compared the safety and efficacy of LAAC in patients <85 versus ≥85 years old and revealed similar procedural success and no differences in procedure‐related adverse events. 25 Of note, the sample size of elderly patients included in these 2 registries was indeed significantly smaller than ours (ie, 430 and 84 patients ≥75 and ≥85 years old, respectively). 24 , 25
Our findings are relevant since elderly patients are often underrepresented in clinical trials and across a broad spectrum of health conditions, with marked disparities in the type of presentation, and clinical outcomes. 26 , 27 Moreover, our study presents national estimates in which one third of the patients (n=2371) were ≥80 years of age, and the overall number of patients who have undergone LAAC has increased over time, while the occurrence of in‐hospital MAE appears to have improved.
Strengths and Limitations
The strength of our analysis lies in its large sample size, and that it is the first study to appraise the clinical impact of comorbidity burden in patients ≥80 years old undergoing LAAC. Nonetheless, this study presents with limitations. The main limitation lies in its retrospective nature and reliance on an administrative claims database, therefore, errors while coding may have occurred and thus affected the data gathering and the ability to adjust for unmeasured confounders. Even though the event rates after LAAC were relatively low and hence pooled for a composite end point, postprocedural MAE are not well adjudicated in NIS. Moreover, pharmacologic agents such as anticoagulation management were not available and remain a source for potential confounders in terms of bleeding or thromboembolic events. Finally, the impact of these findings on long‐term follow‐up remains unknown.
CONCLUSIONS
In this cohort‐based study including a large number of patients ≥80 years old who underwent LAAC, the rates of in‐hospital MAE were higher compared with patients <80 years. Women and those with heart failure, diabetes, renal disease, and anemia experienced higher rates of in‐hospital adverse events in both groups. Furthermore, adequately powered research is needed to develop a risk stratification model to help with the clinical decision‐making of patients undergoing LAAC.
Sources of Funding
This research received no specific grant from any funding agency in the public, commercial, or not‐for‐profit sectors. Sanjoy received partial funding for his MSc studies from a Lawson Health Research Institute Internal Research Fund (studentship award).
Disclosures
Dr Holmes is on the Advisory Board for Boston Scientific, unpaid. The remaining authors have no disclosures to report.
Supporting information
Tables S1–S3
Acknowledgments
We are grateful to the Healthcare Cost and Utilization Project (HCUP) and the HCUP Data Partners for providing the data used in the analysis.
This manuscript was sent to Marwan Refaat, MD, Guest Editor, for review by expert referees, editorial decision, and final disposition.
For Sources of Funding and Disclosures, see page 13.
REFERENCES
- 1. Freedman JE, Gersh BJ. Atrial fibrillation and stroke prevention in aging patients: what's good can be even better. Circulation. 2014;130:129–131. doi: 10.1161/CIRCULATIONAHA.114.010873 [DOI] [PubMed] [Google Scholar]
- 2. Gage BF, Waterman AD, Shannon W, Boechler M, Rich MW, Radford MJ. Validation of clinical classification schemes for predicting stroke: results from the National Registry of Atrial Fibrillation. JAMA. 2001;285:2864–2870. doi: 10.1001/jama.285.22.2864 [DOI] [PubMed] [Google Scholar]
- 3. Lip GY, Lim HS. Atrial fibrillation and stroke prevention. Lancet Neurol. 2007;6:981–993. doi: 10.1016/S1474-4422(07)70264-8 [DOI] [PubMed] [Google Scholar]
- 4. Lip GY, Nieuwlaat R, Pisters R, Lane DA, Crijns HJ. Refining clinical risk stratification for predicting stroke and thromboembolism in atrial fibrillation using a novel risk factor‐based approach: the Euro Heart Survey on Atrial Fibrillation. Chest. 2010;137:263–272. doi: 10.1378/chest.09-1584 [DOI] [PubMed] [Google Scholar]
- 5. Dang G, Jahangir I, Sra J, Tajik AJ, Jahangir A. Atrial fibrillation and stroke in elderly patients. J Patient Cent Res Rev. 2016;3:217–229. doi: 10.17294/2330-0698.1409 [DOI] [Google Scholar]
- 6. Kirchhof P, Benussi S, Kotecha D, Ahlsson A, Atar D, Casadei B, Castella M, Diener H‐C, Heidbuchel H, Hendriks J, et al. 2016 ESC guidelines for the management of atrial fibrillation developed in collaboration with EACTS. Europace. 2016;18:1609–1678. doi: 10.1093/europace/euw295 [DOI] [PubMed] [Google Scholar]
- 7. Andrade JG, Macle L, Nattel S, Verma A, Cairns J. Contemporary atrial fibrillation management: a comparison of the current AHA/ACC/HRS, CCS, and ESC guidelines. Can J Cardiol. 2017;33:965–976. doi: 10.1016/j.cjca.2017.06.002 [DOI] [PubMed] [Google Scholar]
- 8. January CT, Wann LS, Calkins H, Chen LY, Cigarroa JE, Cleveland JC Jr, Ellinor PT, Ezekowitz MD, Field ME, Furie KL, et al. AHA/ACC/HRS focused update of the 2014 AHA/ACC/HRS guideline for the management of patients with atrial fibrillation: a report of the American College of Cardiology/American Heart Association Task Force on Clinical Practice Guidelines and the Heart Rhythm Society in Collaboration With the Society of Thoracic Surgeons. Circulation. 2019;140:e125–e151. doi: 10.1016/j.jacc.2019.01.011 [DOI] [PubMed] [Google Scholar]
- 9. Halperin JL, Hankey GJ, Wojdyla DM, Piccini JP, Lokhnygina Y, Patel MR, Breithardt G, Singer DE, Becker RC, Hacke W, et al. Efficacy and safety of rivaroxaban compared with warfarin among elderly patients with nonvalvular atrial fibrillation in the Rivaroxaban Once Daily, Oral, Direct Factor Xa Inhibition Compared With Vitamin K Antagonism for Prevention of Stroke and Embolism Trial in Atrial Fibrillation (ROCKET AF). Circulation. 2014;130:138–146. doi: 10.1161/CIRCULATIONAHA.113.005008 [DOI] [PubMed] [Google Scholar]
- 10. Guerriero F, Orlando V, Monetti VM, Colaccio FM, Sessa M, Scavone C, Capuano A, Menditto E. Predictors of new oral anticoagulant drug initiation as opposed to warfarin in elderly adults: a retrospective observational study in southern Italy. Ther Clin Risk Manag. 2018;14:1907–1914. doi: 10.2147/TCRM.S171346 [DOI] [PMC free article] [PubMed] [Google Scholar]
- 11. Holmes DR Jr, Doshi SK, Kar S, Price MJ, Sanchez JM, Sievert H, Valderrabano M, Reddy VY. Left atrial appendage closure as an alternative to warfarin for stroke prevention in atrial fibrillation: a patient‐level meta‐analysis. J Am Coll Cardiol. 2015;65:2614–2623. doi: 10.1016/j.jacc.2015.04.025 [DOI] [PubMed] [Google Scholar]
- 12. Tzikas A, Shakir S, Gafoor S, Omran H, Berti S, Santoro G, Kefer J, Landmesser U, Nielsen‐Kudsk JE, Cruz‐Gonzalez I, et al. Left atrial appendage occlusion for stroke prevention in atrial fibrillation: multicentre experience with the AMPLATZER Cardiac Plug. EuroIntervention. 2016;11:1170–1179. doi: 10.4244/EIJY15M01_06 [DOI] [PubMed] [Google Scholar]
- 13. Boersma LVA, Schmidt B, Betts TR, Sievert H, Tamburino C, Teiger E, Pokushalov E, Kische S, Schmitz T, Stein KM, et al. Implant success and safety of left atrial appendage closure with the watchman device: peri‐procedural outcomes from the EWOLUTION registry. Eur Heart J. 2016;37:2465–2474. doi: 10.1093/eurheartj/ehv730 [DOI] [PMC free article] [PubMed] [Google Scholar]
- 14. Bagur R, Martin GP, Nombela‐Franco L, Doshi SN, George S, Toggweiler S, Sponga S, Cotton JM, Khogali SS, Ratib K, et al. Association of comorbid burden with clinical outcomes after transcatheter aortic valve implantation. Heart. 2018;104:2058–2066. doi: 10.1136/heartjnl-2018-313356 [DOI] [PubMed] [Google Scholar]
- 15. Sanjoy S, Choi YH, Holmes D, Herrman H, Terre J, Alraies C, Ando T, Tzemos N, Mamas M, Bagur R. Comorbidity burden in patients undergoing left atrial appendage closure. Heart. 2021;107:1246–1253. doi: 10.1136/heartjnl-2020-317741 [DOI] [PubMed] [Google Scholar]
- 16. Healthcare Cost Utilization Project . Overview of the National (Nationwide) Inpatient Sample (NIS). Agency for Healthcare Research and Quality. Available at: http://www.hcup‐us.ahrq.gov/nisoverview.jsp. Accessed March 9, 2021 [Google Scholar]
- 17. Charlson ME, Pompei P, Ales KL, MacKenzie CR. A new method of classifying prognostic comorbidity in longitudinal studies: development and validation. J Chronic Dis. 1987;40:373–383. doi: 10.1016/0021-9681(87)90171-8 [DOI] [PubMed] [Google Scholar]
- 18. Elixhauser A, Steiner C, Harris DR, Coffey RM. Comorbidity measures for use with administrative data. Med Care. 1998;36:8–27. doi: 10.1097/00005650-199801000-00004 [DOI] [PubMed] [Google Scholar]
- 19. Velu JF, Haas SD, Van Mourik MS, Koch KT, Vis MM, Henriques JP, Van Den Brink RB, Boekholdt SM, Piek JJ, Bouma BJ, et al. Elixhauser comorbidity score is the best risk score in predicting survival after MitraClip implantation. Struct Heart. 2018;2:53–57. doi: 10.1080/24748706.2017.1404172 [DOI] [Google Scholar]
- 20. George S, Kwok CS, Martin GP, Babu A, Shufflebotham A, Nolan J, Ratib K, Bagur R, Gunning M, Mamas M. The influence of the Charlson Comorbidity Index on procedural characteristics, VARC‐2 endpoints and 30‐day mortality among patients who undergo transcatheter aortic valve implantation. Heart Lung Circ. 2019;28:1827–1834. doi: 10.1016/j.hlc.2018.11.006 [DOI] [PubMed] [Google Scholar]
- 21. Borovac JA, Kwok CS, Mohamed MO, Fischman DL, Savage M, Alraies C, Kalra A, Nolan J, Zaman A, Ahmed J, et al. The predictive value of CHA2DS2‐VASC score on in‐hospital death and adverse periprocedural events among patients with the acute coronary syndrome and atrial fibrillation who undergo percutaneous coronary intervention: a 10‐year National Inpatient Sample (NIS) analysis. Cardiovasc Revasc Med. 2020:S1553‐8389(20)30472‐3 [epub ahead of print]. doi: 10.1016/j.carrev.2020.08.003. Available at: https://pubmed.ncbi.nlm.nih.gov/32828675/. Accessed August 17, 2021 [DOI] [PubMed] [Google Scholar]
- 22. Kwok CS, Achenbach S, Curzen N, Fischman DL, Savage M, Bagur R, Kontopantelis E, Martin GP, Steg PG, Mamas MA. Relation of frailty to outcomes in percutaneous coronary intervention. Cardiovasc Revasc Med. 2020;21:811–818. doi: 10.1016/j.carrev.2019.11.009 [DOI] [PubMed] [Google Scholar]
- 23. Sparrow R, Sanjoy S, Choi YH, Elgendy IY, Jneid H, Villablanca PA, Holmes DR, Pershad A, Alraies C, Sposato LA, et al. Racial, ethnic and socioeconomic disparities in patients undergoing left atrial appendage closure. Heart. 2021. Apr 1 [epub ahead of print]. doi: 10.1136/heartjnl-2020-318650. Available at: https://pubmed.ncbi.nlm.nih.gov/33795381/. Accessed August 17, 2021 [DOI] [PubMed] [Google Scholar]
- 24. Freixa X, Gafoor S, Regueiro A, Cruz‐Gonzalez I, Shakir S, Omran H, Berti S, Santoro G, Kefer J, Landmesser U, et al. Comparison of efficacy and safety of left atrial appendage occlusion in patients aged <75 to >/= 75 years. Am J Cardiol. 2016;117:84–90. doi: 10.1016/j.amjcard.2015.10.024 [DOI] [PubMed] [Google Scholar]
- 25. Cruz‐Gonzalez I, Ince H, Kische S, Schmitz T, Schmidt B, Gori T, Foley D, de Potter T, Tschishow W, Vireca E, et al. Left atrial appendage occlusion in patients older than 85 years. Safety and efficacy in the EWOLUTION registry. Rev Esp Cardiol (Engl Ed). 2020;73:21–27. doi: 10.1016/j.rec.2019.02.008 [DOI] [PubMed] [Google Scholar]
- 26. Herrera AP, Snipes SA, King DW, Torres‐Vigil I, Goldberg DS, Weinberg AD. Disparate inclusion of older adults in clinical trials: priorities and opportunities for policy and practice change. Am J Public Health. 2010;100(suppl 1):S105–S112. doi: 10.2105/AJPH.2009.162982 [DOI] [PMC free article] [PubMed] [Google Scholar]
- 27. Tahhan AS, Vaduganathan M, Greene SJ, Alrohaibani A, Raad M, Gafeer M, Mehran R, Fonarow GC, Douglas PS, Bhatt DL, et al. Enrollment of older patients, women, and racial/ethnic minority groups in contemporary acute coronary syndrome clinical trials: a systematic review. JAMA Cardiol. 2020;5:714–722. doi: 10.1001/jamacardio.2020.0359 [DOI] [PubMed] [Google Scholar]
Associated Data
This section collects any data citations, data availability statements, or supplementary materials included in this article.
Supplementary Materials
Tables S1–S3