Abstract
Background
Exosomes are small membranous structures released from cells into the blood, regulating various biological processes. However, the role of exosomes in cardiotoxicity remains largely unclear. This study investigated the functional mechanism of exosomal microRNA‐96 (miR‐96) derived from bone marrow mesenchymal stem cells (BMSCs) in myocardial toxicity induced by doxorubicin.
Methods and Results
BMSCs were transfected with miR‐96 mimic, miR‐96 inhibitor, or the negative control before exosome isolation. The functional mechanism of BMSC‐derived exosomal miR‐96 was investigated in doxorubicin‐induced cell and rat models. The cardiac function, histological morphology, and fiber content of myocardium were examined. The expression levels of the following biomarkers were measured for assessment of cardiac injury: creatine kinase isoenzyme MB, cardiac troponin I, brain natriuretic peptide, soluble suppression of tumorigenesis‐2, tumor necrosis factor‐α, interleukin‐1β, interleukin‐6, superoxide dismutase, glutathione peroxidase, and malondialdehyde. Cell Counting Kit‐8 assay was used to measure the survival rate of cardiomyocytes. The expressions of miR‐96, Rac1, p‐IKKα/IKKα, p‐IKKβ/IKKβ, p‐IκBα/IκBα and p‐p65/p65 in myocardium and cardiomyocytes were also assessed. The targeting relationship between miR‐96 and Rac1 was verified by dual‐luciferase reporter assay. miR‐96 was downregulated, Rac1 was upregulated and the nuclear factor‐κB signaling pathway was activated in doxorubicin‐induced cell and animal models. Doxorubicin decreased antioxidative enzymes (superoxide dismutase and glutathione peroxidase) and increased myocardial injury biomarkers (creatine kinase isoenzyme MB, cardiac troponin I, and brain natriuretic peptide), proinflammatory cytokines (tumor necrosis factor‐α, interleukin‐1β, and interleukin‐6), malondialdehyde, and myocardial fibers. Exosomes derived from BMSCs ameliorated doxorubicin‐induced myocardial injuries. Overexpression of miR‐96 in exosomes derived from BMSCs further enhanced the protection of myocardium and cardiomyocytes against doxorubicin‐induced toxicity while miR‐96 knockdown abolished the protective effects of exosomes derived from BMSCs. Rac1 was a target gene of miR‐96. Rac1 inhibition could downregulate the expression of the nuclear factor‐κB signaling and further reverse the promotion of miR‐96 knockdown on doxorubicin‐induced myocardial toxicity.
Conclusions
BMSC‐derived exosomal miR‐96 protects myocardium against doxorubicin‐induced toxicity by inhibiting the Rac/nuclear factor‐κB signaling pathway.
Keywords: bone marrow mesenchymal stem cell, doxorubicin, exosome, miR‐96, myocardial toxicity, NF‐κB, Rac1
Subject Categories: Animal Models of Human Disease, Basic Science Research
Nonstandard Abbreviations and Acronyms
- BCA
bicinchoninic acid assay
- BMSC‐Exos
BMSC‐derived exosomes
- BMSCs
bone marrow mesenchymal stem cells
- cTnI
cardiac troponin I
- GSH‐Px
glutathione peroxidase
- IOD
integrated optical density
- LVEDP
left ventricular end‐diastolic pressure
- LVFS
left ventricular fractional shortening
- LVSP
left ventricular systolic pressure
- MSCs
mesenchymal stem cells
- SOD
superoxide dismutase
Clinical Perspective
What Is New?
Bone marrow mesenchymal stem cell‐derived exosomes attenuate doxorubicin‐induced myocardial toxicity by reducing oxidative stress and inflammation both in vivo and in vitro.
Bone marrow mesenchymal stem cell‐derived exosomes inhibit doxorubicin‐induced activation of nuclear factor‐κB signaling pathway in cardiomyocytes.
What Are the Clinical Implications?
Bone marrow mesenchymal stem cell‐derived exosomes can be used as carriers of functional molecules (such as a drug or microRNA) in therapies for doxorubicin‐induced cardiotoxicity.
Doxorubicin is a subtype of anthracyclines which are widely used for treatment of diverse solid and non‐solid malignancies. 1 However, an increase in cumulative anthracycline dose confers a high risk of cardiotoxicity, which limits the delivery of optimal chemotherapy to patients with cancer. 2 The pathogenic mechanisms of doxorubicin‐induced cardiomyopathy are multifactorial. Cardiotoxicity caused by doxorubicin is primarily attributed to oxidative stress besides other mechanisms such as iron regulatory proteins, mitochondrial dysfunction, inflammatory mediators, and apoptosis. 3 Many drugs have been investigated for their cardioprotective effects against doxorubicin‐induced cardiotoxicity. These drugs, including dexrazoxane, flavonoids, sildenafil, probucol, and rimonabant, either interfering with the cellular mechanisms of doxorubicin or directly managing the heart failure, are only examined for their short‐term benefits. 4 Exploration of drugs that can effectively ameliorate cardiotoxicity would help doxorubicin exert greater efficacy in cancer treatment.
Mesenchymal stem cell (MSC) therapy has been reported to improve cardiac function and reduce inflammatory responses and myocardial fibrosis in treatment for doxorubicin‐induced cardiomyopathy. 5 Accumulative studies have demonstrated that MSCs exert therapeutic effects by secreting exosomes. 6 Systematic administration of cardiac progenitor cell‐derived exosomes was reported to protect cardiomyocytes against doxorubicin‐induced toxicity by inhibiting oxidative stress. 7 Exosomes secreted by embryonic stem cells could inhibit inflammation‐dependent pyroptosis induced by doxorubicin in cardiomyocytes. 8 However, whether exosomes derived from bone marrow MSCs (BMSC‐Exos) can exert protective effect against doxorubicin‐induced myocardial toxicity remains largely unknown.
Exosomes mediate intercellular communications by delivering functional small RNAs and proteins to recipient cells. 9 MicroRNAs (miRNAs) are an array of small noncoding RNAs which play a vital role in post‐transcriptional regulation of gene expression by acting as endogenous mediators. 10 miRNAs have been intensively investigated for their potential as therapeutic targets in a wide range of disease conditions. A recent study found that microRNA‐96 (miR‐96) was aberrantly expressed in PM 2.5‐induced cardiovascular toxicity. 11 However, little is known about the precise function of miR‐96 in cardiotoxicity.
Rac1 is a Rho‐family small GTPase which regulates oxidative stress in cardiomyopathy. 12 Pitavastatin could attenuate doxorubicin‐induced cardiotoxicity by exerting antioxidative effects via inhibition of Rac1. 13 Rac1 was found to be a downstream target of miR‐96 in degenerative retinas. 14 Rac1 increased the expression of nuclear factor‐κB (NF‐κB) in astrocytes to promote neuronal apoptosis under hypoxia/ischemia condition. 15 NF‐κB represents a class of transcription factors which are implicated in the regulation of inflammatory responses. 16 Neither the interaction between miR‐96 and Rac1 nor Rac1 regulating NF‐κB is reported to function in doxorubicin‐induced cardiotoxicity. The present study uncovers the regulatory effects and mechanism of BMSC‐derived exosomal miR‐96 in doxorubicin‐induced myocardial toxicity.
Methods
Transparency and Openness Promotion Statement
The data, analytic methods, and study materials will be made available on request to other researchers for purposes of reproducing the results or replicating the procedures reported here.
Animal Source and Ethical Approval
Healthy specific pathogen free female adult Sprague Dawley rats (n=85, 250–300 g) were purchased from Vital River Laboratory Animal Technology Co., Ltd. (Beijing, China). The methods for animal euthanasia, tissue management, and disposal of dead animal bodies were approved by the Institutional Review Board and Institutional Animal Care and Use Committee of Harbin Medical University Cancer Hospital.
Isolation and Cultivation of BMSCs
BMSCs were isolated and cultured using the whole bone marrow adherence method. Rats were anesthetized by ether and killed by cervical dislocation. The rat bodies were immersed in 75% ethanol for 10 minutes. After that, the femur and tibia were separated from the rats under an aseptic condition and washed in sterile PBS (containing penicillin and streptomycin) for 3 times. Tissues adhering to the bones were removed and the epiphysis was cut off. The exposed marrow cavity was flushed with low glucose DMEM for several times and the bone marrow was homogenized. After that, the bone marrow was centrifuged at 1000 r/min for 5 minutes and the supernatant was then discarded. The cell sediments were resuspended in low‐glucose DMEM (Thermo Fisher Scientific, Massachusetts, USA) containing 10% fetal bovine serum (Thermo Fisher Scientific, Massachusetts, USA). The cells were seeded in a 100 mm culture dish at a density of 1×10⁹ cells/L and cultured in an incubator at 37°C with 5% CO2 and saturated humidity. The cells were observed under a microscope 3 days after cultivation and the culture medium was replaced every 2 to 3 days. The cells were subcultured at a ratio of 1:3 when the cell confluence reached 80% to 90%.
Identification of BMSCs
The third generation of the adherent cells was cultured in an osteogenic medium (Cyagen Biosciences, Guangzhou, China) for 21 days or in an adipogenic medium (Cyagen Biosciences, Guangzhou, China) for 14 days. After the cultivation, the osteogenesis‐induced cells were stained in alizarin red (Yuanye Bio‐Technology Co., Ltd., Shanghai, China) and the adipogenesis‐induced cells were stained in oil red O (Yuanye Bio‐Technology Co., Ltd., Shanghai, China). The cells were observed and photographed under a microscope. The expressions of CD34 and CD90 were measured by flow cytometry for identification of the stemness of these cells.
Cell Transfection
Adenoviruses inserted with miR‐96 mimic, mimic negative control (NC), miR‐96 inhibitor or inhibitor NC were purchased from Hanbio Biotechnology Co., Ltd. (Shanghai, China). BMSCs were infected with the adenoviruses at 100 mutiplicity of infection. Supernatant was collected to obtain exosomes 48 hours after cultivation.
Isolation of BMSC‐Exos
The culture medium of the subcultured cells was replaced after 24 hours and 3 days, after which supernatant of the culture medium was collected and preserved at −20°C for later use. The thawed supernatant was filtered through a 0.22‐μm strainer to centrifuge tubes for centrifugation at 100 000 g, 4°C for 70 minutes using a sub‐ultraspeed low‐temperature centrifugal. After the centrifugation, the supernatant was discarded and the sediments were resuspended in 1 mL of PBS and preserved at −80°C for later use. The protein concentration of exosomes was measured using a bicinchoninic acid assay (BCA) kit and recorded.
Identification of BMSC‐Exos
The diameter and concentration of exosomes were measured by nanoparticle trafficking analysis (NTA, USA). Particles obtained from BMSCs were resuspended in 100 μL of PBS and subjected to centrifugation. Sediments obtained after the centrifugation were resuspended in PBS. The sediment suspension was carefully injected into the detection tank using a 1‐mL syringe with air bubbles excluded. The particle diameter was calculated by Nanosight NS300 (Malvern, UK).
The sediments (20 μL) were added onto a copper grid at room temperature and maintained for 60 seconds. Then redundant solution was wiped using filter paper and the copper grid was added with 30 μL of 2% phosphotungstic acid solution (pH=6.8). Redundant solution was absorbed after 60 seconds and the copper grid was roasted under incandescent light for 10 minutes. The sediments were observed and photographed under a 120 kV transmission electron microscope.
The sediments obtained after the centrifugation were lysed in 100 μL of Western blotting‐Immunoprecipitation lysis buffer containing 1% phenylmethylsulfonyl fluoride. The concentration of proteins was measured using a BCA kit. The lysate was added with 20 μL of 5× sodium dodecyl sulfate loading buffer and boiled for 5 minutes. The proteins were loaded on gel and separated by SDS‐PAGE. Then the proteins were transferred onto a nitrocellulose membrane and blocked in 5% skim milk at room temperature for 60 minutes. After being eluted in 1× tris‐buffered saline and Tween 20, the proteins were incubated with antibodies of CD63 and CD81 (Santa Cruz Biotechnology) at 4°C overnight. The membrane was washed in 1× tris‐buffered saline and Tween 20 buffer and then added with horseradish peroxidase‐labeled secondary antibody. After 2 hours of incubation with antibody, the membrane was added with luminescent substrates and then exposed on a Western blot developer. The image of blots was saved.
Animal Experiments
Rats were injected with 6 intravenous doses of doxorubicin (Sigma) delivered at regular intervals from day 1 to day 11 (cumulative dose=15 mg/kg). Two doses of BMSC‐Exos (3×10¹⁰ particles each) were resuspended in 0.1 mL of PBS and then injected into the tail vein of the rats on days 5 and 11. Control rats were given intravenous injection of PBS on day 5 and 11. The rats were accordingly grouped into the normal group, doxorubicin group, exosome group, exosome plus mimic (Exo+mimic) NC group, exosome plus miR‐96 (Exo+miR‐96) mimic group, exosome plus inhibitor (Exo+inhibitor) NC group, and Exo+miR‐96 inhibitor group.
Cultivation and Grouping of Cardiomyocytes
H9c2 cells, obtained from the Cell Bank of the Chinese Academy of Sciences (Shanghai, China), were cultivated in DMEM (Corning, NY, USA) containing 4.5 g/L glucose, 1% streptomycin/penicillin and 10% fetal bovine serum (BioInd, Israel) at 37°C with 5% CO2. doxorubicin (0.1 μmol/L) was added into the medium to induce myocardial toxicity. The medium was replaced after 24 hours and the cells were cultivated for another 24 hours. H9c2 cells were incubated with 10 μg/mL BMSC‐Exos, Exo+mimic NC, Exo+miR‐96 mimic, Exo+inhibitor NC or Exo+miR‐96 inhibitor for 24 hours. Control cells were incubated with equal amounts of PBS. To investigate the effect of Rac1 on doxorubicin‐induced toxicity in cardiomyocytes, H9c2 cells incubated with Exo+miR‐96 inhibitor were subjected to serum deprivation for 6 to 8 hours before transfection of Rac1 siRNA (RiboBioCo., Ltd., Guangzhou, China) via Lipofectamine 2000 (Invitrogen, Carlsbad, CA, USA). The cells were accordingly divided into the following groups: normal group, doxorubicin group, exosome group, Exo+mimic NC group, Exo+miR‐96 mimic group, Exo+inhibitor NC group, Exo+miR‐96 inhibitor group, Exo+miR‐96 inhibitor+NC siRNA group, and Exo+miR‐96 inhibitor+Rac1 siRNA group.
Echocardiography
On day 28, the rats were anesthetized by intraperitoneal injection of 0.3 g/kg hydrated chloric acid. The rats were put in a supine position with their limbs and head fixed, and they were shaved from the chest to abdomen using an electric shaver. An ultrasound instrument (DP‐50 ev, Mindray, Guangdong, China) and ML6‐15 probe (13 MHz, 3.5 cm) covered with couplants were used for measurement of left ventricular internal diameter, both left end‐systolic (LVIDs) and end‐diastolic (LVIDd), left ventricular ejection fraction (LVEF), and left ventricular fractional shortening (LVFS).
Hemodynamic Assessment
The rats were anesthetized by intraperitoneal injection of 40 mg/kg pentobarbital sodium. The left ventricular systolic pressure (LVSP, mm Hg), left ventricular end‐diastolic pressure (LVEDP, mm Hg), the maximum rates of pressure rise and decline in the left ventricle (dp/dtmax and ‐dp/dtmax, mm Hg·s−1) were measured by BL‐420S biological functional system.
Collection of Serum and Myocardium Samples
The rats were killed after the cardiac function tests. The serum was separated from blood obtained from the eye socket and kept at room temperature for 30 minutes. The serum was centrifuged at 3000 r·min−1, 4°C for 15 minutes and then preserved at −80°C in separate portions. A part of the myocardium was rinsed in 4°C saline, fixed in 10% formalin and made into routine paraffin sections. The sections were later used for hematoxylin‐eosin staining and Masson staining. The remaining left ventricular tissue was preserved at −20°C.
Detection of Myocardial Injury‐Related Factors
The expression levels of creatine kinase isoenzyme MB (CK‐MB), cardiac troponin I (cTnI), and brain natriuretic peptide in the serum samples were measured by an automatic biochemical analyzer according to the instruction of the experiment kits (Siemens Healthcare Diognostics Inc, USA). Culture supernatant of cardiomyocytes was collected for measurement of the expressions of CK‐MB and cTnI.
Enzyme‐Linked Immunosorbent Assay
The expression levels of tumor necrosis factor‐α (TNF‐α), interleukin (IL)‐1β, and IL‐6 in the serum samples and culture supernatant of cardiomyocytes were measured using ELISA kits (R&D, Minnesota, USA) according to the instruction.
Assessment of Oxidative Stress and Cardiac Fibrosis
The cryopreserved left ventricular tissue was grinded at low temperature and then centrifuged at 4000 r·min−1, 4°C for 10 minutes. The supernatant was preserved at −80°C in separate portions. The protein levels of superoxide dismutase (SOD), glutathione peroxidase (GSH‐Px) and malondialdehyde in the left ventricular tissue and culture supernatant of cardiomyocytes were quantified using BCA kits (Nanjing Jiancheng Bioengineering Institute, Nanjing, China) based on the instruction. The expression of soluble suppression of tumorigenesis‐2 in the left ventricular tissue was also determined by the BCA method.
Hematoxylin‐Eosin Staining
The paraffin sections of myocardium were dewaxed in xylene I for 5 to 10 minutes and in xylene II for 5 to 10 minutes. The myocardium tissues were hydrated in gradient alcohol (100% alcohol, 5 minutes; 90% alcohol, 2 minutes; 70% alcohol, 2 minutes) and in distilled water for 2 minutes. The tissues were dehydrated in 95% alcohol and cleared in xylene. The tissues were mounted by neutral balsam and observed under a microscope.
Masson Staining
The dewaxed paraffin sections of myocardium were fixed in Zenker’s fixative for 12 hours and slightly washed after removal of mercury and iodine. The myocardium tissues were stained in acid fuchsin for 5 to 10 minutes, followed by 0.05% glacial acetic acid wash and 5 minutes treatment with 1% phosphomolybdic acid. Next, the tissues were directly counterstained with aniline blue for 5 minutes and then washed in 1% glacial acetic acid for 1 minutes. The tissues were immersed in alcohol and xylene in sequence and then mounted. Five fields of each section were randomly selected for observation under a microscope. The collagen fibers were stained blue and the myocytes were in red. The quantitative change of collagen fibers was judged according to the blue area. The integrated optical density (IOD) of myocardial tissue was analyzed by Image‐Pro Plus 4.1 imaging software (Media Cybernetics, Rockville, MD, USA).
Cell Counting Kit‐8 Assay
Cardiomyocytes at the logarithmic growth phase were seeded in a 96‐well plate at a density of 1×10⁴ cells/well and cultivated in an incubator. No‐cell group, control group, and experimental group were set in this assay. Each group had 3 duplicates. All groups were added with 10 μL of Cell Counting Kit‐8 reagent and incubated for 1 to 2 hours. The absorbance (A) was measured by a microplate reader at 450 nm. Cell survival= (A experimental group‐A no‐cell group) / (A control group‐A no‐cell group) × 100%.
Quantitative real time polymerase chain reaction
The total RNA was extracted from myocardium tissues and H9c2 cells using TRIzol reagent. The RNA purity and concentration were measured by a NanoDrop spectrometer. The RNA was reversely transcribed into cDNA using a TaKaRa kit according to the instruction. GAPDH served as a reference gene in the polymerase chain reaction. Each RNA sample had 3 duplicates. The relative quantity of miR‐96 was calculated using the 2‐△△Ct method. The primer design and polymerase chain reaction experiments were performed by Vipotion Biotech Co., Ltd. (Guangzhou, China). The primer sequences are presented in Table.
Table 1.
Primer Sequences
| Name of Primer | Sequences |
|---|---|
| miR‐96‐F | TACCATCTGCTTGGCCGATT |
| miR‐96‐R | CGCTTTTCCCATATTGGCACT |
| U6‐F | GCTTGCTTCGGCAGCACATATAC |
| U6‐R | TGCATGTCATCCTTGCTCAGGG |
| Rac1‐F | CCTGCTCATCAGTTACACGACCA |
| Rac1‐R | GTCCCAGAGGCCCAGATTCA |
| GAPGH‐F | GTCAGTGGTGGACCTGACCT |
| GAPDH‐R | TGCTGTAGCCAAATTCGTTG |
F indicates forward primer; miR‐96, microRNA‐96; and R, reverse primer.
Western Blot
Myocardium tissues (100 mg) were immersed in lysis buffer on ice for 1 hour. The concentration of the proteins extracted from the myocardium tissues was quantified using a BCA kit (Beyotime, Beijing, China). The proteins were subjected to SDS‐PAGE and transferred onto a membrane. After being confined in bovine serum albumin, the proteins were incubated with primary antibodies of Rac1 (sc‐514583, 1:1000), phosphorylated (p)‐IKKα (sc‐166231, 1:1000), IKKα (sc‐166231, 1:1000), p‐IKKβ (sc‐23470‐R, 1:1000), IKKβ (sc‐8014, 1:1000), p65 (sc‐8008, 1:200) (Santa Cruz Biotechnology), p‐IκBα (#4814, 1:1000), IκBα (#9246, 1:1000) and p‐p65 (#3033, 1:1000) (Cell Signaling Technology). After wash, the proteins were incubated with secondary antibody. After the incubation, the membrane was subjected to color development by electrochemiluminescence. The ratio of the average gray value of Rac1 to that of the corresponding reference protein GAPGH represents the relative expression of the target protein.
Dual‐Luciferase Reporter Assay
TargetScan predicted that Rac1 was a possible downstream target of miR‐96. Luciferase reporter vectors inserted with the wild‐type or mutated sequences of Rac1 were co‐transfected with miR‐96 mimic or mimic NC into H9c2 cells. The activity of Firefly luciferase and Renilla luciferase was tested using a microaperture fluorescence detector 48 hours after the transfection. Renilla luciferase activity served as the internal reference. The dual‐luciferase activity detection kit was purchased from Solarbio Science & Technology Co., Ltd. (Beijing, China).
Statistical Analysis
Data were analyzed using SPSS 18.0 (IBM Corp., Armonk, NY, USA) and GraphPad Prism 6.0 (GraphPad Software Inc.) and presented as mean±SD. A Student t‐test was applied for comparison between 2 groups and 1‐way ANOVA was for multigroup comparisons. P<0.05 was considered statistically significant.
Results
Identification of BMSC‐Exos
The third generation of BMSCs was spiral‐shaped homogeneous entities (Figure 1A). The third generation of BMSCs had distinct calcium nodules 21 days after osteogenic differentiation (Figure 1B). The BMSCs produced lipid droplets 14 days after adipogenic induction (Figure 1C). Flow cytometry detected that there were 4.03% of CD34 and 99.4% of CD90 expressing in the third generation of the adherent cells (Figure 1D), indicating the stemness of these cells. The particles extracted from BMSCs had an average diameter of about 90 nm (Figure 1E). These particles were discoid vesicles with diameters ranging from 30 to 100 nm (Figure 1F) and positively expressed exosome markers (CD63 and CD9) (Figure 1G). From the above, these particles isolated from BMSCs were identified as BMSC‐Exos. Additionally, miR‐96 was upregulated (4.12 times higher, P<0.001) in BMSC‐Exos of the Exo+miR‐96 mimic group and downregulated (0.23 times lower, P<0.001) in BMSC‐Exos of the Exo+miR‐96 inhibitor group (Figure 1H).
Figure 1. Successful isolation of bone marrow mesenchymal stem cell (BMSC)‐exosome.
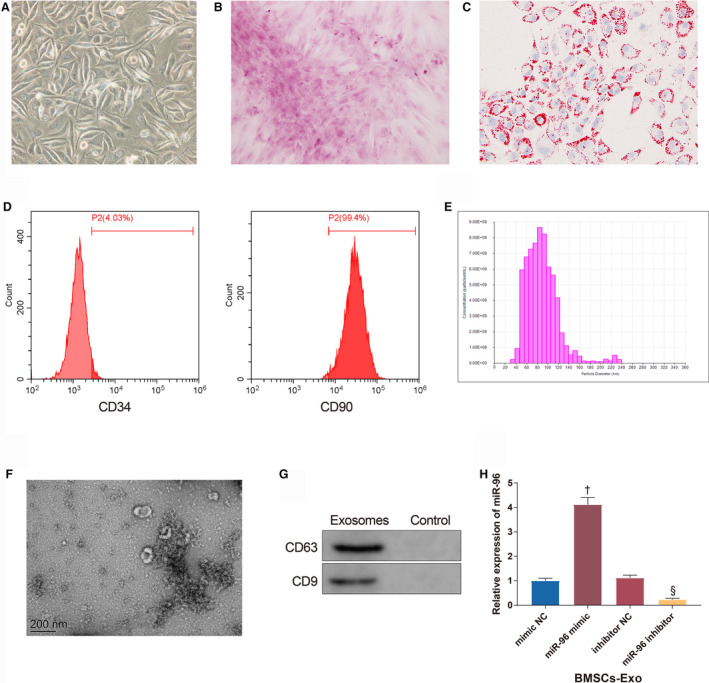
A, The morphology of the third generation of BMSCs under a microscope (Scale bar=200 μm). B, Calcium nodules produced by BMSCs after osteogenic differentiation (Scale bar=200 μm). C, Lipid droplets produced by BMSCs after adipogenic differentiation (Scale bar=200 μm). D, The expressions of CD34 and CD90 tested by flow cytometry. E, the diameter distribution of particles extracted from BMSCs. F, Exosome sediments observed under a transmission electron microscope (200 nm). G, The expressions of CD63 and CD9. H, The expression of miR‐96 in BMSC‐exosome; n=3. BMSCs‐Exo indicates bone marrow mesenchymal stem cell‐exosomes; miR‐96, microRNA‐96; and NC, negative control. † P<0.05, compared with the mimic NC group; § P<0.05, compared with the inhibitor NC group; data were presented as mean±SD; data were analyzed using 1‐way ANOVA and the Tukey test was applied for post hoc multiple comparisons.
BMSC‐Exos Ameliorate Doxorubicin‐Induced Myocardial Toxicity
Doxorubicin was intravenously injected in the tail of the rats to induce myocardial toxicity. To investigate the effect of BMSC‐Exos on myocardial toxicity, 2 doses of BMSC‐Exos were injected into the tail vein of the rats. The echocardiographic assessment showed that on day 28, LVEF (35.72±4.35%)/LVFS (16.31±2.78%) were decreased and LVIDs (4.67±0.51 mm)/LVIDd (6.12±0.49 mm) were increased in the doxorubicin group compared with the normal group (66.12±3.02%, 40.21±3.17%, 2.56±30.21 mm, 3.62±0.34 mm) (Figure 2A and 2B, all P<0.001). BMSC‐Exos treatment increased LVEF (50.43±4.26%)/LVFS (30.48±2.97%) and decreased LVIDs (3.21±0.28 mm)/LVIDd (4.73±0.39 mm) in doxorubicin‐treated rats (Figure 2A and 2B, all P<0.001). Additionally, LVSP (102.31±11.46 mm Hg) and±dp/dt (4862.54±467.02 mm Hg/s, 3853.86±416.5 mm Hg/s) were decreased (P<0.001) while LVEDP (4.58±0.41 mm Hg) was increased (P<0.001) in the doxorubicin group compared with the normal group (146.34±14.49 mm Hg, 1.68±0.21 mm Hg, 6754.34±726.55 mm Hg/s, 5763.49±515.2 mm Hg/s) (Figure 2C and 2D). The cardiac systolic and diastolic functions of doxorubicin‐treated rats were improved after injection of BMSC‐Exos (Figure 2C and 2D, LVSP: 125.34±12.49 mm Hg, P=0.0048; ±dp/dt: 5863.82±525.61 mm Hg/s, P=0.0016, 4982.77v516.19 mm Hg/s, P=0.0004; LVEDP: 2.71 ± 0.26 mm Hg, P<0.001). The levels of CK‐MB (1425.31 ± 120.59 U/L), cTnI (1153.49 ± 125.73 pg/mL), and brain natriuretic peptide (42.58 ± 3.44 pg/mL) were increased in the serum of rats in the doxorubicin group compared with the normal group (905.64 ± 84.11 U/L, 412.56 ± 54.88 pg/mL, 13.02 ± 1.26 pg/mL) while these factors were reduced in the exosome group (1123.15 ± 98.13 U/L, 703.61 ± 94.28 pg/mL, 21.21± ± 1.89 pg/mL) compared with the doxorubicin group (Figure 2E, all P<0.001). Furthermore, the expressions of the oxidative stress‐related biomarkers (SOD, GSH‐Px, and malondialdehyde) were detected (Figure 2F, all P<0.001). Compared with the normal group (76.37±6.82 U/mg, 6.12±0.58 U/mg, 1.23±0.1 nmol/mg), the activities of SOD (21.69±2.05 U/mg) and GSH‐Px (2.23±0.21 U/mg) in the left ventricle were attenuated by doxorubicin, which caused the delayed elimination of the excessive free radicals produced by doxorubicin. These free radicals induced lipid peroxidation in the cardiomyocyte membrane and the phospholipid membrane of organelles, during which malondialdehyde (4.03±0.26 nmol/mg) was produced and increased in doxorubicin‐treated rats. The activities of SOD (50.34±3.67 U/mg) and GSH‐Px (4.02±0.38 U/mg) were enhanced and malondialdehyde (2.26±0.19 nmol/mg) was reduced in the exosome group compared with the doxorubicin group. Taken together, BMSC‐Exos reduced doxorubicin‐induced free radicals and ameliorated the toxicity of doxorubicin to antioxidative stress factors in cardiomyocytes.
Figure 2. Bone marrow mesenchymal stem cell‐exosomes ameliorate doxorubicin‐induced myocardial toxicity.
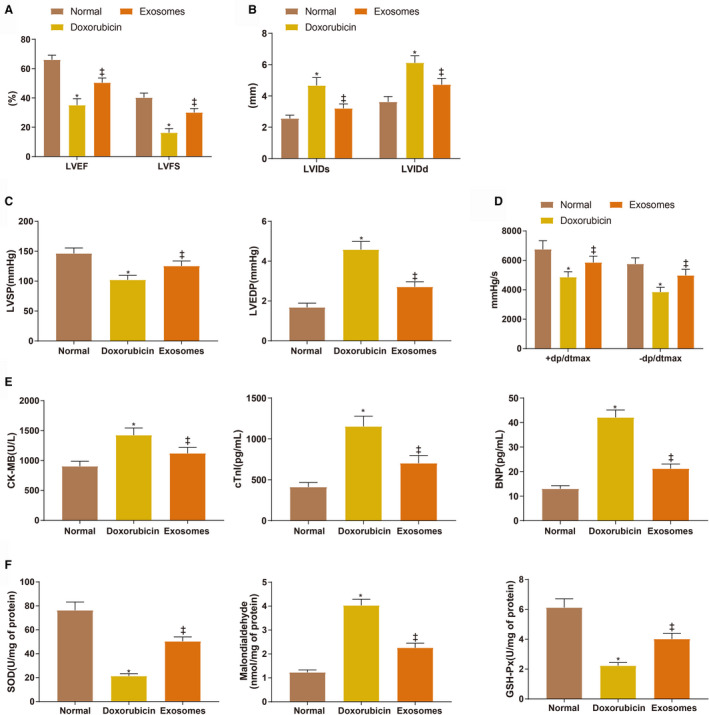
A and B, Echocardiographic assessment of left ventricular ejection fraction/left ventricular fractional shortening and left ventricular internal diameter end‐systolic/left ventricular internal diameter end‐diastolic. C and D, The measurement of left ventricular systolic pressure, left ventricular end‐diastolic pressure, and ±dp/dtmax. E, the serum levels of creatine kinase isoenzyme MB, cardiac troponin I, and brain natriuretic peptide. F, the expressions of superoxide dismutase, malondialdehyde, and glutathione peroxidase. Eight rats for each group. BMSC indicates bone marrow mesenchymal stem cell; BNP, brain natriuretic peptide; CK‐MB, creatine kinase isoenzyme MB; cTnI, cardiac troponin I; GSH‐Px, glutathione peroxidase; LVEDP, left ventricular end‐diastolic pressure, LVSP, left ventricular systolic pressure; and SOD, superoxide dismutase. *P<0.05, compared with the normal group; ‡ P<0.05, compared with the doxorubicin group; data were presented as mean±SD; data were analyzed using 1‐way ANOVA and the Tukey test was applied for post hoc multiple comparisons.
BMSC‐Exos Reduce Doxorubicin‐Induced Inflammatory Responses and Fibrosis in Myocardium
TNF‐α (98.91±10.43 pg/mL), IL‐6 (58.78±4.16 pg/mL), and IL‐1β (28.77±1.98 pg/mL) were increased in the serum of the doxorubicin group compared with the normal group (58.88±7.16 pg/mL, 28.31±2.13 pg/mL, 13.64±1.23 pg/mL) while these inflammatory cytokines were decreased in the exosome group (70.37±9.19 pg/mL, 42.03±3.52 pg/mL, 18.49±1.58 pg/mL) compared with the doxorubicin group (Figure 3A through 3C, all P<0.001). BMSC‐Exos suppressed inflammatory responses caused by doxorubicin‐induced myocardial toxicity. Hematoxylin‐eosin staining revealed the morphology of the myocardium tissues (Figure 3D). The myocardium morphology of the normal group was normal: the cardiac muscle fibers were orderly arranged with clear cross striation; no cell proliferation, atrophy, or inflammatory infiltration was observed; and there were no necrotic or denatured cardiomyocytes. Doxorubicin brought about breakage and absence of cardiac muscle fibers along with myocardial vacuole degeneration and inflammatory infiltration. The effects of doxorubicin were attenuated in the exosome group compared with the doxorubicin group. Masson staining revealed fibrous changes in the myocardium (Figure 3E and 3F). In the normal group, the cardiac muscle fibers were orderly arranged with few collagen fibers distributed in the myocardial interstitium (Figure 3E). The vacuoles were degenerated and large quantities of collagen fibers were stained blue in the doxorubicin group (Figure 3E). The collagen IOD of the doxorubicin group (594631±46310) was higher than that of the normal group (193254±13652) (Figure 3F, P<0.001). The collagen fibers and IOD (312045±26451, P<0.001) were both reduced in the exosome group compared with the doxorubicin group (Figure 3E and 3F). The expression of soluble suppression of tumorigenesis‐2 was consistent with the fibrous changes in the myocardium (Figure 3G, 31.84±7.35ng/mL (normal group) versus 183.74±19.28 ng/mL (doxorubicin group) versus 112.19±10.45 ng/mL (exosome group), P<0.001).
Figure 3. Bone marrow mesenchymal stem cell‐exosomes reduce doxorubicin‐induced inflammatory responses and fibrosis in myocardium.
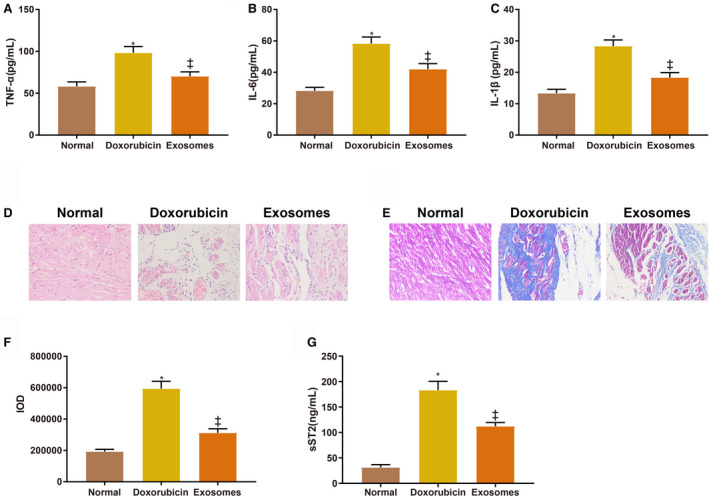
A through C, The levels of tumor necrosis factor‐α, interleukin‐6, and interleukin‐1β in the serum of rats in each group. D, The morphology of the myocardium. E, Fibrous changes in the myocardium. F, Integrated optical density of collagen fibers. G, The expression of soluble suppression of tumorigenesis‐2 in the myocardium. Eight rats in each group. BMSCs indicate bone marrow mesenchymal stem cell; IL‐1β, interleukin‐1β; IL‐6, interleukin‐6; IOD, integrated optical density; sST2, soluble suppression of tumorigenesis‐2; and TNF‐α, tumor necrosis factor‐α. *P<0.05, compared with the normal group; ‡ P<0.05, compared with the doxorubicin group; data were presented as mean±SD; data were analyzed using 1‐way ANOVA and the Tukey test was applied for post hoc multiple comparisons.
miR‐96 Inhibits Doxorubicin‐Induced Myocardial Toxicity
According to the quantitative real time polymerase chain reaction measurement of miR‐96 expression in rat myocardium, miR‐96 was downregulated (0.53 times lower) in the doxorubicin group compared with the normal group while miR‐96 was highly expressed in the exosome group (0.96±0.12) compared with the doxorubicin group (0.53±0.08) (Figure 4A, all P<0.001). After the rats were injected with Exo+miR‐96 mimic or Exo+miR‐96 inhibitor, miR‐96 was upregulated (3.64 times higher) in the myocardium of the Exo+miR‐96 mimic group while downregulated (0.23 times lower) in the Exo+miR‐96 inhibitor group, suggesting successful cell transfection (Figure 4B, P<0.001, compared with the Exo+mimic NC group or Exo+inhibitor NC group).
Figure 4. MicroRNA‐96 reduces doxorubicin‐induced myocardial toxicity.
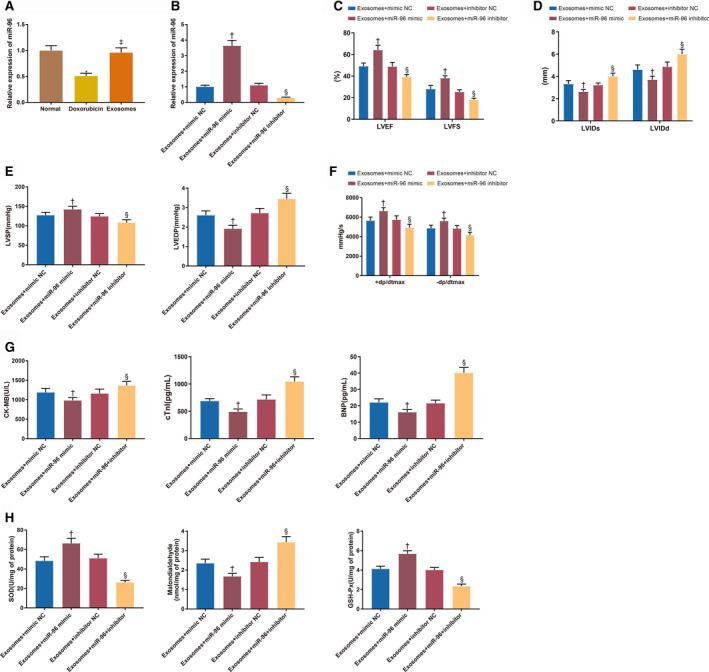
A and B, The expression of microRNA‐96 in the myocardium. C and D, Echocardiographic assessment of left ventricular ejection fraction/left ventricular fractional shortening and left ventricular internal diameter end‐systolic/left ventricular internal diameter end‐diastolic. E and F, The measurement of left ventricular systolic pressure, left ventricular end‐diastolic pressure and±dp/dtmax. G, The serum levels of creatine kinase isoenzyme MB, cardiac troponin I, and brain natriuretic peptide. H, The expressions of superoxide dismutase, malondialdehyde, and glutathione peroxidase; 8 rats for each group. BMSC indicates bone marrow mesenchymal stem cell; BNP, brain natriuretic peptide; CK‐MB, creatine kinase isoenzyme MB; cTnI, cardiac troponin I; Exo+inhibitor, exosome plus inhibitor; Exo+mimic, exosome plus mimic; Exo+miR‐96, exosome plus microRNA‐96; GSH‐Px, glutathione peroxidase; LVEDP, left ventricular end‐diastolic pressure, LVEF, left ventricular ejection fraction; LVFS, left ventricular fractional shortening; LVIDs, left ventricular internal diameter end‐systolic; LVIDd, left ventricular internal diameter end‐diastolic; LVSP, left ventricular systolic pressure; NC, negative control; and SOD, superoxide dismutase. † P<0.05, compared with the exosome+mimic NC group; and § P<0.05, compared with the exosome+inhibitor NC group; data were presented as mean±SD; data were analyzed using 1‐way ANOVA and the Tukey test was applied for post hoc multiple comparisons.
The echocardiographic assessment showed that LVEF (64.15±6.44% versus 49.16±5.84%, P<0.001)/LVFS (38.14±4.59% versus 28.02±4.26%, P<0.001) were increased and LVIDs (2.63±0.28 mm versus 3.32±0.31 mm, P=0.0158)/LVIDd (3.71±0.41 mm versus 4.61±0.49 mm, P=0.0009) were decreased in the Exo+miR‐96 mimic group compared with the Exo+mimic NC group (Figure 4C and 4D). Conversely, LVEF (39.84±4.66% versus 48.52±4.49%, P=0.0025)/LVFS (18.26±2.28% versus 25.28±3.14%, P=0.0220) were decreased and LVIDs (4.01±0.43 mm versus 3.22±0.33 mm, P=0.0044)/LVIDd (5.94±0.64 mm versus 4.80±0.52 mm, P<0.001) were increased in the Exo+miR‐96 inhibitor group compared with the Exo+inhibitor NC group (Figure 4C and 4D). Moreover, LVSP (142.49±8.02 mm Hg versus 127.48±7.85 mm Hg, P=0.0034) and±dp/dt (6634.02±535.02 mm Hg/s versus 5643.87±567.15 mm Hg/s, P=0.0010; 5612.02±491.25 mm Hg/s versus 4863.25±516.34 mm Hg/s, P=0.0205) were increased while LVEDP (1.92±0.17 mm Hg versus 2.61±0.22 mm Hg, P<0.001) was decreased in the Exo+miR‐96 mimic group compared with the Exo+mimic NC group, indicating improvement of the cardiac systolic and diastolic functions in the rats (Figure 4E and 4F). On the contrary, LVSP (108.76±7.86 mm Hg versus 124.67±7.51 mm Hg, P=0.0019) and±dp/dt (4931.52±452.02 mm Hg/s versus 5745.5±594.25 mm Hg/s, P=0.0095; 4163.16±391.02 mm Hg/s versus 4834.25±312.02 mm Hg, P=0.0487) were decreased while LVEDP (3.45±0.28 mm Hg versus 2.72±0.24 mm Hg, P<0.001) was increased in the Exo+miR‐96 inhibitor group compared with the Exo+inhibitor NC group (Figure 4E and 4F). CK‐MB (982.12±72.16 U/L versus 1189.46±102.31 U/L, P=0.0013), cTnI (491.49±50.41 pg/mL versus 689.44±42.12 pg/mL, P<0.001) and brain natriuretic peptide (16.52±1.58 pg/mL versus 22.19±2.13pg/mL, P<0.001) were reduced in the serum of the Exo+miR‐96 mimic group compared with the Exo+mimic NC group (Figure 4G). CK‐MB (1368.15±102.6 U/L versus 1160.31±112.02 U/L, P=0.0012), cTnI (1045.51±86.52 pg/mL versus 716.31±82.81 pg/mL, P<0.001) and brain natriuretic peptide (40.13±3.26 pg/mL versus 21.6±1.88 pg/mL, P<0.001) were increased in the Exo+miR‐96 inhibitor group compared with the Exo+inhibitor NC group (Figure 4G). The expressions of SOD, GSH‐Px, and malondialdehyde in the left ventricle of the rats were also detected (Figure 4H, all P<0.001). SOD (66.43±5.13 U/mg versus 48.34±4.13 U/mg) and GSH‐Px (2.35±0.21 U/mg versus 1.68±0.15 U/mg) activities were enhanced while malondialdehyde production (4.12±0.28 nmol/mg versus 5.68±0.31 nmol/mg) was inhibited in the Exo+miR‐96 mimic group compared with the Exo+mimic NC group. Different expression patterns of SOD (26.31±2.03 U/mg versus 51.06±4.2 U/mg), GSH‐Px (2.42±0.23 U/mg versus 3.43±0.29 U/mg), and malondialdehyde (4.01±0.26 nmol/mg versus 2.35±0.21 nmol/mg) were detected in the Exo+miR‐96 inhibitor group compared with the Exo+inhibitor NC group. From the above, miR‐96 overexpression could reduce free radicals produced by doxorubicin and inhibit the toxicity to antioxidants, thereby ameliorating doxorubicin‐induced myocardial toxicity.
miR‐96 Inhibits Inflammatory Responses and Fibrosis Caused by Doxorubicin‐Induced Myocardial Toxicity
TNF‐α (60.64±6.68 pg/mL versus 73.13±6.26 pg/mL, P=0.0040), IL‐1β (15.33±1.76 pg/mL versus 18.59±1.52 pg/mL, P=0.0072) and IL‐6 (30.12±3.03 pg/mL versus 43.44±4.02 pg/mL, P<0.001) were reduced in the serum of the Exo+miR‐96 mimic group compared with the Exo+mimic NC group (Figure 5A through 5C). TNF‐α (89.55±7.19 pg/mL versus 74.16±6.28 pg/mL, P=0.0004), IL‐1β (22.65±1.86 pg/mL versus 19.32±2.16 pg/mL, P=0.0060), and IL‐6 (55.12±4.68 pg/mL versus 42.06±4.76 pg/mL, P<0.001) were increased in the Exo+miR‐96 inhibitor group compared with the Exo+inhibitor NC group (Figure 5A through 5C). These data suggested that miR‐96 overexpression inhibited the inflammatory responses caused by doxorubicin‐induced myocardial toxicity.
Figure 5. MicroRNA‐96 inhibits inflammatory responses and fibrosis caused by doxorubicin‐induced myocardial toxicity.
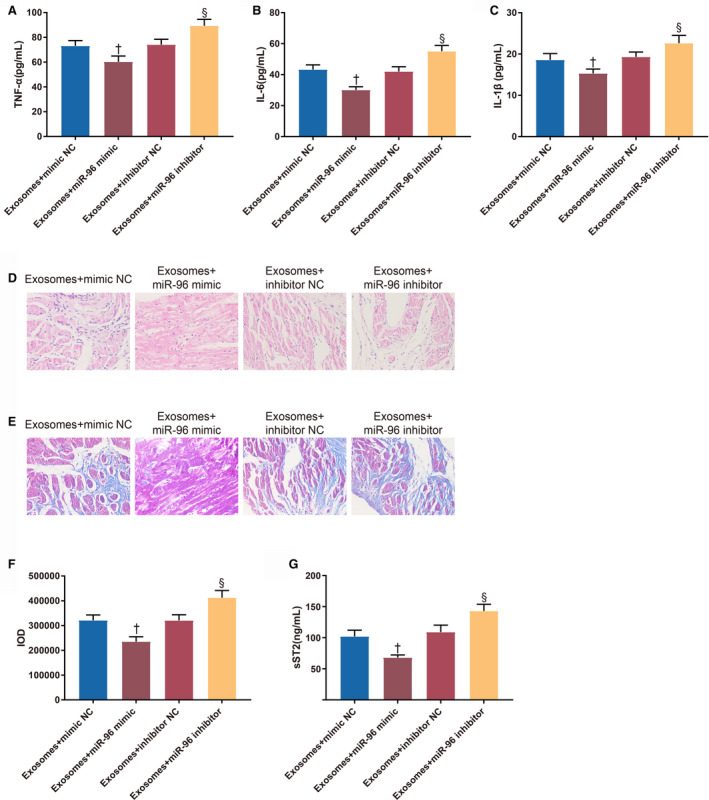
A through C, The serum levels of tumor necrosis factor‐α, interleukin‐6, and interleukin‐1β. D, The morphology of the mouse myocardium. E, Fibrous changes in the myocardium. F, Integrated optical density of collagen fibers. G, The expression of soluble suppression of tumorigenesis‐2 in the myocardium; 8 rats for each group. Exo+inhibitor indicates exosome plus inhibitor; Exo+mimic, exosome plus mimic; Exo+miR‐96, exosome plus microRNA‐96; IL‐1β, interleukin‐1β; IL‐6, interleukin‐6; IOD, integrated optical density; NC, negative control; sST2, soluble suppression of tumorigenesis‐2; and TNF‐α, tumor necrosis factor‐α. † P<0.05, compared with the exosome+mimic NC group; and § P<0.05, compared with the exosome+inhibitor NC group; data were presented as mean±SD; data were analyzed using 1‐way ANOVA and the Tukey test was applied for post hoc multiple comparisons.
The results of hematoxylin‐eosin staining (Figure 5D) showed that there were slight fiber breakage, vacuole degeneration, and inflammatory infiltration in the myocardium of the Exo+mimic NC group and Exo+inhibitor NC group. The fiber breakage, vacuole degeneration, and inflammatory infiltration were further ameliorated in the Exo+miR‐96 mimic group but augmented in the Exo+miR‐96 inhibitor group.
Furthermore, reduction of collagen fibers and collagen IOD (235145±29452 versus 321202±31302, P<0.001) was found in the Exo+miR‐96 mimic group compared with the Exo+mimic NC group; collagen fibers and collagen IOD (412635±38645 versus 320516±33052, P<0.001) were increased in the Exo+miR‐96 inhibitor group compared with the Exo+inhibitor NC group (Figure 5E through 5F). The expression of soluble suppression of tumorigenesis‐2 was consistent with the fibrous changes in the myocardium (Figure 5G, 68.12±4.12 ng/mL (Exo+miR‐96 mimic group) versus 102.12±10.03 ng/mL (Exo+mimic NC group), 143.15±10.55 ng/mL (Exo+miR‐96 inhibitor group) versus 109.12±11.2 ng/mL (Exo+inhibitor NC group), P<0.001).
miR‐96 Suppresses Doxorubicin‐Induced Rac1/NF‐κB Signaling Pathway Activation
The expressions of Rac1 and NF‐κB‐related proteins in the myocardium were measured (Figure 6A through 6C). The expression levels of Rac1 mRNA (2.89±0.26 versus 1±0.09), Rac1 protein (1.23±0.1 versus 0.53±0.06), p‐IKKα (1.76±0.12 versus 1±0.09), p‐IKKβ (1.82±0.13 versus 1±0.08), p‐IκBα (1.89±0.13 versus 1±0.1) and p‐p65 (1.96±0.15 versus 1±0.08) were up‐regulated in the doxorubicin group compared with the normal group (P<0.001); Rac1 mRNA (1.65±0.14), Rac1 protein (0.86±0.07), p‐IKKα (1.34±0.1), p‐IKKβ (1.38±0.12), p‐IκBα (1.38±0.1) and p‐p65 (1.42±0.11) showed different expression patterns in the exosome group compared with the doxorubicin group (P<0.001). Downregulation of Rac1 mRNA (1.12±0.1 versus 1.72±0.13), Rac1 protein (0.6±0.07 versus 0.85±0.08), p‐IKKα (1.09±0.11 versus 1.36±0.11), p‐IKKβ (1.13±0.08 versus 1.41±0.13), p‐IκBα (1.09±0.08 versus 1.4±0.13) and p‐p65 (1.1±0.11 versus 1.39±0.15) was found in the Exo+miR‐96 mimic group compared with the Exo+mimic NC group (P<0.001). Up‐regulation of Rac1 mRNA (2.35±0.21 versus 1.73±0.15), Rac1 protein (1.16±0.1 versus 0.88±0.08), p‐IKKα (1.65±0.15 versus 1.34±0.09), p‐IKKβ (1.73±0.16 versus 1.39±0.13), p‐IκBα (1.75±0.13 versus 1.41±0.11) and p‐p65 (1.78±0.16 versus 1.43±0.12) was detected in the Exo+miR‐96 inhibitor group compared with the Exo+inhibitor NC group (P<0.001). These results indicated that Rac1/NF‐κB signaling pathway activated by doxorubicin can be inhibited by BMSC‐Exos‐loaded miR‐96.
Figure 6. The Rac1/nuclear factor‐κB signaling pathway is activated in the myocardium with doxorubicin‐induced toxicity.
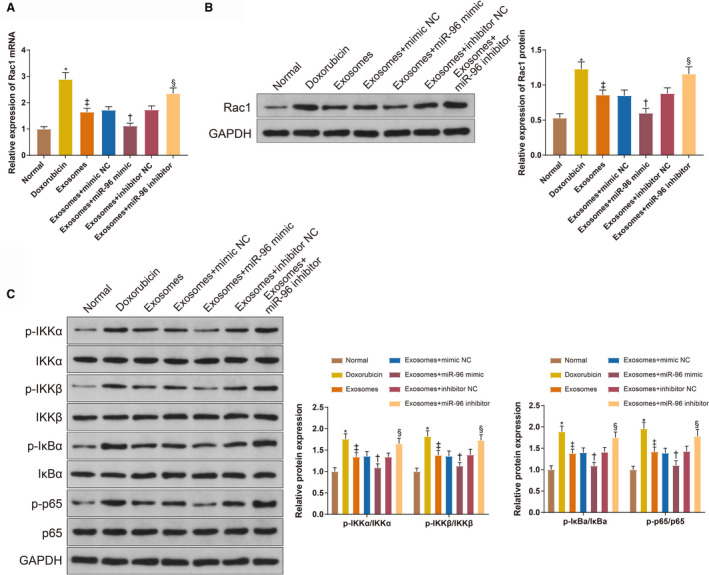
A and B, The expression of Rac1 in the myocardium measured by quantitative real time polymerase chain reaction and Western blotting. C, the levels of p‐IKKα, p‐IKKβ, p‐IκBα, and p‐p65 measured by Western blotting; 8 rats for each group. Exo+inhibitor indicates exosome plus inhibitor; Exo+mimic, exosome plus mimic; Exo+miR‐96, exosome plus microRNA‐96; and negative control (NC). *P<0.05, compared with the normal group; ‡ P<0.05, compared with the doxorubicin group; † P<0.05, compared with the exosome+mimic NC group; and § P<0.05, compared with the exosome+inhibitor NC group; data were presented as mean±SD; data were analyzed using 1‐way ANOVA and the Tukey test was applied for post hoc multiple comparisons.
miR‐96 Derived From BMSC‐Exos Protects H9c2 Cardiomyocytes Against Doxorubicin‐Induced Toxicity by Inhibiting Rac1
Rac1 was downregulated by transfection of Rac1 siRNA to investigate the effect of Rac1 in doxorubicin‐induced H9c2 cell models. According to the results of Cell Counting Kit‐8 assay (Figure 7A), the cell survival was hindered in the doxorubicin group (74.31±3.12% versus 97.43±1.21%, P<0.001, compared with the control group) and promoted in the exosome group (85.83±2.67%, P=0.0002, compared with the doxorubicin group). The survival of doxorubicin‐induced H9c2 cells was improved in the Exo+miR‐96 mimic group (91.15±2.51% versus 84.13±2.49%, P=0.0199, compared with the Exo+mimic NC group) and Exo+miR‐96 inhibitor+Rac1 siRNA group (86.34±1.82% versus 76.46±1.26%, P=0.0006, compared with the Exo+miR‐96 inhibitor+NC siRNA group), while inhibited in the Exo+miR‐96 inhibitor group (76.16±1.96% versus 83.29±2.06%, P=0.0202, compared with the Exo+inhibitor NC group). Furthermore, the levels of myocardial injury indicators (CK‐MB and cTnI) in the cell culture supernatant were assessed (Figure 7B and 7C). CK‐MB (97.59±6.43 U/L versus 31.02±3.86 U/L, P=0.0019) and cTnI (6.35±0.59 μg/L versus 2.13±0.21 μg/L, P<0.001) were increased in the doxorubicin group compared with the control group; the activity of CK‐MB (54.52±5.49 U/L, P<0.001) and cTnI (4.1±0.38 μg/L, P<0.001) was inhibited after exosome treatment compared with the doxorubicin group. CK‐MB (36.35±3.94 U/L versus 55.16±5.25 U/L, P=0.0155) and cTnI (2.35±0.21 μg/L versus 3.98±0.41 μg/L, P=0.0025) were decreased in the Exo+miR‐96 mimic group compared with the Exo+mimic NC group. CK‐MB (82.14±7.05 U/L versus 56.19±5.29 U/L, P=0.0006) and cTnI (6.22±0.51 μg/L versus 4.16±0.45 μg/L, P=0.0002) were increased in the Exo+miR‐96 inhibitor group compared with the Exo+inhibitor NC group. The activity of CK‐MB (52.3±5.28 U/L versus 81.18±7.15 U/L, P=0.0002) and cTnI (4.02±0.26 μg/L versus 5.94±0.41 μg/L, P=0.0004) was inhibited in the Exo+miR‐96 inhibitor+Rac1 siRNA group compared with the Exo+miR‐96 inhibitor+NC siRNA group.
Figure 7. MicroRNA‐96 derived from bone marrow mesenchymal stem cell‐exosomes protects cardiomyocytes against doxorubicin‐induced toxicity by inhibiting Rac1.
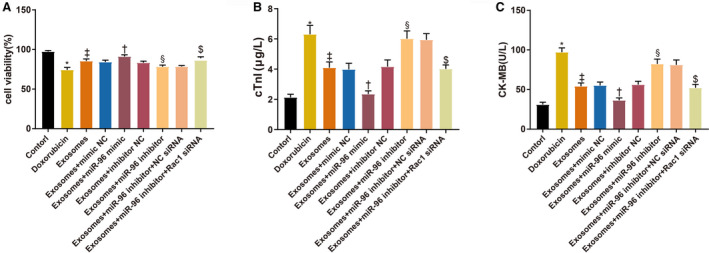
A, The survival rates of H9c2 cells after doxorubicin treatment. B and C, The levels of cardiac troponin I and creatine kinase isoenzyme MB in culture supernatant; n=3. BMSC indicates bone marrow mesenchymal stem cell; CK‐MB, creatine kinase isoenzyme MB; cTnI, cardiac troponin I; Exo+inhibitor, exosome plus inhibitor; Exo+mimic, exosome plus mimic; Exo+miR‐96, exosome plus microRNA‐96; and NC, negative control. *P<0.05, compared with the control group; ‡ P<0.05, compared with the doxorubicin group; † P<0.05, compared with the exosome+mimic NC group; and § P<0.05, compared with the exosome+inhibitor NC group; $ P<0.05, compared with the exosome+miR‐96 inhibitor+NC siRNA group; data were presented as mean±SD; data were analyzed using 1‐way ANOVA and the Tukey test was applied for post hoc multiple comparisons.
miR‐96 Derived From BMSC‐Exos Suppresses Rac1 to Ameliorate Doxorubicin‐Induced Oxidative Stress and Inflammatory Responses in H9c2 Cardiomyocytes
The levels of oxidative stress indicators (SOD, GSH‐Px, and malondialdehyde ) in the culture supernatant of H9c2 cells were measured (Figure 8A through 8C). SOD (75.37±6.15 U/L versus 176.25±14.02 U/L, P<0.001) and GSH‐Px (113.45±10.34 U/L versus 223.02±14.24 U/L, P<0.001) were decreased, and malondialdehyde (12.45±0.94 μmol/L versus 6.4±0.52 μmol/L, P<0.001) was increased in the doxorubicin group compared with the control group. SOD (136.28±10.45 U/L, P<0.001) and GSH‐Px (172.31±13.55 U/L, P=0.0004) were increased, and malondialdehyde (8.94±0.74 μmol/L, P=0.0007) was decreased in the exosome group compared with the doxorubicin group. SOD (168.12±13.52 U/L versus 134.57±9.29 U/L, P=0.0262) and GSH‐Px (210.31±15.2 U/L versus 169.34±11.54 U/L, P=0.0165) were increased, and malondialdehyde (6.69±0.57 μmol/L versus 9.05±0.81 μmol/L, P=0.0295) was decreased in the Exo+miR‐96 mimic group compared with the Exo+mimic NC group. SOD (101.42±8.63 U/L versus 137.11±11.02 U/L, P=0.0159) and GSH‐Px (135.12±9.34 U/L versus 173.54±12 U/L, P=0.0275) were decreased, and malondialdehyde (11.26±0.94 μmol/L versus 8.67±0.71 μmol/L, P=0.014) was increased in the Exo+miR‐96 inhibitor group compared with the Exo+inhibitor NC group. SOD (141.36±12 U/L versus 103.55±9.16 U/L, P=0.0097) and GSH‐Px (176.48±13.22 U/L versus 138.25±10.65 U/L, P=0.0286) were increased, and malondialdehyde (8.25±0.75 μmol/L versus 11.02±0.81 μmol/L, P=0.0077) was decreased in the Exo+miR‐96 inhibitor+Rac1 siRNA group compared with the Exo+miR‐96 inhibitor+NC siRNA group.
Figure 8. MicroRNA‐96 derived from bone marrow mesenchymal stem cell‐exosomes suppresses Rac1 to attenuate doxorubicin‐induced oxidative stress and inflammatory responses of H9c2 cardiomyocytes.
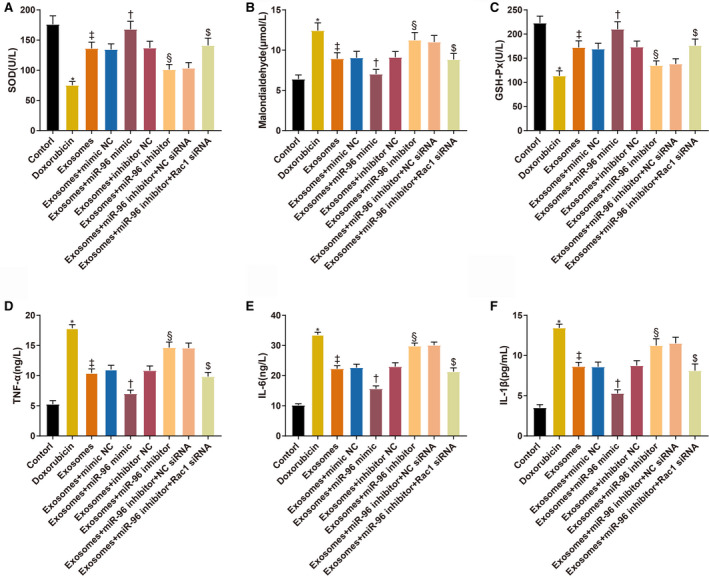
A through C, The levels of superoxide dismutase, malondialdehyde, and glutathione peroxidase in H9c2 cells. D through F, The levels of tumor necrosis factor‐α, interleukin‐6, and interleukin‐1β in H9c2 cells; n=3. Exo+inhibitor indicates exosome plus inhibitor; Exo+mimic, exosome plus mimic; Exo+miR‐96, exosome plus microRNA‐96; GSH‐Px, glutathione peroxidase; IL‐1β, interleukin‐1β; IL‐6, interleukin‐6; NC, negative control; SOD, superoxide dismutase; and TNF‐α, tumor necrosis factor‐α. * P<0.05, compared with the control group; ‡ P<0.05, compared with the doxorubicin group; † P<0.05, compared with the exosome+mimic NC group; and § P<0.05, compared with the exosome+inhibitor NC group; $ P<0.05, compared with the exosome+miR‐96 inhibitor+NC siRNA group; data were presented as mean±SD; data were analyzed using 1‐way ANOVA and the Tukey test was applied for post hoc multiple comparisons.
The expression levels of inflammatory cytokines in the culture supernatant of H9c2 cells were also measured (Figure 8D through 8F). TNF‐α (17.85±0.61 ng/L versus 5.28±0.59 ng/L), IL‐1β (33.58±0.84 ng/L versus 10.23±0.46 ng/L), and IL‐6 (13.45±v0.46 ng/L versus 3.52±0.37 ng/L) were increased in the doxorubicin group compared with the control group (P<0.001). TNF‐α (10.45±0.68 ng/L), IL‐1β (22.31±1.02 ng/L), and IL‐6 (8.64v0.52 ng/L) were decreased after exosome treatment (P<0.001, compared with the doxorubicin group). TNF‐α (7.02±0.58 ng/L versus 11.02±0.71 ng/L), IL‐1β (15.67±0.94 ng/L versus 22.68±1.13 ng/L) and IL‐6 (5.31±0.43 ng/L versus 8.61±0.58 ng/L) were decreased in the Exo+miR‐96 mimic group compared with the Exo+mimic NC group (P<0.001). TNF‐α (14.68±0.89 ng/L versus 10.86±0.74 ng/L), IL‐1β (29.86±0.97 ng/L versus 23.01±1.26 ng/L), and IL‐6 (11.26±0.84 ng/L versus 8.76±0.61 ng/L) were increased in the Exo+miR‐96 inhibitor group compared with the Exo+inhibitor NC group (P<0.001). TNF‐α (9.85±0.69 ng/L versus 14.59±0.82 ng/L), IL‐1β (21.34±1.23 ng/L versus 30.12±1.02 ng/L), and IL‐6 (8.13±0.82 ng/L versus 11.53±0.75 ng/L) were decreased in the Exo+miR‐96 inhibitor+Rac1 siRNA group compared with the Exo+miR‐96 inhibitor+NC siRNA group (P<0.001).
Taken together, miR‐96 derived from BMSC‐Exos suppresses doxorubicin‐induced oxidative stress and inflammatory responses of H9c2 cells by inhibiting Rac1.
Expressions of miR‐96, Rac1, and NF‐κB in Doxorubicin‐Treated H9c2 Cardiomyocytes
Quantitative real time polymerase chain reaction and Western blotting were applied to measure the expressions of miR‐96 (Figure 9A), Rac1 (Figure 9A and 9B), and NF‐κB‐related proteins (Figure 9C). miR‐96 (0.35±0.04 versus 1±0.1, P=0.0002) was downregulated and Rac1 mRNA (3.45±0.32 versus 1±0.11, P<0.001), Rac1 protein (1.06±0.08 versus 0.42±0.05, P<0.001), p‐IKKα (1.98±0.16 versus 1±0.08, P<0.001), p‐IKKβ (2.06±0.17 versus 1±0.1, P<0.001), p‐IκBα (2.13±0.18 versus 1±0.11, P<0.001), and p‐65 (2.15±0.16 versus 1±0.12, P<0.001) were upregulated in the doxorubicin group compared with the control group. Different expression trends of miR‐96 (0.76±0.07, P=0.042), Rac1 mRNA (1.89±0.16, P<0.001), Rac1 protein (0.68±0.07, P<0.001), p‐IKKα (1.43±0.1, P=0.0005), p‐IKKβ (1.52±0.11, P=0.0004), p‐IκBα (1.53±0.12, P<0.001) and p‐65 (1.51±0.11, P<0.001) were observed in the exosome group compared with the doxorubicin group. The expression of miR‐96 (2.53±0.21 versus 0.73±0.06, P<0.001) was elevated, and the expressions of Rac1 mRNA (1.21±0.1 versus 1.94±0.17, P<0.001), Rac1 protein (0.46±0.06 versus 0.71±0.06, P=0.005), p‐IKKα (1.06±0.09 versus 1.49±0.09, P=0.0085), p‐IKKβ (1.13±0.1 versus 1.53±0.12, P=0.0151), p‐IκBα (1.09±0.1 versus 1.51±0.13, P=0.0127), and p‐65 (1.54±0.12 versus 1.13±0.11, P=0.0162) were reduced in the Exo+miR‐96 mimic group compared with the Exo+mimic NC group. The expression of miR‐96 (0.19±0.04 versus 0.78±0.08, P=0.0007) was decreased, and the expressions of Rac1 mRNA (2.78±0.24 versus 1.82±0.16, P<0.001), Rac1 protein (0.95±0.07 versus 0.72±0.07, P=0.0108), p‐IKKα (1.80±0.15 versus 1.45±0.11, P=0.0496), p‐IKKβ (1.94±0.18 versus 1.56±0.16, P=0.0246), p‐IκBα (1.96±0.17 versus 1.56±0.13, P=0.0206) and p‐65 (1.94±0.15 versus 1.53±0.12, P=0.0162) were increased in the Exo+miR‐96 inhibitor group compared with the Exo+inhibitor NC group. Rac1 mRNA (1.78±0.14 versus 2.71±0.21, P<0.001), Rac1 protein (0.65±0.07 versus 0.94±0.06, P=0.0011), p‐IKKα (1.4±0.11 versus 1.78±0.14, P=0.007), p‐IKKβ (1.46±0.13 versus 1.89±0.17, P=0.007), p‐IκBα (1.48±0.11 versus 1.91±0.16, P=0.01) and p‐65 (1.46±0.1 versus 1.89±0.17, P=0.01) were downregulated in the Exo+miR‐96 inhibitor+Rac1 siRNA group compared with the Exo+miR‐96 inhibitor+NC siRNA group. Taken together, miR‐96 and the Rac1/NF‐κB signaling played important regulatory roles in doxorubicin‐induced myocardial toxicity in H9c2 cells.
Figure 9. Expressions of microRNA‐96, Rac1, and nuclear factor‐κB in doxorubicin‐treated H9c2 cardiomyocytes.
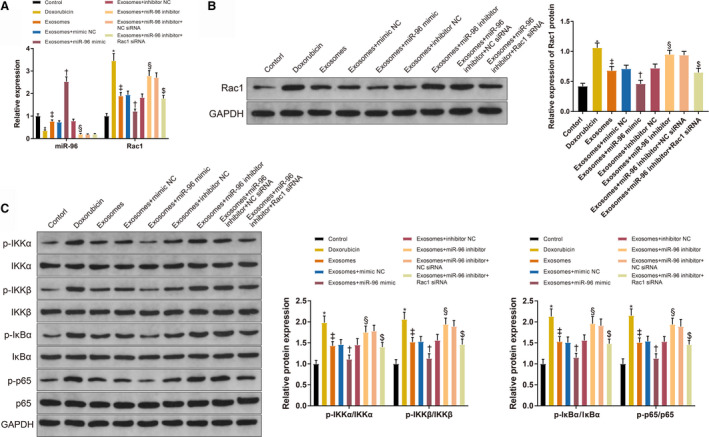
A, The expressions of micorRNA‐96 and Rac1 in H9c2 cells. B, The protein level of Rac1. C, The levels of p‐IKKα, p‐IKKβ, p‐IκBα, and p‐65 in H9c2 cells; n=3. Exo+inhibitor indicates exosome plus inhibitor; Exo+mimic, exosome plus mimic; Exo+miR‐96, exosome plus microRNA‐96; and NC, negative control. *P<0.05, compared with the control group; ‡ P<0.05, compared with the doxorubicin group; † P<0.05, compared with the exosome+mimic NC group; and § P<0.05, compared with the exosome+inhibitor NC group; $ P<0.05, compared with the exosome+miR‐96 inhibitor+NC siRNA group; data were presented as mean±SD; data were analyzed using 1‐way ANOVA and the Tukey test was applied for post hoc multiple comparisons.
Rac1 is a Target Gene of miR‐96
TargetScan predicted that miR‐96 could bind to Rac1 at the 3 prime untranslated region (Figure 10A). The dual‐luciferase reporter assay showed that the relative luciferase activity in H9c2 cells co‐transfected with wild‐type sequences of Rac1 and miR‐96 mimic (0.49±0.05) was lower than that in H9c2 cells co‐transfected with wild‐type sequences of Rac1 and mimic NC (1±0.13) (Figure 10B, P<0.001). The relative luciferase activities in H9c2 cells co‐transfected with mutated sequences of Rac1 and miR‐96 mimic (0.97±0.07) or mutated sequences of Rac1 and mimic NC (1.01±0.08) had no significant differences (Figure 10B, P>0.05).
Figure 10. The binding of microRNA‐96 to Rac1.
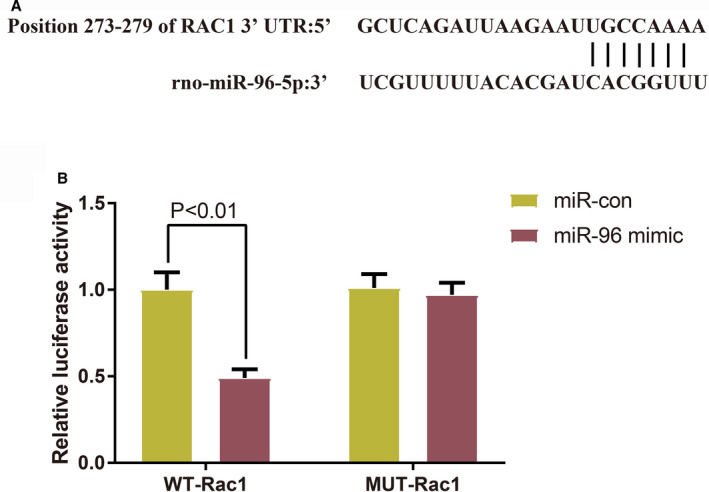
A, TargetScan predicted the sequences of the binding sites between microRNA‐96 and Rac1. B, Dual‐luciferase reporter assay verified the targeting relationship between microRNA‐96 and Rac1 (n=3); data were presented as mean±SD and analyzed by the student t‐test. miR‐96 indicates microRNA‐96; MUT, mutated‐type; NC, negative control; and WT, wild‐type.
Discussion
Doxorubicin is a predominant and effective chemotherapeutic drug used in cancer treatment. The anticancer activity of doxorubicin is dose‐dependent, but increased dosage also confers the risks of cardiomyopathy and heart failure. 17 In addition to cardiotoxicity, doxorubicin can induce lethal toxicity to other organs including brain, liver, and kidney. 18 Reduced doses would hinder the efficacy of doxorubicin and therefore bring about unsatisfactory treatment outcomes. In spite of the efforts to develop drugs that can mitigate the adverse events caused by doxorubicin, there is no consensus about the optimal treatment strategy for doxorubicin‐induced cardiotoxicity. Even dexrazoxane, the only drug proved by the Food and Drug Administration for preventing anthracycline‐induced cardiotoxicity, is administered at the risk of causing secondary malignancies and reducing the efficacy of doxorubicin. 19 Therefore, discovery of low‐risk drugs that can ameliorate doxorubicin‐induced cardiotoxicity is still of significance to the clinical application of doxorubicin. The current study demonstrates that miR‐96 derived from BMSC‐Exos protects the myocardium and cardiomyocytes against doxorubicin‐induced toxicity via the Rac1/NF‐κB signaling pathway.
Firstly, we injected BMSC‐Exos into doxorubicin‐treated rats to investigate the effects of BMSC‐Exos on doxorubicin‐induced myocardial toxicity. BMSC‐Exos improved the cardiac systolic and diastolic functions and reduced cardiac injury in rats injected with doxorubicin. Mechanistically, BMSC‐Exos reduced proinflammatory cytokines (TNF‐α, IL‐1β, and IL‐6) and collagen fibers in the myocardium of doxorubicin‐treated rats. Cardiac inflammation is believed to get involved in doxorubicin‐induced toxicity, evidenced by elevation of proinflammatory cytokines. 20 Different agents, such as enoxaparin, allicin, and tannic acid, have been reported to ameliorate doxorubicin‐induced cardiotoxicity via suppressing inflammation. 21 , 22 , 23 Studies have also discovered fiber disorders in cardiomyocytes under attack from doxorubicin‐induced toxicity. 24 , 25 Consistent with our findings, Mousa et al also detected an increase of collagen fibers in doxorubicin‐treated cardiomyocytes. 26
Considerable evidence has claimed that oxidative stress is the primary mechanism of doxorubicin‐induced cardiotoxicity. Doxorubicin is capable of producing reactive free radicals which are responsible for oxidative damage to cellular DNA and the mitochondria. 27 As mentioned previously, exosomes derived from embryonic stem cells and cardiac progenitor cells also exerted protection against doxorubicin‐induced cardiotoxicity by inhibiting either inflammation or oxidative stress. In addition to the anti‐inflammatory function, BMSC‐Exos repressed oxidative stress in the myocardium by promoting the activities of antioxidant enzymes herein. Moreover, exosomes secreted by macrophage migration inhibitory factor‐preconditioned MSCs could attenuate doxorubicin‐induced cardiac senescence. 28 Collectively, these data indicate greater potential of MSC‐derived exosomes for inhibiting doxorubicin‐induced cardiotoxicity.
miR‐96 was found to be downregulated in the myocardium of doxorubicin‐treated rats while this transcript was upregulated after BMSC‐Exos treatment, suggesting that miR‐96 played an important role in the regulation of doxorubicin‐induced myocardial toxicity. To investigate the molecular mechanism underlying the effects of BMSC‐Exos, we injected the rats with exosomes isolated from BMSCs which were previously transfected with miR‐96 mimic or miR‐96 inhibitor. miR‐96 overexpression improved the cardiac function and attenuated the cardiac injury in doxorubicin‐treated rats with reduced oxidative stress, inflammatory responses, and myocardial fibrosis. miR‐96 knockdown inhibited the protective effects of BMSC‐Exos against doxorubicin‐induced myocardial toxicity. Although no data have demonstrated the suppressive effects of miR‐96 on cardiotoxicity, downregulation of miR‐96 was found in human retinal pigment epithelium cells under oxidative stress. 29 miR‐96 overexpression inhibited inflammation in mouse lung and partially reduced pulmonary fibrosis by inhibiting NLRP3 inflammasome through targeting FOXO3a under exposure to carbon black nanoparticles. 30
Besides the dysregulation of miR‐96 in the myocardium, Rac1, and NF‐κB signaling were found to be upregulated by doxorubicin and downregulated after BMSC‐Exos treatment. More importantly, the expressions of miR‐96 and Rac1/NF‐κB were negatively related. The doxorubicin‐treated H9c2 cardiomyocytes were thereafter transfected with Rac1 siRNA to investigate the function of Rac1 in doxorubicin‐induced cardiotoxicity. Suppressing miR‐96 reduced the cell survival rate and exacerbated the cardiac injury, oxidative stress, and inflammation in H9c2 cells pretreated with doxorubicin. Rac1 knockdown reversed the promotive effects of miR‐96 inhibition on doxorubicin‐induced cardiotoxicity. Based on the TargetScan analysis and dual‐luciferase reporter assay, miR‐96 could bind to the 3 prime untranslated region of Rac1 mRNA. Therefore, miR‐96 ameliorated doxorubicin‐induced myocardial toxicity by directly inhibiting Rac1. Furthermore, proteins related to the NF‐κB signaling (p‐IKKα, p‐IKKβ, p‐IκBα, and p‐65) were decreased when Rac1 was inhibited, suggesting the regulation between Rac1 and NF‐κB signaling pathway. NF‐κB is a master regulator of inflammation and immune homeostasis though its transcriptional control of inflammatory factors, 31 which may explain for the mediation of inflammation by miR‐96/Rac1/NF‐κB. NF‐κB also promotes apoptosis in doxorubicin‐induced cardiotoxicity by activating downstream signaling cascades such as protein kinase C delta and p53 up‐regulated modulator of apoptosis. 32 , 33
The therapeutic potential of BMSC‐Exos for treatment of doxorubicin‐induced cardiotoxicity is well described by explaining the underlying molecular mechanism in this study. Previous studies have reported that statins mitigated doxorubicin‑induced cardiotoxicity via inhibition of Rac1. 34 However, statins have shown great individual differences in terms of the efficacy and safety, which are related to the genes encoding uptake and effluent transporters. 35 Administration of MSC‐derived exosomes may provide considerable advantages over their counterpart live cells such as less undesirable side effects and highly selective delivery of small molecules. 36 Clinical trials can be performed to validate the efficacy of BMSC‐Exos in the next steps.
In summary, collected evidence from rat models and doxorubicin‐induced cardiomyocytes shows that miR‐96 derived from BMSC‐Exos mitigates myocardial injuries caused by doxorubicin‐induced toxicity. miR‐96 exerts cardioprotective effects by inhibiting Rac1 and the downstream NF‐κB signaling. The present study provides theoretical basis for exosome‐based cell‐free medicine for doxorubicin‐induced cardiotoxicity.
Sources of Funding
None.
Disclosures
None.
For Sources of Funding and Disclosures, see page 9.
Contributor Information
Kexin Xia, Email: xiazhi123@hrbmu.edu.cn.
Hui Sun, Email: sunhui1968@tongji.edu.cn.
Jinsong Wang, Email: taowangto2001@hrbmu.edu.cn.
References
- 1. Damiani RM, Moura DJ, Viau CM, Caceres RA, Henriques JAP, Saffi J. Pathways of cardiac toxicity: comparison between chemotherapeutic drugs doxorubicin and mitoxantrone. Arch Toxicol. 2016;90:2063–2076. DOI: 10.1007/s00204-016-1759-y. [DOI] [PubMed] [Google Scholar]
- 2. Vejpongsa P, Yeh ET. Prevention of anthracycline‐induced cardiotoxicity: challenges and opportunities. J Am Coll Cardiol. 2014;64:938–945. DOI: 10.1016/j.jacc.2014.06.1167. [DOI] [PubMed] [Google Scholar]
- 3. Renu K, V.g. A, P.b. TP, Arunachalam S. Molecular mechanism of doxorubicin‐induced cardiomyopathy – an update. Eur J Pharmacol. 2018;818:241–253. DOI: 10.1016/j.ejphar.2017.10.043. [DOI] [PubMed] [Google Scholar]
- 4. Mitry MA, Edwards JG. Doxorubicin induced heart failure: phenotype and molecular mechanisms. Int J Cardiol Heart Vasc. 2016;10:17–24. DOI: 10.1016/j.ijcha.2015.11.004. [DOI] [PMC free article] [PubMed] [Google Scholar]
- 5. Abushouk AI, Salem AMA, Saad A, Afifi AM, Afify AY, Afify H, Salem HSE, Ghanem E, Abdel‐Daim MM. Mesenchymal stem cell therapy for doxorubicin‐induced cardiomyopathy: potential mechanisms, governing factors, and implications of the heart stem cell debate. Front Pharmacol. 2019;10:635. DOI: 10.3389/fphar.2019.00635. [DOI] [PMC free article] [PubMed] [Google Scholar]
- 6. Phinney DG, Pittenger MF. Concise review: MSC‐derived exosomes for cell‐free therapy. Stem Cells. 2017;35:851–858. DOI: 10.1002/stem.2575. [DOI] [PubMed] [Google Scholar]
- 7. Milano G, Biemmi V, Lazzarini E, Balbi C, Ciullo A, Bolis S, Ameri P, Di Silvestre D, Mauri P, Barile L, et al. Intravenous administration of cardiac progenitor cell‐derived exosomes protects against doxorubicin/trastuzumab‐induced cardiac toxicity. Cardiovasc Res. 2020;116:383–392. DOI: 10.1093/cvr/cvz108. [DOI] [PubMed] [Google Scholar]
- 8. Tavakoli Dargani Z, Singla DK. Embryonic stem cell‐derived exosomes inhibit doxorubicin‐induced TLR4‐NLRP3‐mediated cell death‐pyroptosis. Am J Physiol Heart Circ Physiol. 2019;317:H460–H471. DOI: 10.1152/ajpheart.00056.2019. [DOI] [PMC free article] [PubMed] [Google Scholar]
- 9. Barile L, Vassalli G. Exosomes: therapy delivery tools and biomarkers of diseases. Pharmacol Ther. 2017;174:63–78. DOI: 10.1016/j.pharmthera.2017.02.020. [DOI] [PubMed] [Google Scholar]
- 10. Li J, Tan S, Kooger R, Zhang C, Zhang Y. Micrornas as novel biological targets for detection and regulation. Chem Soc Rev. 2014;43:506–517. DOI: 10.1039/C3CS60312A. [DOI] [PubMed] [Google Scholar]
- 11. Wang Y, Zou L, Wu T, Xiong L, Zhang T, Kong L, Xue Y, Tang M. Identification of mRNA‐miRNA crosstalk in human endothelial cells after exposure of PM2.5 through integrative transcriptome analysis. Ecotoxicol Environ Saf. 2019;169:863–873. DOI: 10.1016/j.ecoenv.2018.11.114. [DOI] [PubMed] [Google Scholar]
- 12. Nagase M, Fujita T. Role of Rac1‐mineralocorticoid‐receptor signalling in renal and cardiac disease. Nat Rev Nephrol. 2013;9:86–98. DOI: 10.1038/nrneph.2012.282. [DOI] [PubMed] [Google Scholar]
- 13. Yoshida M, Shiojima I, Ikeda H, Komuro I. Chronic doxorubicin cardiotoxicity is mediated by oxidative DNA damage‐ATM‐p53‐apoptosis pathway and attenuated by pitavastatin through the inhibition of Rac1 activity. J Mol Cell Cardiol. 2009;47:698–705. DOI: 10.1016/j.yjmcc.2009.07.024. [DOI] [PubMed] [Google Scholar]
- 14. Palfi A, Hokamp K, Hauck SM, Vencken S, Millington‐Ward S, Chadderton N, Carrigan M, Kortvely E, Greene CM, Kenna PF, et al. Microrna regulatory circuits in a mouse model of inherited retinal degeneration. Sci Rep. 2016;6:31431. DOI: 10.1038/srep31431. [DOI] [PMC free article] [PubMed] [Google Scholar]
- 15. Gao S, Mo J, Chen L, Wang Y, Mao X, Shi Y, Zhang X, Yu R, Zhou X. Astrocyte GGTI‐mediated Rac1 prenylation upregulates NF‐kappab expression and promotes neuronal apoptosis following hypoxia/ischemia. Neuropharmacology. 2016;103:44–56. DOI: 10.1016/j.neuropharm.2015.12.002. [DOI] [PubMed] [Google Scholar]
- 16. Liu T, Zhang L, Joo D, Sun SC. NF‐κB signaling in inflammation. Sig Transduct Target Ther. 2017;2:17023. DOI: 10.1038/sigtrans.2017.23. [DOI] [PMC free article] [PubMed] [Google Scholar]
- 17. QuanJun Y, GenJin Y, LiLi W, YongLong H, Yan H, Jie L, JinLu H, Jin L, Run G, Cheng G. Protective effects of dexrazoxane against doxorubicin‐induced cardiotoxicity: a metabolomic study. PLoS One. 2017;12:e0169567. DOI: 10.1371/journal.pone.0169567. [DOI] [PMC free article] [PubMed] [Google Scholar]
- 18. Tacar O, Sriamornsak P, Dass CR. Doxorubicin: an update on anticancer molecular action, toxicity and novel drug delivery systems. J Pharm Pharmacol. 2013;65:157–170. DOI: 10.1111/j.2042-7158.2012.01567.x. [DOI] [PubMed] [Google Scholar]
- 19. Bansal N, Adams MJ, Ganatra S, Colan SD, Aggarwal S, Steiner R, Amdani S, Lipshultz ER, Lipshultz SE. Strategies to prevent anthracycline‐induced cardiotoxicity in cancer survivors. Cardiooncology. 2019;5:18. DOI: 10.1186/s40959-019-0054-5. [DOI] [PMC free article] [PubMed] [Google Scholar]
- 20. Pecoraro M, Del Pizzo M, Marzocco S, Sorrentino R, Ciccarelli M, Iaccarino G, Pinto A, Popolo A. Inflammatory mediators in a short‐time mouse model of doxorubicin‐induced cardiotoxicity. Toxicol Appl Pharmacol. 2016;293:44–52. DOI: 10.1016/j.taap.2016.01.006. [DOI] [PubMed] [Google Scholar]
- 21. Abdel‐Daim MM, Kilany OE, Khalifa HA, Ahmed AAM. Allicin ameliorates doxorubicin‐induced cardiotoxicity in rats via suppression of oxidative stress, inflammation and apoptosis. Cancer Chemother Pharmacol. 2017;80:745–753. DOI: 10.1007/s00280-017-3413-7. [DOI] [PubMed] [Google Scholar]
- 22. Shaker RA, Abboud SH, Assad HC, Hadi N. Enoxaparin attenuates doxorubicin induced cardiotoxicity in rats via interfering with oxidative stress, inflammation and apoptosis. BMC Pharmacol Toxicol. 2018;19:3. DOI: 10.1186/s40360-017-0184-z. [DOI] [PMC free article] [PubMed] [Google Scholar]
- 23. Zhang J, Cui L, Han X, Zhang Y, Zhang X, Chu X, Zhang F, Zhang Y, Chu L. Protective effects of tannic acid on acute doxorubicin‐induced cardiotoxicity: Involvement of suppression in oxidative stress, inflammation, and apoptosis. Biomed Pharmacother. 2017;93:1253–1260. DOI: 10.1016/j.biopha.2017.07.051. [DOI] [PubMed] [Google Scholar]
- 24. Petroni K, Trinei M, Fornari M, Calvenzani V, Marinelli A, Micheli LA, Pilu R, Matros A, Mock H‐P, Tonelli C, et al. Dietary cyanidin 3‐glucoside from purple corn ameliorates doxorubicin‐induced cardiotoxicity in mice. Nutr Metab Cardiovasc Dis. 2017;27:462–469. DOI: 10.1016/j.numecd.2017.02.002. [DOI] [PubMed] [Google Scholar]
- 25. Yang NA, Ma H, Jiang Z, Niu L, Zhang X, Liu Y, Wang Y, Cheng S, Deng Y, Qi H, et al. Dosing depending on SIRT3 activity attenuates doxorubicin‐induced cardiotoxicity via elevated tolerance against mitochondrial dysfunction and oxidative stress. Biochem Biophys Res Commun. 2019;517:111–117. DOI: 10.1016/j.bbrc.2019.07.029. [DOI] [PubMed] [Google Scholar]
- 26. Mousa HSE, Abdel Aal SM, Abbas NAT. Umbilical cord blood‐mesenchymal stem cells and carvedilol reduce doxorubicin‐ induced cardiotoxicity: possible role of insulin‐like growth factor‐1. Biomed Pharmacother. 2018;105:1192–1204. DOI: 10.1016/j.biopha.2018.06.051. [DOI] [PubMed] [Google Scholar]
- 27. Meredith AM, Dass CR. Increasing role of the cancer chemotherapeutic doxorubicin in cellular metabolism. J Pharm Pharmacol. 2016;68:729–741. DOI: 10.1111/jphp.12539. [DOI] [PubMed] [Google Scholar]
- 28. Zhuang L, Xia W, Chen D, Ye Y, Hu T, Li S, Hou M. Exosomal LncRNA‐NEAT1 derived from MIF‐treated mesenchymal stem cells protected against doxorubicin‐induced cardiac senescence through sponging miR‐221‐3p. J Nanobiotechnology. 2020;18:157. DOI: 10.1186/s12951-020-00716-0. [DOI] [PMC free article] [PubMed] [Google Scholar]
- 29. Ayaz L, Dinc E. Evaluation of microRNA responses in ARPE‐19 cells against the oxidative stress. Cutan Ocul Toxicol. 2018;37:121–126. DOI: 10.1080/15569527.2017.1355314. [DOI] [PubMed] [Google Scholar]
- 30. Zhou L, Li P, Zhang M, Han B, Chu C, Su X, Li B, Kang H, Ning J, Zhang B, et al. Carbon black nanoparticles induce pulmonary fibrosis through NLRP3 inflammasome pathway modulated by miR‐96 targeted FOXO3a. Chemosphere. 2020;241:125075. DOI: 10.1016/j.chemosphere.2019.125075. [DOI] [PubMed] [Google Scholar]
- 31. Mitchell JP, Carmody RJ. Nf‐kappab and the transcriptional control of inflammation. Int Rev Cell Mol Biol. 2018;335:41–84. DOI: 10.1016/bs.ircmb.2017.07.007. [DOI] [PubMed] [Google Scholar]
- 32. Sahu R, Dua TK, Das S, De Feo V, Dewanjee S. Wheat phenolics suppress doxorubicin‐induced cardiotoxicity via inhibition of oxidative stress, MAP kinase activation, NF‐kappab pathway, PI3k/Akt/mTOR impairment, and cardiac apoptosis. Food Chem Toxicol. 2019;125:503–519. DOI: 10.1016/j.fct.2019.01.034. [DOI] [PubMed] [Google Scholar]
- 33. Zhang DX, Ma DY, Yao ZQ, Fu CY, Shi YX, Wang QL, Tang QQ. ERK1/2/p53 and NF‐kappab dependent‐puma activation involves in doxorubicin‐induced cardiomyocyte apoptosis. Eur Rev Med Pharmacol Sci. 2016;20:2435–2442. [PubMed] [Google Scholar]
- 34. Ohlig J, Henninger C, Zander S, Merx M, Kelm M, Fritz G. Rac1‐mediated cardiac damage causes diastolic dysfunction in a mouse model of subacute doxorubicin‐induced cardiotoxicity. Arch Toxicol. 2018;92:441–453. DOI: 10.1007/s00204-017-2017-7. [DOI] [PubMed] [Google Scholar]
- 35. Guan ZW, Wu KR, Li R, Yin Y, Li XL, Zhang SF, Li Y. Pharmacogenetics of statins treatment: efficacy and safety. J Clin Pharm Ther. 2019;44:858–867. DOI: 10.1111/jcpt.13025. [DOI] [PubMed] [Google Scholar]
- 36. Mendt M, Rezvani K, Shpall E. Mesenchymal stem cell‐derived exosomes for clinical use. Bone Marrow Transplant. 2019;54:789–792. DOI: 10.1038/s41409-019-0616-z. [DOI] [PubMed] [Google Scholar]


