Abstract
Background
A deeper understanding of the pathogenesis of severe aplastic anemia (SAA) is urgently warranted to achieve better therapeutic effects. The objective of this study was to investigate the phagocytosis of myeloid dendritic cell (mDC) in SAA patients.
Methods
Myeloid dendritic cells were induced in vitro from bone marrow mononuclear cells from 26 SAA patients and 12 normal controls (HCs). The phagocytosis of mDCs was detected by flow cytometry using FITC‐Dextran (40KD), and its correlation with the immune status and severity of the disease was analyzed.
Results
The phagocytosis of mDC from untreated SAA patients was significantly stronger than that from complete remission group and HC group (p < 0.05). There was no statistical difference between the latter two groups (p > 0.05). The phagocytosis of mDC from SAA patients correlated positively with the concentration of interleukin (IL)‐2 (r = 0.389, p < 0.05), and IL‐4 (r = 0.556, p < 0.05), negatively with CD4+/CD8+ ratio (r = −0.421, p < 0.05). It also had negative correlations with the level of hemoglobin (r = −0.393, p < 0.05), white blood cell (r = −0.436, p < 0.05), platelet (r = −0.431, p < 0.05), and reticulocyte (r = −0.447, p < 0.05). The phagocytosis of mDC does not correlate with the response to IST.
Conclusions
The increased phagocytosis of mDC in untreated SAA patients may contribute to abnormal activation of T helper (Th) and subsequent cytotoxic T lymphocyte (CTL) activation in these patients. It may be involved in the immune pathogenesis of SAA.
Keywords: aplastic anemia, cytotoxic T lymphocyte, mDC, phagocytosis, T helper
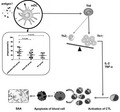
Under the stimulation of antigenic or other factors, the phagocytosis of myeloid dendritic cells in newly diagnosed SAA patients was enhanced, which facilitates the polarization of Th0 to Th1, the activation of CTL, and finally the apoptosis of hematopoietic cells.
1. INTRODUCTION
Severe aplastic anemia (SAA) is a bone marrow failure disease caused by the hyperfunction of cytotoxic T lymphocytes (CTLs). Studies at home and abroad mainly suggest that the abnormally activated myeloid dendritic cells (mDCs) in SAA patients lead to the polarization of T helper (Th)0 to Th1, the imbalance of Th1/Th2, and the secretion of large amounts of Th1‐type cytokines, such as IL‐2, interferon (IFN)‐γ, and tumor necrosis factor (TNF)‐α. These cytokines activate CTLs to damage hematopoietic cells in bone marrow, resulting in pancytopenia, with clinical manifestations of anemia, infection, and hemorrhage. 1
Previous studies on mDCs in SAA patients have shown that the number of mDC increases, the expression of co‐stimulatory molecule CD86 on mDC increases, 2 and the ability of mDC to activate CTLs is enhanced, 3 while the phagocytosis of mDC is rarely studied.
In this study, we detected the phagocytosis of mDC in SAA patients and healthy controls (HCs), trying to reach a deeper understanding of SAA pathogenesis by exploring more characteristics of mDC.
2. MATERIALS AND METHODS
2.1. Subjects
A total of 26 SAA patients diagnosed in the Hematology Department of Tianjin Medical University General Hospital were enrolled from January 2020 to April 2021. The diagnosis of SAA was compliant with 2009 International AA Study Group Criteria. 4 These patients were further categorized as untreated SAA patients and SAA‐complete remission (CR) patients. In the untreated SAA group, there were 14 cases including 10 males and 4 females (median age 59, range 11–86). In the SAA‐CR group, there were 12 cases including 9 males and 3 females (median age 23.5, range 11–64). All CR patients had received immunosuppressive therapy (IST), which included antithymocyte immunoglobulin (ATG), cyclosporine (CsA), and eltrombopag. In the HC group, there were 12 cases including 5 males and 7 females (median age 38, range 17–65). There was no significant difference in gender and age composition among the three groups (p > 0.05).
The study was approved by the Ethics Committee of Tianjin Medical University. The experiments were performed in accordance with relevant institutional and national guidelines and regulations. Informed written consent was obtained from all patients or their guardians in accordance with the Declaration of Helsinki.
2.2. In vitro culture and sorting of myeloid dendritic cells
Bone marrow samples from all subjects were collected in heparin anticoagulant tubes. Samples from untreated SAA patients were acquired at the time of diagnosis. Their bone marrow mononuclear cells (BMMNCs) were isolated by density gradient centrifugation using Ficoll‐Paque PLUS solution (Amersham Biosciences) and then placed in culture medium (containing 79% RPMI 1640 [GIBCO BRL], 20% fetal bovine serum [GIBCO BRL], and 1% penicillin‐streptomycin [HyClone]) at a cell concentration of 1.5 × 10⁶/ml. After standing for 2 h, the suspended cells were discarded and the remaining semi‐adherent cells were cultured in medium containing 100 ng/ml rhGM‐CSF (North China Pharmaceutical Co.) and 25 ng/ml rhIL‐4 (PeproTech), at 37℃ with 5% CO2. Change the medium and add the above two cytokines every 2 days. On day 6, 1000 U/ml rhTNF‐α (PeproTech) was added to induce mDC maturation. On day 7, the suspended cells were collected, labeled with APC‐CD11c (BD Pharmingen) and PerCP‐HLA‐DR (BD Pharmingen), and sorted using a FACSAria flow cytometer (BD Biosciences). The purity of the mDCs was measured and quantified as the percentage of CD11c+HLA‐DR+ cells in all sorted cells.
2.3. Phagocytosis detection
FITC‐Dextran (40KD) (Sigma‐Aldrich) was diluted to 10 mg/ml in PBS and stored at −20℃ in the dark after aliquoting. When used, the reaction concentration is 1 mg/ml. The sorted mDC was counted, and the cell concentration was adjusted to 2.5 × 10⁵/ml with culture medium. A 400 μl cell suspension was divided into two EP tubes equally, and 22 μl FITC‐Dextran stock solution was added into each tube. The experimental tube was placed in a 37°C incubator with 5% CO2, and the control tube was placed in a 4℃ refrigerator. Both were incubated for 2 h. Then, the cells were washed twice with 4℃ PBS to remove residual FITC‐Dextran. APC‐CD11c and PerCP‐HLA‐DR were used to stain and identify mDC. Finally, the cells were subjected to flow cytometry and the percentage of dextran‐positive cells in CD11c+HLA‐DR+ cells at 4℃ and 37℃ were determined, respectively. Since both active phagocytosis and non‐specific binding between mDC and FITC‐Dextran occurred at 37℃, and only non‐specific binding occurred at 4℃, phagocytosis was quantified as the FITC‐positive rate in the 37℃ experimental group minus the positive rate of FITC in the 4 °C control group, thereby excluding non‐specific binding.
2.4. Flow cytometric analysis of immune status
Peripheral blood samples were collected in heparin anticoagulant tubes. APC‐CD3, PE‐CD4, and FITC‐CD8 (BD Pharmingen) were used to label T‐cell subtypes. Isotype controls were all from BD Pharmingen.
Concentrations of cytokines were measured using Human Th1/Th2 Assay Kit (Celgene Biotech). Plasma was obtained by centrifugation of peripheral blood sample at 300 g for 5 min. By combining the microspheres with pe‐labeled fluorescence detection reagent, different fluorescence intensities are generated by different concentrations of cytokines to be detected, including Th1‐type cytokines IL‐2, TNF‐α, IFN‐γ, and Th2‐type cytokines IL‐4, IL‐6, and IL‐10. Data acquisition was performed on a FACSCalibur, and acquired data were analyzed using the CellQuest 3.1 software (Becton Dickinson).
2.5. Statistical analysis
SPSS 21.0 statistical analysis software was used for data analysis. The results were expressed as mean ± standard deviations. All data were normally distributed. Statistical analysis was performed using one‐way ANOVA for comparison among groups. T test was used for comparison between two groups. Spearman's test was used to assess the linear correlation of the data. A value of p < 0.05 was considered to be statistically significant.
3. RESULTS
3.1. In vitro culture of mDCs and the purity of sorted mDCs
The mDC harvested after 7 days of culture showed typical morphology, with varying cell size, irregular cell morphology, and many dendritic protrusions with different lengths, thicknesses, and densities on the cell surface (Figure 1A). There was no significant difference in the morphology of dendritic cells among each group. As measured by flow cytometry, the percentage of CD11c+HLA‐DR+ mDCs in all cultured cells reached 50%–70%. After sorting by flow cytometer, the purity of mDCs reached above 90% (Figure 1B).
FIGURE 1.
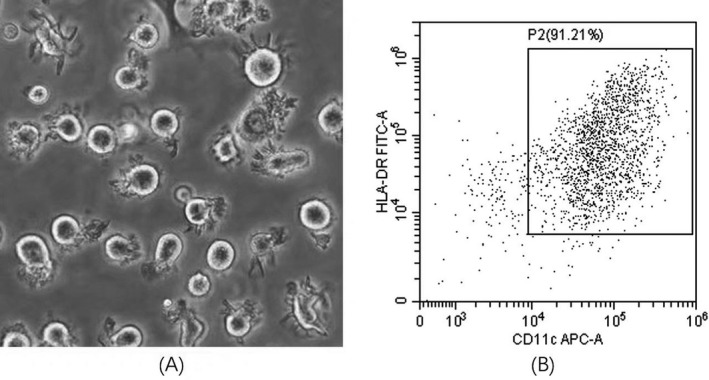
(A) The morphology of myeloid dendritic cells (mDCs) induced in vitro from bone marrow mononuclear cells of untreated severe aplastic anemia patients (400×). (B) The purity of mDCs after sorting by flow cytometry reached >90%
3.2. The phagocytosis of mDC increased in untreated SAA patients, while it does not serve as a prognostic factor
As shown in Figure 2, the phagocytosis of mDC from the untreated SAA group ([36.45 ± 19.01] %) was significantly stronger than that from the healthy control group ([18.63 ± 10.21] %, p < 0.05) and the SAA‐CR group ([21.12 ± 13.66] %, p < 0.05), while there was no difference between the latter two groups (p > 0.05).
FIGURE 2.
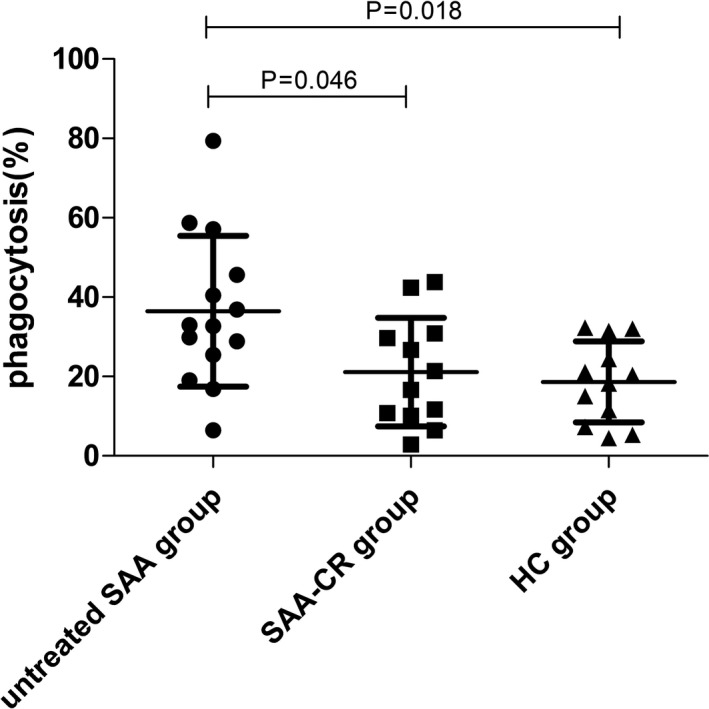
The phagocytosis of myeloid dendritic cells (mDCs) from untreated SAA patients was stronger than that from the SAA‐CR group patients and healthy controls
The phagocytosis of mDC was also analyzed serially for SAA patients who reached CR after IST and patients who did not respond to IST. There was no difference in the phagocytosis of mDC between the CR group and non‐response group when measured before IST ([52.35 ± 30.68] % vs. [34.13 ± 16.79] %, p > 0.05). After IST, there was an increase in the phagocytosis of mDC in the SAA‐CR group and a decrease in the non‐response group (Figure 3). At the time point of efficacy evaluation, the phagocytosis of mDC from the SAA‐CR group was weaker than that from the non‐response group ([19.23 ± 10.62] % vs. [56.99 ± 21.04] %, p < 0.05).
FIGURE 3.
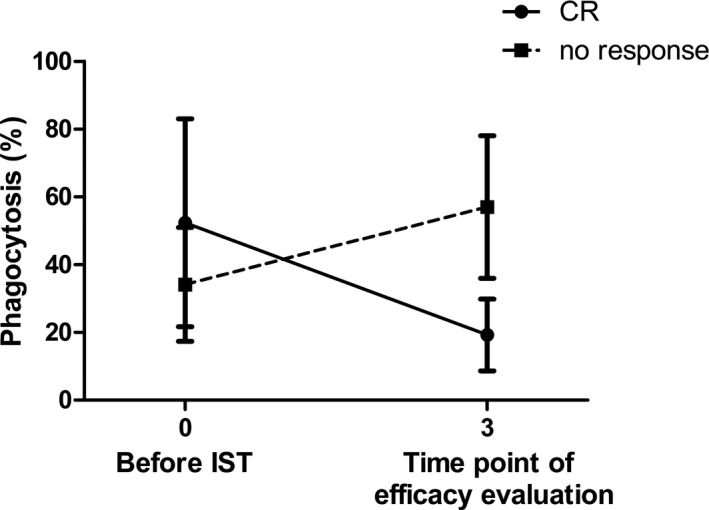
The serial changes in the phagocytosis of myeloid dendritic cells in the SAA‐CR group and non‐response group
3.3. The immune status of SAA patients
As shown in Figure 4, the concentration of IL‐2 and TNF‐α increased significantly in the untreated SAA group compared with the healthy control group (p < 0.05), and the concentration of IL‐2 decreased dramatically in the SAA‐CR group after IST (p < 0.05). The concentration of IFN‐γ was not statistically different among the three groups. The concentration of Th2‐type cytokines (IL‐4, IL‐6, IL‐10) increased slightly in untreated SAA patients, but there was no statistical difference among the groups.
FIGURE 4.
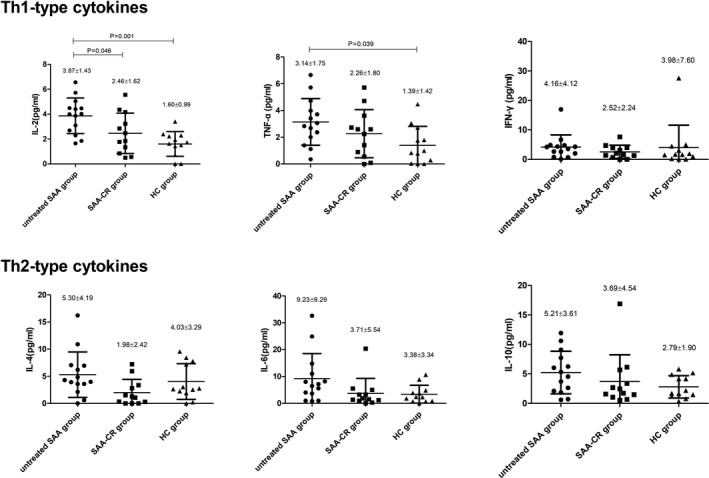
The concentrations of Th1‐type cytokines, including interleukin (IL)‐2 and tumor necrosis factor (TNF)‐α, in plasma of untreated SAA patients were higher than those in the SAA‐CR group patients and healthy controls
The CD4+/CD8+ ratio in the untreated SAA group (1.05 ± 0.78) was significantly lower than that in the healthy control group and the SAA‐CR group (2.34 ± 1.44 and 2.36 ± 1.31, respectively, p < 0.05). There was no statistical difference in the CD4+/CD8+ ratio between the healthy control group and the SAA‐CR group.
3.4. The phagocytosis of mDC in SAA patients correlated with their immune and clinical indicators
In all SAA patients, the phagocytosis of mDC was positively correlated with the concentration of IL‐2 (r = 0.389, p < 0.05) and IL‐4 (r = 0.556, p < 0.05). There was a negative correlation between the phagocytosis of mDC and the CD4+/CD8+ ratio (r = −0.421, p < 0.05). (Figure 5A).
FIGURE 5.
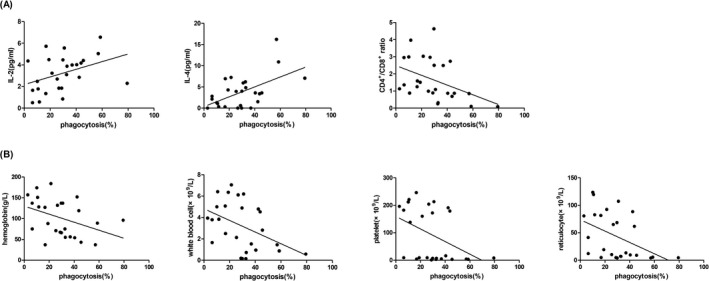
The phagocytosis of mDC in SAA patients was positively correlated with IL‐2, IL‐4 levels, and negatively correlated with CD4+/CD8+ ratio, the counts of hemoglobin, white blood cell, platelet, and reticulocyte
In all SAA patients, the phagocytosis of mDC correlated negatively with the level of hemoglobin (r = −0.393, p < 0.05), white blood cell (r = −0.436, p < 0.05), platelet (r = −0.431, p < 0.05), and reticulocyte (r = −0.447, p < 0.05). (Figure 5B).
4. DISCUSSION
Previous studies on the pathogenesis of SAA have extended upstream to the activation of mDC, but the etiologic trigger for mDC is still not clear. Some cases of SAA onset or relapse after virus infection or vaccination, 5 which make many scholars believe that antigen stimulation may be the cause of mDC activation and the resulting immune response. FR Schuster, et al. 6 preformed a spectratype analysis of TCR V‐beta pattern for bone marrow lymphocytes in SAA patients, which showed that CTL expanded with oligoclonal characteristics, and IST treatment can restore the diversity of TCR, suggesting that CTL expansion in patients with SAA is mediated by antigen. Oligoclonal characteristics were also observed in Th1 and effector memory cells in SAA patients, 7 , 8 which support the antigen‐driven T‐cell activation mechanism. Extensive investigations have been performed to search for SAA prime antigens. Glycosylphosphatidylinositol (GPI), 9 , 10 chloride intracellular channel (CLIC) 1, heat‐shock protein β (HSPB) 11, ribosomal protein (RP) S27, 11 and others may be involved, but there is no conclusion yet.
Dendritic cell is the most important antigen‐presenting cell, and its biological function is to take up, process, and present antigens in various immune responses. Cell phagocytosis plays a critical role in this procedure. In this study, we performed phagocytosis assay of mDC from SAA patients and HCs to evaluate their active antigen uptake capacity. We found that the phagocytic index of mDC from untreated SAA patients increased significantly than that from healthy controls, and in the SAA‐CR group, it could be successfully inhibited by IST. These data indicated a higher antigen uptake capacity of mDC from untreated SAA patients, which verified the hypothesis that the onset of SAA stemmed from antigen stimulation. However, the phagocytosis of mDC from newly diagnosed SAA patients does not predict their outcomes.
Then, we tried to find out the association between phagocytosis of mDC in SAA patients and their abnormally activated immune response. In our results, Th1‐type cytokines IL‐2 and TNF‐α were significantly increased in the untreated SAA group, which was consistent with the previous research results. 12 , 13 Although Th2‐type cytokines (IL‐4, IL‐6, and IL‐10) were slightly elevated, there was no statistical difference between the three groups. These data indicated that mDC stimulated the differentiation of naive CD4+ T cells toward both Th1 and Th2 directions, but the polarization in the direction of Th1 is more significant, causing the ratio of Th1/Th2 to be skewed in favor of Th1. We also found that the phagocytosis of mDC correlated well with the concentration of IL‐2 and IL‐4, suggesting that the increased phagocytosis of mDC pushed Th0 differentiation and contribute to the Th1 response. It is well known that CD8+ T lymphocytes, also called CTL, play a critical role in the pathogenesis of SAA. 14 The phagocytosis of mDC in SAA patients also correlated with CD4+/CD8+ ratio, indicating that the enhanced phagocytosis of mDC was relevant to the activation of CD8+T lymphocytes. We surmise that the increased phagocytosis of mDC is involved in the abnormal expansion of CTLs.
Finally, in the analysis of the correlation between phagocytosis of mDC and blood routine test, we found that phagocytosis of mDC in SAA patients correlated inversely with the level of hemoglobin, white blood cell, platelet, and reticulocyte, which represented the severity of the disease. From these data, we concluded that the increased phagocytosis of mDC was responsible for the damage of hematopoietic cells and was involved in the pathogenesis of SAA. The stronger the phagocytosis, the more serious the disease. The inhibition of mDC by IST might be the reason for the end of the “immune storm” and the recovery of the hematopoietic system, leading to the complete remission of SAA patients.
In summary, we showed in this study that the phagocytosis of mDC increased significantly in untreated SAA patients and was closely related to immune status and severity of the disease. These data confirmed the antigen‐driven mechanism of SAA and indicated that mDC modulating might have therapeutic potential in treating SAA.
CONFLICT OF INTEREST
The authors declare no conflicts of interest.
Sun Y, Wu C, Liu C, et al. Myeloid dendritic cells in severe aplastic anemia patients exhibit stronger phagocytosis. J Clin Lab Anal. 2021;35:e24063. 10.1002/jcla.24063
Yingying Sun and Chengcheng Wu contributed equally to this work and should be considered co‐first authors.
DATA AVAILABILITY STATEMENT
The data that support the findings of this study are available from the corresponding author upon reasonable request.
REFERENCES
- 1. Liu C, Sun Y, Shao Z. Current concepts of the pathogenesis of aplastic anemia. Curr Pharm Des. 2019;25(3):236‐241. [DOI] [PubMed] [Google Scholar]
- 2. Zonghong S, Meifeng T, Huaquan W, et al. Circulating myeloid dendritic cells are increased in individuals with severe aplastic anemia. Int J Hematol. 2011;93(2):156‐162. [DOI] [PubMed] [Google Scholar]
- 3. Jun W, Zonghong S, Rong F, Yuhong W, Limin X, Huaquan W. In vitro induction of allo‐T lymphocytes proliferation by myeloid dendritic cells in patients with severe aplastic anemia. Chinese J Intern Med. 2009;48(12):1040‐1043. [PubMed] [Google Scholar]
- 4. Marsh JCW, Ball SE, Cavenagh J, et al. Guidelines for the diagnosis and management of aplastic anaemia. Br J Haematol. 2009;147(1):43‐70. [DOI] [PubMed] [Google Scholar]
- 5. Ritz C, Meng W, Stanley NL, et al. Postvaccination graft dysfunction/aplastic anemia relapse with massive clonal expansion of autologous CD8+ lymphocytes. Blood Adv. 2020;4(7):1378‐1382. [DOI] [PMC free article] [PubMed] [Google Scholar]
- 6. Schuster FR, Hubner B, Führer M, et al. Highly skewed T‐cell receptor V‐beta chain repertoire in the bone marrow is associated with response to immunosuppressive drug therapy in children with very severe aplastic anemia. Blood Cancer J. 2011;1(3):e8. [DOI] [PMC free article] [PubMed] [Google Scholar]
- 7. Giudice V, Feng X, Lin Z, et al. Deep sequencing and flow cytometric characterization of expanded effector memory CD8(+)CD57(+) T cells frequently reveals T‐cell receptor Vβ oligoclonality and CDR3 homology in acquired aplastic anemia. Haematologica. 2018;103(5):759‐769. [DOI] [PMC free article] [PubMed] [Google Scholar]
- 8. Kordasti S, Marsh J, Al‐Khan S, et al. Functional characterization of CD4+ T cells in aplastic anemia. Blood. 2012;119(9):2033‐2043. [DOI] [PubMed] [Google Scholar]
- 9. Gargiulo L, Papaioannou M, Sica M, et al. Glycosylphosphatidylinositol‐specific, CD1d‐restricted T cells in paroxysmal nocturnal hemoglobinuria. Blood. 2013;121(14):2753‐2761. [DOI] [PubMed] [Google Scholar]
- 10. Gargiulo L, Zaimoku Y, Scappini B, et al. Glycosylphosphatidylinositol‐specific T cells, IFNγ‐producing T cells, and pathogenesis of idiopathic aplastic anemia. Blood. 2017;129(3):388‐392. [DOI] [PubMed] [Google Scholar]
- 11. Goto M, Kuribayashi K, Takahashi Y, et al. Identification of autoantibodies expressed in acquired aplastic anaemia. Br J Haematol. 2013;160(3):359‐362. [DOI] [PubMed] [Google Scholar]
- 12. Dutta A, De R, Dolai TK, Mitra PK, Halder A. Changes in different cytokines (IL‐2, TNF‐α, and IFN‐γ) profile in acquired aplastic anemia patients: a study from Eastern India. J Pediatr Hematol Oncol. 2020;42(3):185‐192. [DOI] [PubMed] [Google Scholar]
- 13. Liu B, Shao Y, Liu Z, Liu C, Zhang T, Fu R. Bone marrow plasma cytokine signature profiles in severe aplastic anemia. Biomed Res Int. 2020;2020:8789275. [DOI] [PMC free article] [PubMed] [Google Scholar] [Retracted]
- 14. Young NS. Aplastic anemia. N Engl J Med. 2018;379(17):1643‐1656. [DOI] [PMC free article] [PubMed] [Google Scholar]
Associated Data
This section collects any data citations, data availability statements, or supplementary materials included in this article.
Data Availability Statement
The data that support the findings of this study are available from the corresponding author upon reasonable request.


