FIG 4.
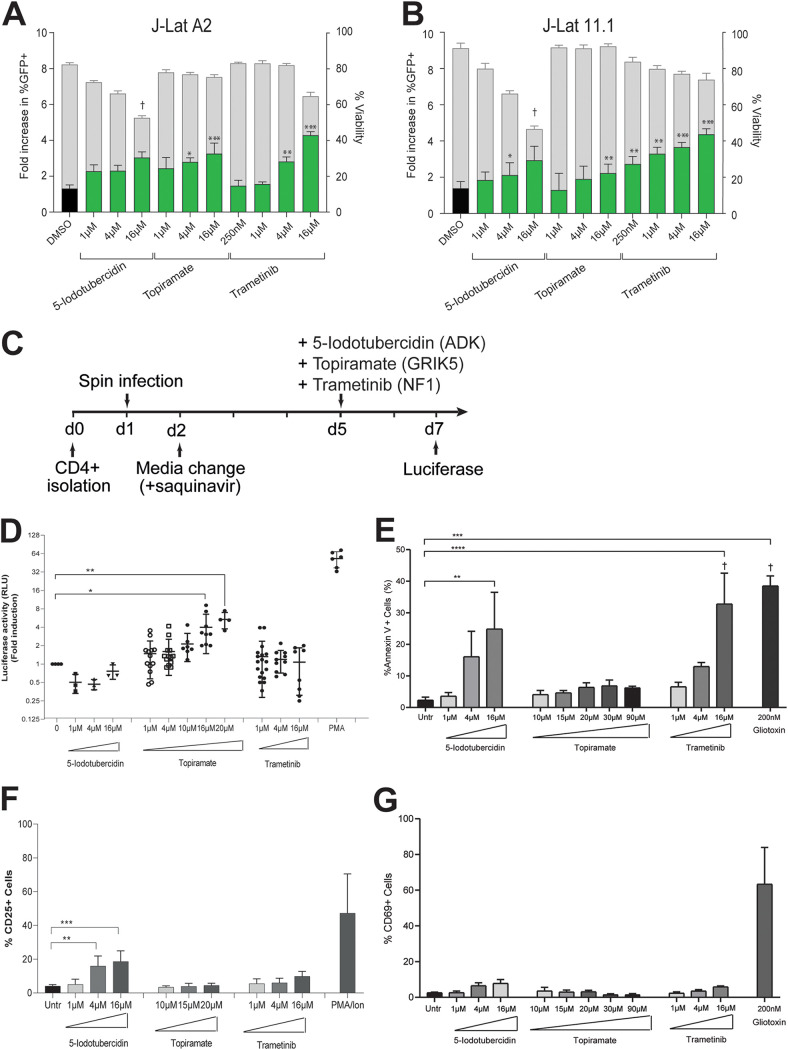
HIV-1 latency reversal by small-molecule inhibitors of three candidate genes, ADK, GRIK5, and NF1. (A) Latency reversal potential upon 48-h treatment of J-Lat A2 cells with increasing concentrations of 5-iodotubercidin (ADK inhibitor), topiramate (GRIK5 inhibitor), and trametinib (NF1 inhibitor) was evaluated by flow cytometry. Treatment with DMSO (black bar) is used as a negative control. Percentage of GFP-positive cells is indicated by green bars (left y axes), and cell viability is indicated by gray bars (right y axis). (B) Latency reversal potential upon 48-h treatment of J-Lat 11.1 cells. (C) Schematic representation of candidate LRA treatment in a primary cell model of latent HIV-1 infection. CD4+ T cells are isolated on day 0 and spin infected on day 1. On day 2 virus is removed by medium change in the presence of saquinavir. Latently infected cells are stimulated with candidate LRAs on day 5, and HIV-1 reactivation is evaluated at day 7. (D) Latency reversal as measured by luciferase activity in a primary cell model of HIV-1 latency after treatment with 5-iodotubercidin, trametinib, and topiramate in different concentrations. Plots show the fold increase in luciferase activity, measured in relative light units (RLU), after treatment with different concentrations of 5-iodotubercidin (ADK inhibitor), topiramate (GRIK5 inhibitor), and trametinib (NF1 inhibitor). Each dot represents a single measurement, and black horizontal lines show the average fold increase for each treatment. Averaged data from at least 3 independent experiments performed using each time two different donors (totaling at least 6 different donors). PMA was used as a positive control. Statistical significance was calculated using t test: *, P < 0.05; **, P < 0.005; ***, P < 0.0005. (E) Percentage of cells expressing apoptosis marker annexin V in primary CD4+ T cells upon treatment with candidate LRAs for 48 h. Treatment with a toxic concentration of gliotoxin (GTX), 200 nM, was used as a positive control. Experiments were performed in uninfected cells obtained from 6 healthy donors. Data are presented as mean ± SD from three independent experiments. The † symbol indicates low viability. (F) Percentage of cells expressing marker of cell activation CD25 in primary CD4+ T cells from 6 healthy donors; data are presented as mean ± SD from three independent experiments of 2 different healthy donors upon treatment with candidate LRAs for 48 h. Treatment with PMA/ionomycin is used as a positive control. (G) Percentage of cells expressing marker of cell activation CD69 in primary CD4+ T cells from 6 healthy donors; data are presented as mean ± SD from three independent experiments of 2 different healthy donors upon treatment with candidate LRAs for 48 h. Treatment with PMA/ionomycin is used as a positive control. Statistical significance was calculated using one-way ANOVA, multiple-comparison test. Asterisks indicate the level of significance. (**, P < 0.01; ***, P < 0.001).

