

Abstract
Obesity-related metabolic dysregulation causes mild cognitive impairment and increased risk for dementia. We used an LDLR-deficient C57BL/6J mouse model (LDLRKO) to investigate whether adropin, a neuropeptide linked to neurodegenerative diseases, improves cognitive function in situations of metabolic dysregulation. Adropin transgenic mice (AdrTG) were crossed with LDLRKO; male and female progeny were fed a high fat diet for 3-months. Male chow-fed wild type (WT) mice were used as controls. Diet-induced obesity and LDLR-deficiency caused severe dyslipidemia, irrespective of sex. The AdrTG prevented reduced adropin protein levels in LDLRKO cortex. In males, metabolic dysregulation and AdrTG genotype significantly and bidirectionally affected performance in the novel object recognition (NOR) test, a declarative hippocampal memory task (discrimination index mean±SE for WT, 0.02±0.088; LDLRKO, −0.115±0.077; AdrTG;LDLRKO, 0.265±0.078; genotype effect, p=0.009; LDLRKO vs. AdrTG;LDLRKO, P<0.05). A 2-way ANOVA (fixed variables: sex, AdrTG genotype) indicated a highly significant effect of AdrTG (P=0.003). The impact of the diet-genotype interaction on the male mouse brain was investigated using RNA-seq. Gene-ontology analysis of transcripts showing fold-changes of >1.3 or <−1.3 (P<0.05) indicated metabolic dysregulation affected gene networks involved in intercellular/neuronal signaling, immune processes, angiogenesis, and extracellular matrix organization. The AdrTG selectively attenuated the impact of metabolic dysregulation on intercellular/neuronal signaling pathways. Intercellular/neuronal signaling pathways were also the predominant processes overrepresented when directly comparing AdrTG;LDLRKO with LDRKO. In summary, adropin overexpression improves cognitive function in severe metabolic dysregulation through pathways related to cell-cell communication and neuronal processes, and independently of preventing inflammatory responses
Keywords: dementia, cognitive function, dyslipidemia, obesity, transgenic models
1.0. INTRODUCTION
Systemic cardio-metabolic dysregulation that is indicated by hyperglycemia, atherogenic dyslipidemia and/or hypertension is frequently observed in people with obesity [1]. These metabolic abnormalities also appear to have adverse effects on neurological processes and aging [2]. Changes to hippocampal structures critical for learning and memory, emotional behavior, spatial processing, and navigation have been reported in people with obesity [2, 3]. People with obesity also exhibit mild cognitive impairment, a predisposing risk factor for late-onset dementias of which late-onset Alzheimer’s Disease (LOAD) is most common [2, 3]. Risk of developing late-onset dementias is also increased in people with type 2 diabetes [4, 5].
The significance of the correlation between metabolic dysregulation and dementia risk is amplified by the increased incidence of obesity and advanced age predicted this century [6, 7]. The neurological deficits observed with systemic metabolic dysregulation are responsive to some obesity treatments. Bariatric surgery is the most effective intervention to induce weight loss and reverse insulin resistance, hyperglycemia, dyslipidemia, and hypertension in people with obesity [8, 9]. Bariatric surgery also improves cognitive function [3]. However, non-surgical behavioral interventions intended to reduce weight and increase physical activity do not appear to be effective [10, 11]. The development of pharmacological interventions that reduce dementia risk in people with obesity and/or type 2 diabetes is an unmet need.
We recently reported that the small polypeptide adropin protects preclinical mouse models of aging from mild memory impairment observed in males [12]. Adropin is encoded by the highly conserved short open reading frame in exon 2 of the Energy Homeostasis (ENHO) gene and is highly expressed in the brain relative to other tissues [12–15]. Gene set enrichment analysis (GSEA) suggests that ENHO expression correlates with genes previously linked to neurodegenerative diseases in humans [12] and nonhuman primates (NHP) [14]. Data from animal models support this hypothesis. Adropin protein levels in the mouse and rat brain decline with aging and correlate with neural markers of oxidative stress and vascular disease [12, 16]. Transcriptomic analysis of adropin expression in the mouse brain also indicates correlations with gene networks linked to neurodegenerative diseases [12]. Importantly, treatment of male C57BL/6J (B6) mice with the putative secreted domain (adropin34-76) or transgenic over expression the full length sequence (adropin1-76) prevents mild memory impairment observed with aging [12].
Whether adropin can protect against the mild cognitive impairment observed with obesity has however not been studied. Several observations suggest dysregulation of adropin might be a factor in cognitive impairment observed with obesity. Plasma adropin concentrations have been reported in some studies to be lower in humans and NHP exhibiting plasma markers of increased adiposity [14, 17, 18]. Low plasma adropin concentrations also correlate with indicators of systemic metabolic dysregulation in NHP models of diet-induced obesity [14]. Finally, plasma adropin concentrations increase after bariatric surgery in people with severe obesity [18, 19]. Here we used a mouse model of severe obesity and metabolic dysregulation to test the hypothesis that adropin treatment improves cognitive function in a mouse model of metabolic dysregulation.
2.0. METHODS
2.1. Mouse models
Experiments using mouse models were reviewed and approved by the Animal Care and Use Committee, Saint Louis University School of Medicine. The vivarium uses sentinels tested regularly to screen for viruses and pathogens. Food and water were available ad libitum, with a 12h light-dark cycle (lights-on at 0600h). Behavioral experiments were conducted between 0730 and 1400h.
C57BL/6J (B6) mice lacking functional low-density lipoprotein receptor (LDLRKO) are hypercholesterolemic owing to reduced clearance of LDL from the circulation [20]. LDLRKO develop insulin resistance, dysregulation of glucose metabolism, and severe hypercholesterolemia when fed high fat western diets (HFD) [21, 22]. LDLRKO fed HFD exhibit brain arteriole inflammation, oxidative stress, and cognitive impairment [23, 24].
To determine whether increasing adropin expression protects against cognitive impairment, we used an adropin transgenic mouse (AdrTG) constitutively expressing the adropin ORF under the control of a human β-actin promoter [13]. Production of the AdrTG strain, crossing of the AdrTG strain onto the LDLRKO background (B6.129S7-Ldlrtm1Her/J purchased from The Jackson Laboratory), and colony management were described previously [13, 17]. At 3 months of age, AdrTG; LDLRKO (n=16; 6 females, 10 males) and LDLRKO (n=18; 11 females, 7 males) were fed a high fat diet (HFD) (Research Diets 12451, 45% kcal/fat) for 3 months. A ‘lean’ control group of age-matched male wild type B6 mice (n=12) were maintained on rodent chow (Labdiet 5053).
Mice were weighed at baseline, and then weekly after transfer to HFD. After completion of behavioral testing, mice were euthanized under anesthesia and brain tissue samples (cortex, hippocampus) and EDTA-plasma collected for analysis.
2.2. Assessment of metabolic homeostasis
Insulin was measured by ELISA (Ultrasensitive mouse insulin ELISA kit, cat. no. 90080, Crystal Chem, Elk Grove Village, IL). Blood glucose was measured using OneTouch blood glucose meters (LifeScan, Europe). Plasma cholesterol and triacylglycerol were measured at the Metabolic Core of Scripps Research (Jupiter, FL) using a Cobas c311 clinical chemistry analyzer (Roche Diagnostics, Indianapolis, IN).
2.3. Protein and mRNA expression
Expression of candidate genes was measured using qRT-PCR as previously described [12]. In brief, total RNA extraction and cDNA synthesis followed protocols provided by Applied Biosystems (Waltham, MA) and QuantaBio (Beverly, MA). Sample amplification used 384-well plates, a QuantStudio Realtime PCR machine, primers from Integrated DNA Technology, with SYBR Green used to detect dsDNA. Data were normalized using three reference genes (Hprt1, 36b4, Ppib). Quantitation used QuantStudio 7 Detection System (Applied Biosystems).
Western blot and a mouse monoclonal antibody (Cayman Chemical cat. no. 14117, Ann Arbor, MI) was used to visualize adropin peptide levels in cortex samples as previously described [16]. HSP90 detected using rabbit polyclonal antibody (Cell Signaling Technology cat. no. 4874, Danvers, MA) was used as a sample loading control.
2.4. RNA-seq
RNA integrity was confirmed using Agilent Bioanalyzer. Library preparation used 5ug of total RNA in samples with Bioanalyzer RIN scores > 8.0. Poly-A selection used Oligo-dT beads (mRNA Direct kit, Life Technologies); mRNA was fragmented in reverse transcriptase buffer, heated at 94 degrees for 8 min, and reverse transcribed using Superscript III RT enzyme (Life Technologies) and random hexamers. Second strand reactions yielded ds-cDNA which was blunt ended, an A base added to the 3’ ends, and then sequencing adapters (Illumina) ligated to the ends. Ligated fragments were amplified for 12-15 cycles using primers that incorporated unique dual index tags. Fragments were then sequenced (Illumina NovaSeq-6000) using paired end reads extending 150 bases according to library kit manufacturer’s protocol. Basecalls and demultiplexing used Illumina’s bcl2fastq software and a custom python demultiplexing program with a maximum of one mismatch in the indexing read.
Reads were aligned to the Ensembl release 76 primary assembly with STAR version 2.5.1a1. Gene counts were derived from the number of uniquely aligned unambiguous reads by Subread:featureCount version 1.4.6-p52. Isoform expression of known Ensembl transcripts were estimated with Salmon version 0.8.23. Sequencing performance was assessed for the total number of aligned reads, total number of uniquely aligned reads, and features detected. The ribosomal fraction, known junction saturation, and read distribution over known gene models were quantified with RSeQC version 2.6.24 All gene counts were imported into the R/Bioconductor package EdgeR5 and TMM normalization size factors were calculated to adjust for samples for differences in library size. Ribosomal transcripts and transcripts not expressed in the smallest group size minus one sample greater than one count-per-million were excluded. The TMM size factors and the matrix of counts were imported into the R/Bioconductor package LIMMA [25].
2.5. Analysis of learning and memory
Novel object recognition (NOR) tests recognition memory and is based on mice tending to spend more time exploring novel objects [26]. When tested 24h after initial exposure to the objects, NOR is a declarative hippocampal memory task. After habituation to an empty apparatus (5 min./d for 3d), training sessions involved exposing mice to two identical objects for 5 min; 24h later the mouse was exposed to one of the original objects and a novel object in a new location. The novel object differed in shape but was of the same size and made from the same material as the original object, eliminating odor preferences. The time spent exploring the new object (tn) and the old object (to) was used to calculate the discrimination index or DI [=(tn−to)/(tn+to)]. A value of ‘0’ means the mice spent equal time exploring the novel and old objects, suggesting a failure to recognize novelty.
2.6. Strength and sensorimotor function
Tests of strength and balance were assessed as previously described [27]. Forelimb grip strength was measured in mouse grasping wire mesh connected to a grip strength meter (Columbus Instruments). Values were corrected by dividing strength meter values by body weight (Kg). ‘Hang tests’ were used to assess strength and endurance. For the string hang test the length of time mice hung on to string with its front paws was recorded. The cage hang test recorded the length of time mice gripped the top of inverted wire mesh cage with all 4 paws. The pole balance test involved placing mice on a 0.25-inch diameter rod; time taken for mice to lose balanced on the top of pole and the amount of time taking to fall off the rod after losing balance were recorded. Equipment for the hang tests were suspended 12 inches above 0.75-inch foam pads, and were stopped after 3 min.
2.7. Statistical analysis
Behavioral data were analyzed using Microsoft Excel or Graph Pad Prism software with differences between groups assessed using analysis of variance (ANOVA); significance between specific groups used post hoc tests (t-test with Bonferroni). Values were considered statistically significant at the level of p < 0.05. For RNA seq results, genesets meeting the selection criteria were subject to functional enrichment analysis used the ToppFun tool (https://toppgene.cchmc.org).
3.0. RESULTS
3.1. Diet-genotype effects on adropin protein levels in the mouse cortex
Increased levels of adropin immunoreactivity in the cortex have been observed in the AdrTG model [12]. Whether diet and/or obesity affects brain adropin expression has not been studied. Adropin protein levels in the cortex appeared to be lower in LDLRKO mice fed HFD compared to control WT (Fig. 1A). Clearer evidence for increase in expression was observed in AdrTG; LDLRKO mice compared to both LDLRKO and WT mice (Fig. 1A). The changes in adropin protein levels are not due to differences of Enho gene expression. Expression of the Enho transcript was similar in all genotypes when measured by qRT-PCR or RNA-seq (data not shown).
Figure 1.
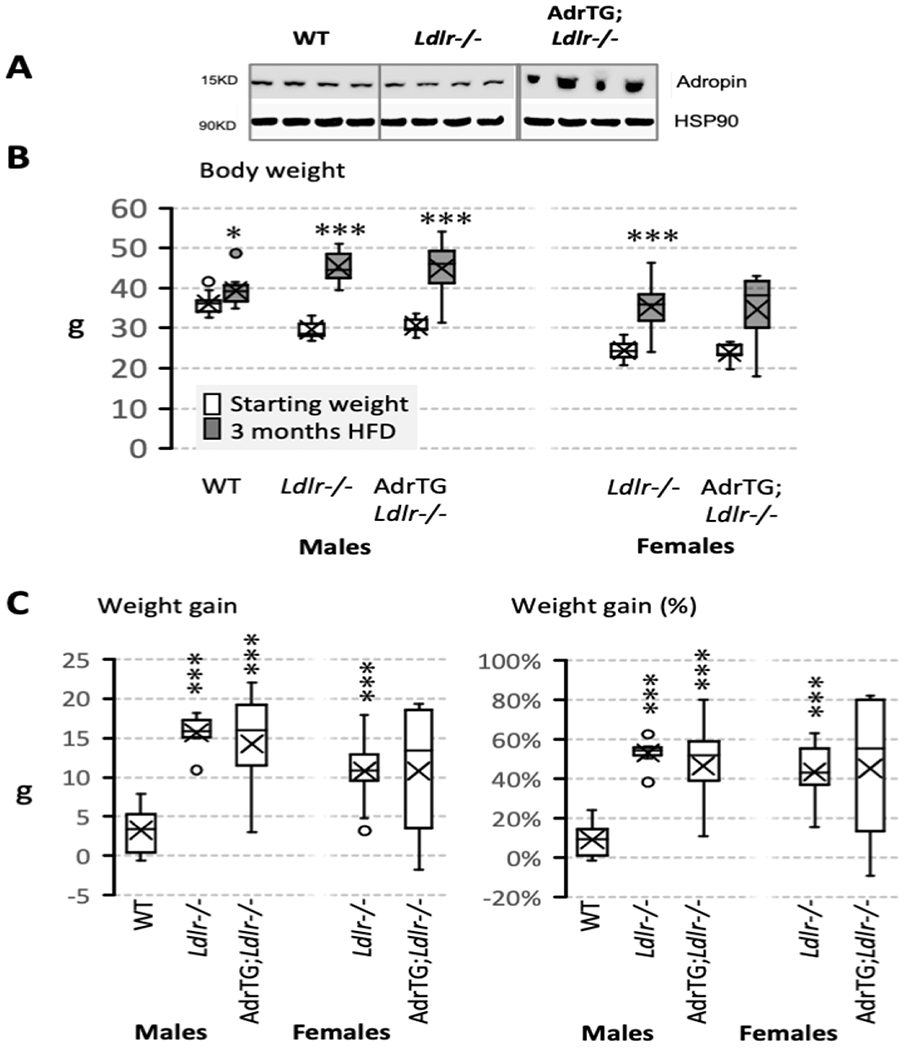
Effect of the adropin transgene, Ldlr-genotype, and diet on adropin protein levels in the cortex (A) and body weight (B, C). Body weight data shown were collected at the start of the study and after 3-months of the mice on the LDR-deficient background being fed high fat diet (HFD). The studies used male and female mice: WT, male B6 mice fed chow (n=12); Ldrl−/−, LDLR-deficient mice fed HFD (males, n=7; females, n=11); AdrTG;LDLRKO, LDLR-deficient mice expressing the adropin transgene (males, n=10; females, n=6). Body weight data collected at the two time points were compared using paired t-test (*, p=0.01; ***, p<0.001). Cortical tissue samples were collected from fed mice after the completion of behavioral testing. For female AdrTG;LDLRKO, n=5 for the plasma insulin and lipid data owing to insufficient plasma. Data are shown as box and whisker plots that show median, mean (X), and variability (minimum and maximum values) outside the upper and lower quartiles.
3.2. Weight gain
The B6 strain carrying the mutant Ldlr and adropin transgenes is commonly used as a preclinical model of diet-induced obesity and insulin resistance [28]. An anticipated, HFD accelerated weight gain of LDLRKO compared to chow-fed WT mice (Fig. 1B, C). AdrTG;LDLRKO mice fed HFD also exhibited accelerated weight gain (Fig. 1B, C). While no chow-fed female controls were included in the study, proportional weight gain of male and female LDLRKO mice fed HFD was comparable (Fig. 1C). Variability in weight gain appeared to be higher in AdrTG;LDLRKO mice compared to LDLRKO, irrespective of sex (Fig. 1C).
3.3. Measurements of glucose and lipid metabolism
Male LDLRKO exhibited the predicted effects of DIO on indices of insulin resistance, with higher fed blood glucose and plasma insulin concentrations compared to chow-fed controls (Fig. 2A). Plasma concentrations of cholesterol and TAG also exhibited the predicted increase with DIO and LDLR-deficiency (Fig. 2B) when compared to chow-fed controls.
Figure 2.
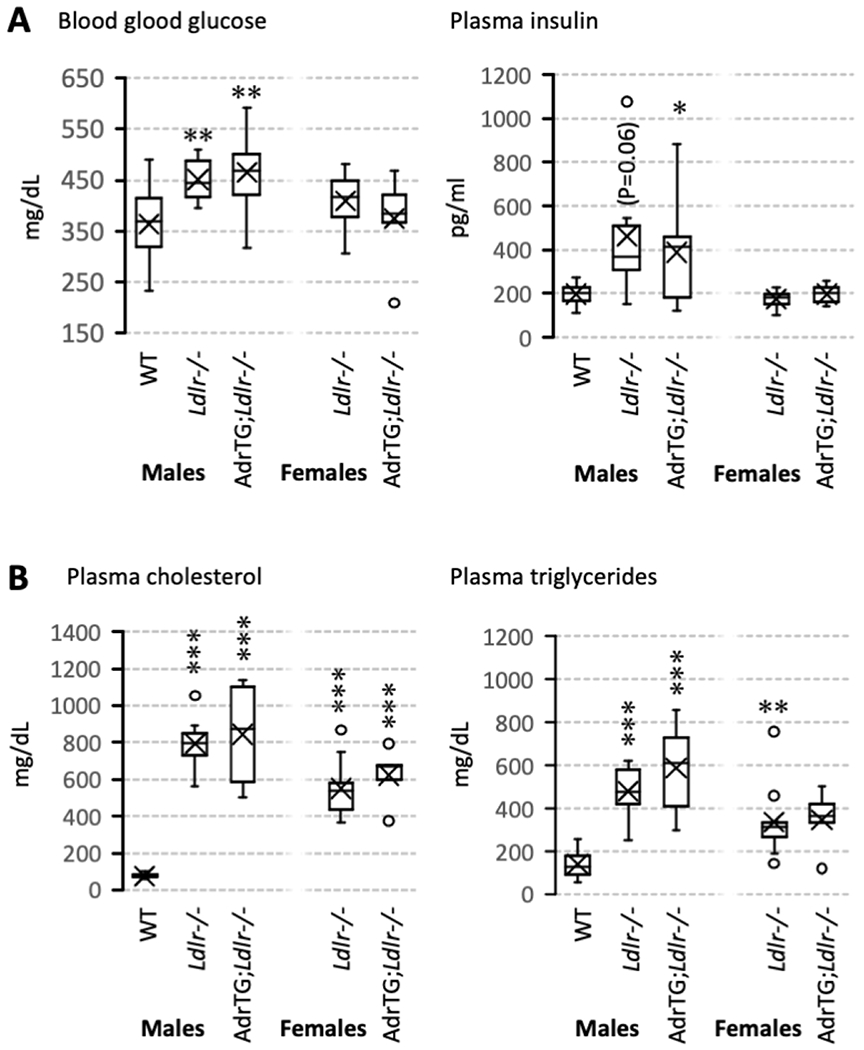
Effect of the adropin transgene, Ldlr-genotype, and diet on indices of glucose (A) and lipid metabolism (B). Data are from fed animals and are shown as box and whisker plots that show median, mean (X), and variability (minimum and maximum values) outside the upper and lower quartiles. Significant differences from male WT mice are indicated by * (p<0.05), ** (p<0.01), or *** (p<0.001).
The impact of diet on insulin sensitivity can be less severe in female B6 mice [28], and was not determined in this experiment dues to the lack of female chow-fed controls. However, female LDLRKO on HFD appeared to exhibit dyslipidemia without the hyperinsulinism observed in obese males compared to chow-fed male controls (Fig. 2A, B). The AdrTG did not significantly affect the impact of HFD or LDLR-deficiency on indices of insulin sensitivity or lipid metabolism in male mice; there was also no difference in female LDLRKO and AdrTG;LDLRKO (Fig. 2A, B).
3.4. Adropin overexpression improves novel object recognition
Focusing on data from male mice suggests a modest impact of metabolic dysregulation on cognitive performance. The DI of the WT group was intermediate between the LDLRKO and AdrTG;LDLRKO groups (Fig. 3). Novel object recognition was clearly improved in AdrTG;LDLRKO related to LDLRKO in both sexes (Fig. 3). A 2-way ANOVA that included mice on the LDLR-deficient background using sex and AdrTG genotype as fixed variables indicated highly significant effects of genotype (p=0.003) (DI for LDLRKO mice: mean, −0.115; std. error, 0.08; 95% CI −0.279 to +0.049; DI for AdrTG;LDLRKO mice: mean, +0.265; std. error, 0.082; 95% CI 0.104 to 0.612). There was no effect of sex (females: mean, 0.136; std. error, 0.08; 95% CI −0.027 to +0.300; males: mean, 0.014; std. error, 0.082; 95% CI −0.154 to +0.182), and no significant interaction between sex and genotype.
Figure 3.
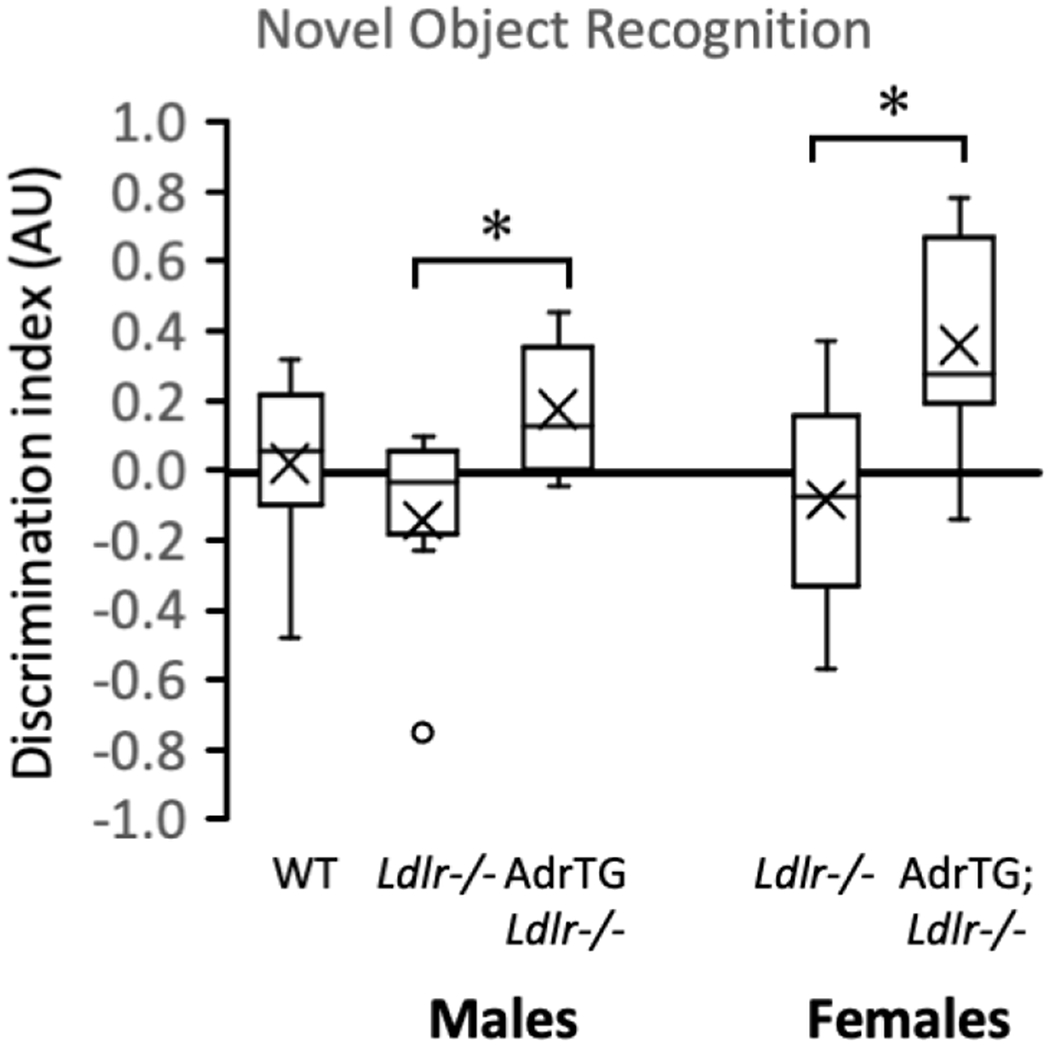
The adropin transgene improves novel object recognition of LDLRKO fed a high fat diet and reverses the impact of metabolic dysregulation on transcripts involved in energy metabolism. After being fed the high fat diet for 3-month, mice were subjected to behavioral testing. WT, male B6 mice fed chow (n=12); LDLRKO, LDLR-deficient mice fed HFD (males, n=6; females, n=9); AdrTG;LDLRKO, LDLR-deficient mice expressing the adropin transgene (males, n=9; females, n=6). Significant different from LDLRKO (post-hoc analysis within sex), p<0.05. Novel object recognition of LDLRKO fed the high fat diet for 3 months was improved by the adropin transgene (A). * p<0.05 vs. LDLRKO.
Performance in tests of sensorimotor function and muscle strength were inversely correlated with indices of insulin resistance owing to obesity (for e.g., Spearman correlation coefficient for rod balance vs. plasma insulin, r=−0.555, p<0.001). There was however no significant effect of diet or genotype (Fig. 4).
Figure 4.
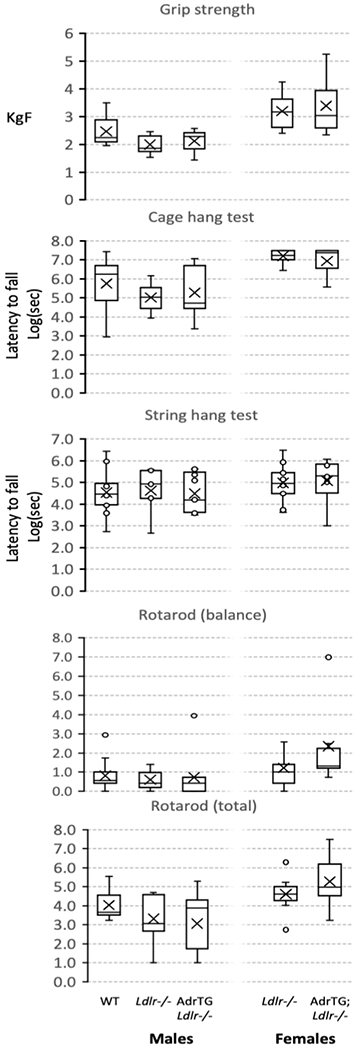
The adropin transgene has no effect on performance in tests of balance and strength of LDLRKO fed HFD.
3.5. AdrTG reverses metabolic dysregulation effects on hippocampal gene expression
Previous experiments suggest regulation of expression involved in growth and development, stress responses, neural activity, and metabolism in the nervous system [12, 13, 17, 29–31]. We first used a candidate gene approach to determine the impact of diet, LDLR-deficiency and adropin on hippocampal gene expression. The results of this preliminary screen suggested that metabolic dysregulation affected hippocampal expression of genes involved in cellular energy metabolism (8/13 genes selected), and that this response was reversed in 7 of the 8 genes by adropin overexpression (Fig. 5, Table S1 in supplemental data).
Figure 5.
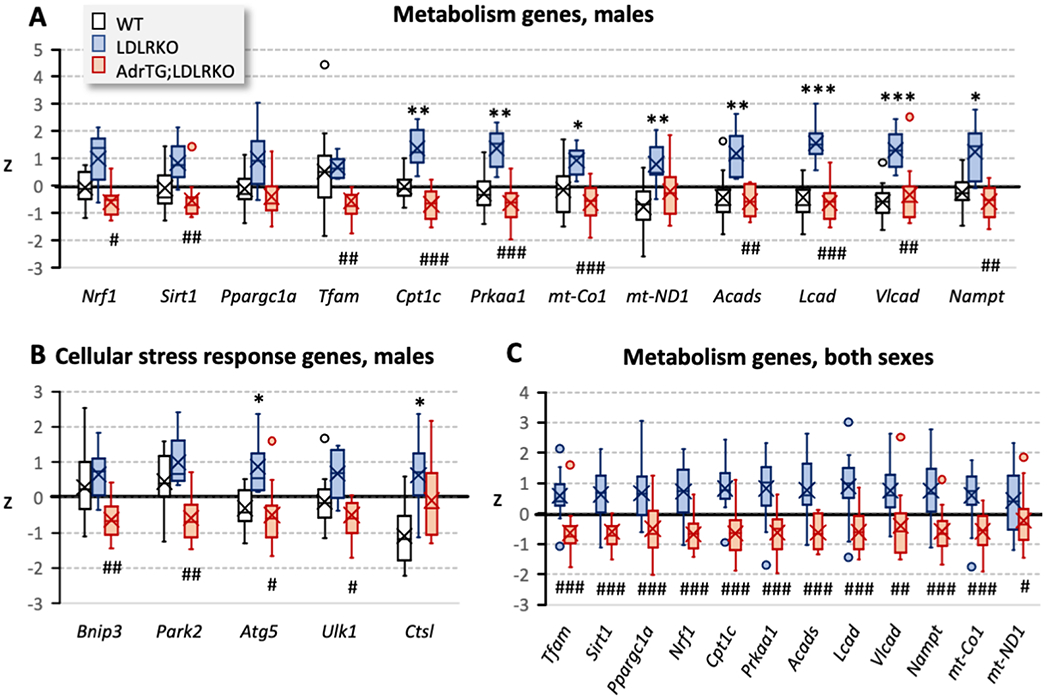
Measurement of candidate genes in male WT (n=12), LDLRKO (n=7), and AdrTG; LDLRKO (n=10) by qRT-PCR in the hippocampus indicated that changes in gene expression due to LDLR-deficiency and high fat diet are reversed by the adropin transgenes in the male arm of the study (A, B). This analysis used t-tests with Bonferroni correction for multiple comparisons. Combining data from both sexes (C) to compare hippocampal gene expression in LDLRKO (n=18) and AdrTG;LDLRKO mice (n=16) also indicated highly significant effects of the adropin transgene. Data are expressed as the standard score (z) (number of std. dev. from the mean). Significance between WT and LDLRKO mice: *, p<0.05; **, p<0.01; ***, p<0.001. Significance between AdrTG;LDLRKO and LDLRKO mice: #, p<0.05; ##, p<0.01; ###, p<0.001.
3.6. Impact of metabolic dysregulation on the cortex transcriptome
We next took an unbiased approach, using RNA-seq to investigate the impact of metabolic dysregulation and adropin expression on the cortex transcriptome. We first determined the impact of metabolic dysregulation. The initial analysis grouped all transcripts meeting the selection criteria (up- or down-regulated). A comparison of RNA seq data from the cortex of WT controls (n=9) and LDLRKO mice fed HFD (n=7) identified 530 genes meeting the selection criteria (linearFC>1.3 or <−1.3, P-value <0.05). GO:Biological Processes linked to the transcripts meeting the selection criteria indicate networks involved in signal transduction, neurotransmitter signaling, and extracellular matrix organization as being over-represented in the population of up- or down-regulated transcripts (Fig. 6A, Fig. 7). GO:Molecular Function of genes showing enrichment in the population correlated with the GO: Biological Process data. For example, GO: Molecular Function showing significance included “calcium-dependent phospholipid binding” (9 hits in query list, 60 genes in genome), “extracellular matrix structural constituent” (15/185 genes), “calcium ion binding” (35/773 genes) and “growth factor binding” (14/168 genes) (q-value FDR B&Y p=0.01142 for all groups). Analysis of the GO: Cellular Components also suggested that metabolic dysregulation was resulting in changes in signal transduction pathway and the extracellular matrix (data not shown).
Figure 6.
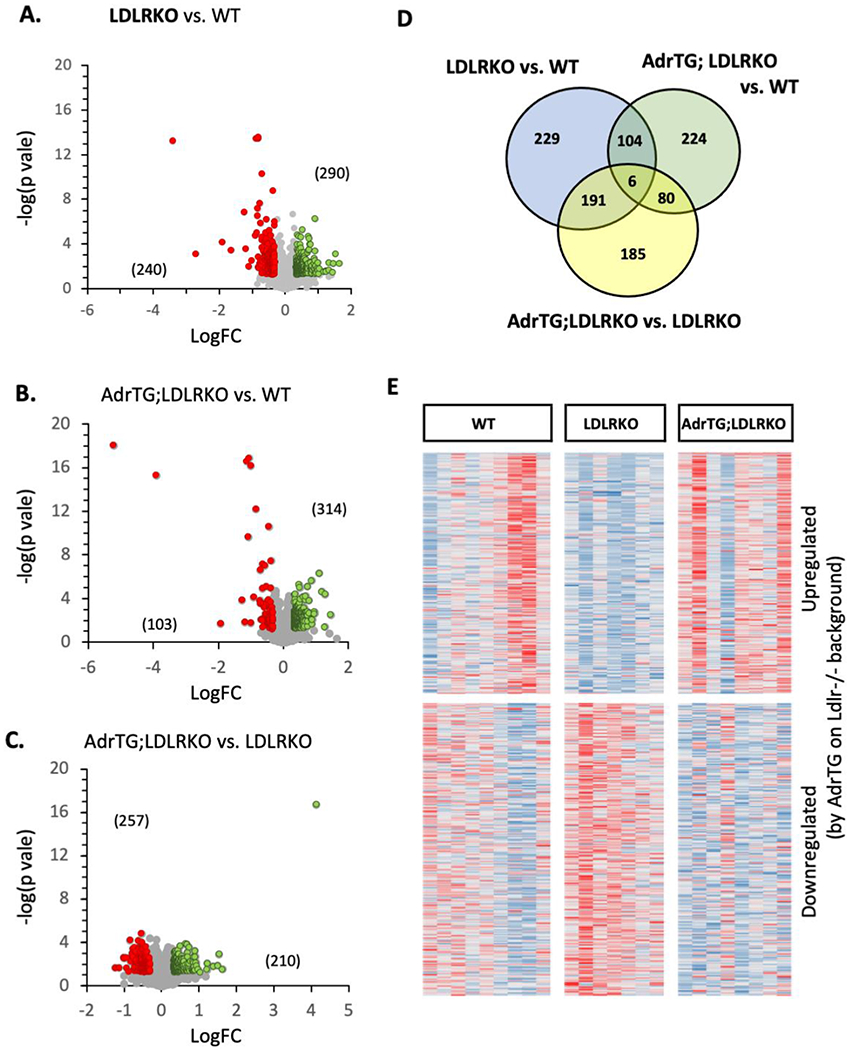
RNA-seq analysis using cortex samples from male mice suggests partial reversal of diet and LDLR-genotype effect by the AdrTG. (A-C) volcano plots from the comparisons between groups indicated in the text above the figure. The numbers of genes meeting the selection criteria that are up-regulated (green) or down-regulated (red) are shown in brackets. (D) overlap in genes meeting the selection criterion for the three comparisons. (E) heatmap showing relative expression of transcripts as z-scores; the transcript were selected for showing meeting the selection criterion betwen AdrTG;LDLRKO and LDLRKO. The map suggests that genes upregulated by the ADRTG in mice on the LDLRKO background were downregulated in LDLRKO mice relative to WT controls.
Figure 7.
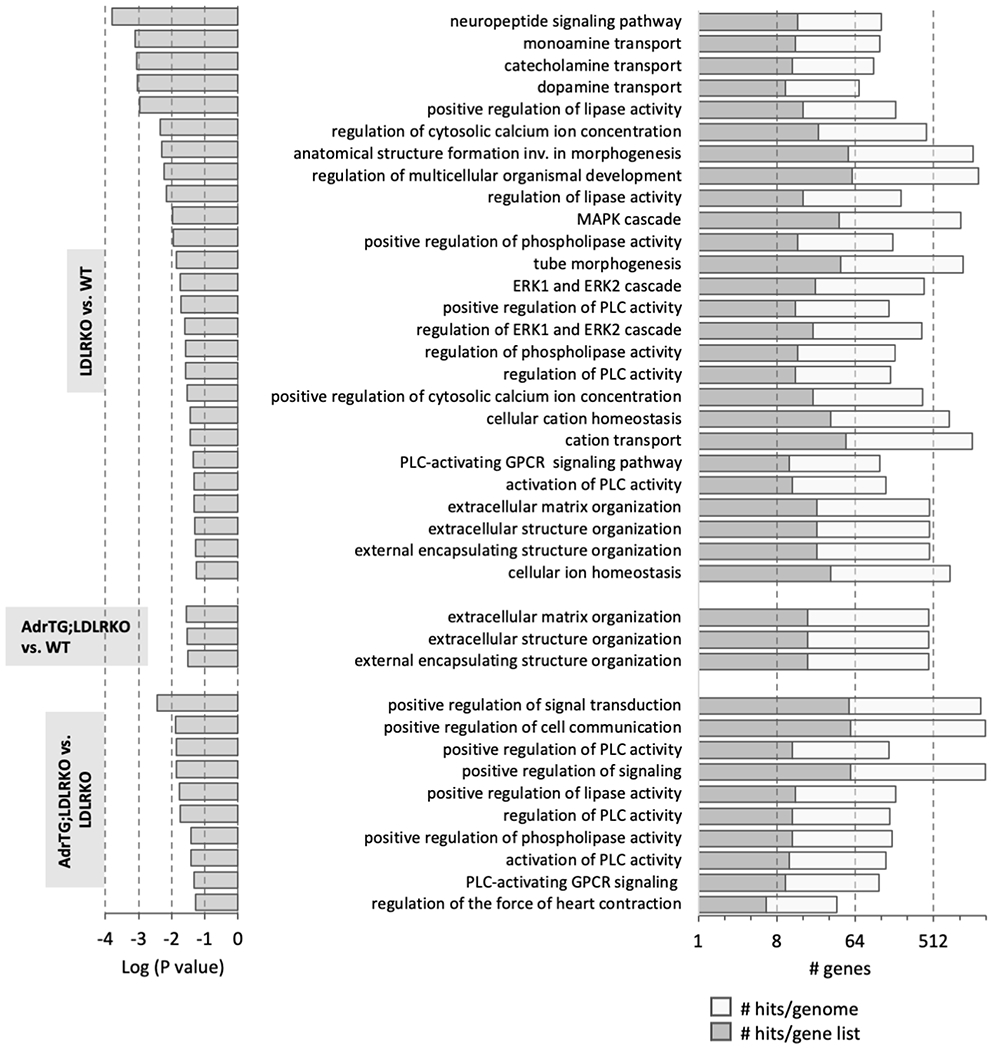
Graphical presentation of the results from gene ontology analysis of the genes meeting the selection criteria for paired analysis (LDLRKO vs. WT, AdrTG;LDLRKO vs. WT, and AdrTG;LDLRKO vs. LDLRKO). The GO:Biologic Process results with q-value (Bonferroni) of p<0.05 are shown.
We were surprised inflammatory responses were not observed in the GSEA data. Further analysis using GSEA of transcripts meeting the selection separated into “up-regulated” or “down-regulated” in LDRKO/HFD mice relative to controls indicated a divergence (Fig. 8). Immune functions (e.g., “response to interferon-gamma” and “cytokine-mediated signaling pathway”) were the predominant GO:Biological Processes in the “up-regulated” population of transcripts. On the other hand, transcripts from genes involved in neural signaling (e.g, “neuropeptide signaling pathway” and “monoamine transport”) were predominant in the “down-regulated” population.
Figure 8.
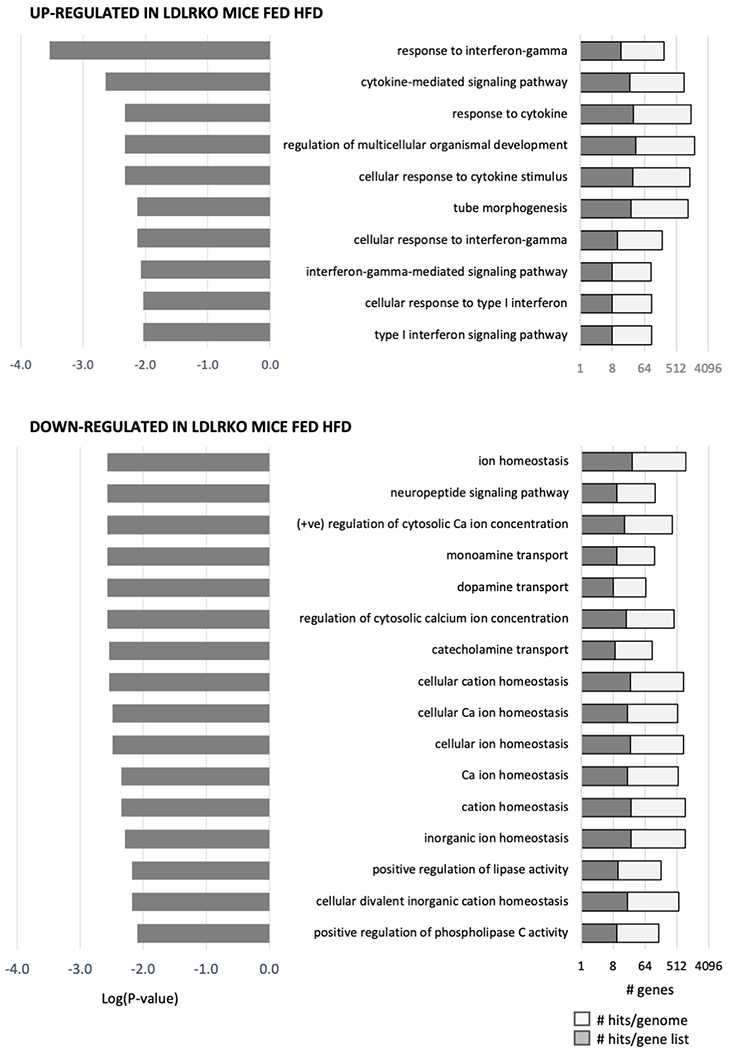
Graphical presentation of the results from gene ontology analysis of the genes meeting the selection criteria for paired analysis between LDLRKO and WT. For this analysis, genes were separated into two groups based on their being “up-regulated” or “down-regulated” by metabolic dysregulation.
3.7. Interaction between diet and adropin expression on the cortex transcriptome
Metabolic dysregulation likely resulted in an inflammatory response while suppressing pathways involved in neuronal activity. To determine how adropin over expressions affects the impact of metabolic dysregulation, we made two comparisons. First, we compared AdrTG;LDLRKO vs. LDLRKO. The outcomes of this comparisons will identify that impact of adropin overexpression in mice on the same background (LDLRKO fed HFD for 3 months). Second, we compared WT vs. AdrTG;LDLRKO. Cross-referencing the outcomes from this analysis with results from comparing WT vs. LDLRKO determines indirectly how the adropin transgene affects the impact of metabolic dysregulation.
Again, we began by pooling all transcripts meeting the selection criteria (up-or down-regulated). Both approaches indicate adropin overexpression changed the impact of metabolic dysregulation on the cortex transcriptome. Indeed, the AdrTG appeared to prevent the impact of metabolic dysregulation for a sizeable proportion of the transcripts affected by diet and LDLR-deficiency (Fig. 6B, C).
Similar numbers of transcripts (approx. 420-450) met the selection criterion for both comparisons (Fig. 6B–D). Proportionately, transcripts meeting the criterion for the AdrTG;LDLRKO vs. LDLRKO overlapped more with the WT vs. LDLRKO (43%) than AdrTG; LDLRKO vs. WT mice (19%) (Fig. 6D). This result could indicate that adropin over expression prevents the impact of metabolic dysregulation on the cortex transcriptome. This conclusion is supported by a heatmap of transcripts meeting the selection criterion for WT vs. LDLRKO (Fig. 6E). Transcripts up- or down-regulated in LDLRKO compared to WT mice were rescued in AdrTG; LDLRKO mice.
GSEA analysis indicated that adropin over expression selectively prevented the impact of metabolic dysregulation on the expression of gene networks involved in signal transduction and neurotransmitter signaling, but not with extracellular matrix organization (Fig. 7). On the other hand, the gene networks enriched in the comparison of AdrTG;LDLRKO vs. LDLRKO mice were biased for signal transduction and neurotransmitter signaling (Fig. 7).
We next performed GSEA on the transcripts that met the selection criteria in the AdrTG;LDLRKO vs. WT comparison, differentiating between genes that were up- or down-regulated. For up-regulated genes, the “GO:Biological Process” with a q-value FDR B&Y<0.01 were mostly (31/32) involved in immune responses (for e.g., “response to cytokine”, “defense response to other organism”, “response to virus”). Only one pathway was not related to immune processes (“vascular process in circulatory system”, 8 genes in query list out of 294 in the genome, p=0.009). In contrast, GSEA of transcripts down-regulated in AdrTG;LDRKO compared to WT failed to identify any “GO:Biological Process”. These transcripts did however suggest enrichment for genes” related to the extracellular matrix (for e.g., GO: Molecular Function: “extracellular matrix structural constituent conferring tensile strength”, P<0.001; “extracellular matrix structural constituent”, p=0.01). “GO:Cellular Component” with q-values FDR B&Y<0.01 were also related to the extracellular matrix (for e.g., “collagen trimer”, “extracellular matrix”).
Collectively, the results from an unbiased analysis of the cortex transcriptome indicate that adropin over expression was not preventing transcriptomic markers of inflammatory responses to metabolic dysregulation. However, the impact of metabolic dysregulation of pathways involved in neuronal process related to signaling and neuronal processes appeared to be eliminated.
4.0. DISCUSSION
These experiments tested the hypothesis that adropin over expression would protect cognitive function of B6 mice experiencing systemic metabolic dysregulation. The results suggest that increased expression of adropin in the mouse brain improves cognitive function, as defined by performance in a test of recognition memory. The results from analysis of gene expression in the cortex and hippocampus are consistent with adropin over expression having a protective role. These effects are independent of improvements in body weight, plasma markers of metabolic homeostasis, or sensorimotor function and strength.
One objective of the study was to determine whether metabolic dysregulation would alter adropin expression in the brain. Western blot data suggest metabolic dysregulation results in lower adropin protein expression in the cortex of the mouse brain. The deficit in expression does not appear to involve reduced mRNA expression as assessed using qRT-PCR or RNA-seq. This suggests that metabolic dysregulation affects either protein translation or degradation. The mechanism explaining this effect is not known. The mechanisms that affect adropin expression at the level of gene transcription and translation have also not been well studied. However, studies of mRNA in ribosomal fractions of liver samples that presumably correlate with protein translation suggest a correlation between levels of the ENHO transcript and translation [31]. This could indicate that obesity-related metabolic dysregulation is affecting the degradation of the adropin protein. Further investigation of how obesity, diet, and metabolic disease affect the expression of the adropin protein in the brain is clearly needed.
The clinical relevance of reduced adropin expression in the cortex is also unclear. The primary source(s) of circulating adropin in humans is not known. However, observations made using human and NHP transcriptomic data suggest that brain could be an important source of circulating adropin. RNA-seq data using post-mortem samples suggest that ENHO mRNA expression is orders of magnitude higher in the human nervous system compared to other tissues [12]. RNA-seq data also suggest ENHO mRNA expression is orders of magnitude higher in the nervous system of NHP compared to other tissues [14]. These observations suggest that the nervous system could be a significant source of circulating adropin in primates. Low plasma adropin concentrations have been reported in people with obesity in some studies [18, 32]. However, a relationship with obesity has not been observed in other studies [17]. Metabolic dysregulation also correlates with lower plasma adropin concentrations. For example, lower circulating levels have been reported in adropin in people with type 2 diabetes [32]. Another study reported an inverse correlation between plasma adropin concentrations and non-HDL cholesterol that possibly results from an inhibitory effect of cholesterol and oxygenated sterols on ENHO expression [17]. Plasma adropin concentrations in NHP correlate with plasma markers of adiposity (high leptin, low adiponectin) and cholesterol metabolism [14]. Collectively, these observations suggest lower levels of circulating adropin that could reflect changes of adropin expression and activity in the nervous system. It would also be interesting to compare adropin concentrations in the cerebrospinal fluid with levels in the circulatory system.
Plasma adropin concentrations increase following bariatric surgery in people with severe obesity [18, 19]. This indicates that improvements in metabolic control are associated with increased adropin levels. Again, further experiments are needed to determine whether this indicates changes in brain expression. Studies that measure adropin concentrations in cerebrospinal fluid would be challenging but might also be informative. Prospective studies examining the relationship between plasma adropin concentrations, metabolic dysregulation and risk for dementia are also needed. Moreover, further investigations using adropin-deficient mice are needed to determine whether lower expression results in cognitive impairment or exacerbates the impact of metabolic dysregulation.
We recently reported that transgenic over expression of adropin prevents the development of mild memory impairment with aging of male B6 mice [12]. We were also able to demonstrate that treatment of aged male B6 mice with synthetic adropin34-76 reversed mild memory impairment [12] . Here we demonstrate that over expression of adropin also significantly improves performance in behavioral tests of a declarative hippocampal memory task in mice experiencing obesity and severe metabolic dysregulation. The current study did not include experiments to determine whether adropin34-76 treatment can reverse cognitive impairment of mice experiencing obesity and severe metabolic dysregulation. Further studies are needed to determine whether synthetic adropin34-76 can improve cognitive function in situations where the nervous system has been exposed to metabolic dysregulation for prolonged periods.
RNA-seq analysis of the cortex transcriptome suggests that adropin over expression was acting selectively to affect the responses to metabolic dysregulation. LDLRKO mice fed HFD have been reported to exhibit evidence of neuroinflammation [24, 33, 34]. GSEA of transcripts upregulated in LDLRKO mice fed HFD are consistent with increased activity of the immune system, likely indicating neuroinflammation. The data suggesting changes in the extracellular matrix are difficult to interpret but could indicate fibrosis and scarring in the nervous system of LDLRKO mice fed HFD. Reactive astrogliosis associated with insults to the nervous system can result in scar formation which can adversely affect axon regeneration [35].
Metabolic dysregulation also appeared to affect pathways involved in neurotransmitter transport and signaling. Genes involved in the transport of monamine neurotransmitters appear to be affected by metabolic dysregulation. G protein coupled receptor (GPCR) signaling, and Intracellular signaling pathways downstream of the GPCRs and monoamine receptors also appeared to be affected (e.g., ERK signaling, phospholipase C, calcium signaling) [36, 37]. This affect is anticipated and consistent with the literature. For example, the release and reuptake of dopamine are known to be adversely affected by HFD [38], while changes in serotonin signaling (reduced release, changes in receptor expression) have also been observed [39]. The relevance of these changes to recognition memory is not clear but could indicate a broader impact on GPCR signaling throughout the nervous system.
Surprisingly, adropin over expression did not appear to prevent the neuroinflammatory responses to diet and Ldlr genotype. On the other hand, adropin over expression appeared to selectively prevent changes in the expression of gene networks involved in neural signaling. This could indicate direct actions of adropin that preserve and/or act to enhance the activity of neural networks. This hypothesis is supported by our recent report of a direct neurotrophic effect of adropin on primary cultured mouse hippocampal neurons [12].
The dependence of this study on RNA-seq analysis is a weakness due to the absence of established protein neuroinflammatory markers, synaptic density, and glial activation. Another weakness is that our investigation in the hippocampus was limited to candidate genes. The selection of candidate genes inherently leads to bias. The genes selected a priori for this experiment were based on previous studies showing correlations and/or responses to peptide treatment [12]. These results should therefore be considered preliminary. However, they nevertheless provide a foundation on which future studies investigating the role of adropin in neurodegenerative conditions of obesity.
In summary, we have presented data suggesting that adropin may have a role in the mild cognitive impairment associated with obesity and obesity-related metabolic dysregulation. This effect appears to be specific for pathways related to the activity of neural networks and is independent of systemic markers of metabolic dysregulation (hyperglycemia, hypertriglyceridemia, hypercholesterolemia) and transcriptomic markers of neuroinflammation.
Supplementary Material
HIGHLIGHTS.
Mechanisms and treatment of obesity-related mild cognitive impairment are unclear
A mouse model of metabolic dysregulation was used to investigate whether adropin over expression could improve cognitive functions
Adropin over expression improve novel object recognition in diet induced obese C57BL/6J mice with dyslipidemia
RNA-seq analysis indicate metabolic dysregulation affected brain immune functions and intercellular/neuronal signaling pathways
RNA-seq analysis indicated the cognitive effects of adropin transgenesis correlated with preventing metabolic effects on intercellular/neuronal signaling pathways
ACKNOWLEDGEMENTS
AAB acknowledges the financial support provided by Saint Louis University and NIH grant R21NS108138. SG acknowledges the support of a PSC-CUNY Award, jointly funded by The Professional Staff Congress and The City University of New York. The Genome Technology Access Center (GTAC), Department of Genetics at Washington University School of Medicine (https://gtac.wustl.edu) assisted with genomic analysis. GTAC is partially supported by NCI Cancer Center Support Grant #P30 CA91842 to the Siteman Cancer Center and by ICTS/CTSA Grant# UL1TR002345 from the National Center for Research Resources (NCRR), a component of the National Institutes of Health (NIH), and NIH Roadmap for Medical Research. This publication is solely the responsibility of the authors and does not necessarily represent the official view of NCRR or NIH.
Footnotes
Publisher's Disclaimer: This is a PDF file of an unedited manuscript that has been accepted for publication. As a service to our customers we are providing this early version of the manuscript. The manuscript will undergo copyediting, typesetting, and review of the resulting proof before it is published in its final form. Please note that during the production process errors may be discovered which could affect the content, and all legal disclaimers that apply to the journal pertain.
Credit Author Statement
Sarbani Ghoshal: Data curation, Funding acquisition, Investigation, Writing – Review & Editing
Subhashis Banerjee: Investigation, Data curation, Writing – Review & Editing
Jinsong Zhang: Data curation, Formal analysis, Writing – Review & Editing
Michael Niehoff: Investigation, Data curation, Formal analysis
Susan A. Farr: Conceptualization, Investigation, Formal analysis, Funding acquisition, Methodology, Resources, Supervision, Writing – Review & Editing
Andrew A. Butler: Conceptualization, Formal analysis, Funding acquisition, Project administration, Resources, Supervision, Writing – Original Draft
DATA REFERENCE
RNA-sequencing data from this experiment are available from the Gene Expression Omnibus (GSE185734).
REFERENCES
- [1].Klein S, Wadden T, Sugerman HJ, AGA technical review on obesity, Gastroenterology 123(3) (2002) 882–932. [DOI] [PubMed] [Google Scholar]
- [2].O’Brien PD, Hinder LM, Callaghan BC, Feldman EL, Neurological consequences of obesity, Lancet Neurol 16(6) (2017) 465–477. [DOI] [PMC free article] [PubMed] [Google Scholar]
- [3].Morledge MD, Pories WJ, Bariatric surgery and cognitive impairment, Obesity (Silver Spring) 29(8) (2021) 1239–1241. [DOI] [PubMed] [Google Scholar]
- [4].Chatterjee S, Peters SA, Woodward M, Mejia Arango S, Batty GD, Beckett N, Beiser A, Borenstein AR, Crane PK, Haan M, Hassing LB, Hayden KM, Kiyohara Y, Larson EB, Li CY, Ninomiya T, Ohara T, Peters R, Russ TC, Seshadri S, Strand BH, Walker R, Xu W, Huxley RR, Type 2 Diabetes as a Risk Factor for Dementia in Women Compared With Men: A Pooled Analysis of 2.3 Million People Comprising More Than 100,000 Cases of Dementia, Diabetes Care 39(2) (2016) 300–7. [DOI] [PMC free article] [PubMed] [Google Scholar]
- [5].Gudala K, Bansal D, Schifano F, Bhansali A, Diabetes mellitus and risk of dementia: A meta-analysis of prospective observational studies, J Diabetes Investig 4(6) (2013) 640–50. [DOI] [PMC free article] [PubMed] [Google Scholar]
- [6].Swinburn BA, Sacks G, Hall KD, McPherson K, Finegood DT, Moodie ML, Gortmaker SL, The global obesity pandemic: shaped by global drivers and local environments, Lancet 378(9793) (2011) 804–14. [DOI] [PubMed] [Google Scholar]
- [7].Lane CA, Hardy J, Schott JM, Alzheimer’s disease, Eur J Neurol 25(1) (2018) 59–70. [DOI] [PubMed] [Google Scholar]
- [8].Hall JE, Hall ME, Cardiometabolic Surgery for Treatment of Hypertension?, Hypertension 73(3) (2019) 543–546. [DOI] [PMC free article] [PubMed] [Google Scholar]
- [9].Poirier P, Cornier MA, Mazzone T, Stiles S, Cummings S, Klein S, McCullough PA, Ren Fielding C, Franklin BA, American PA Heart Association Obesity Committee of the Council on Nutrition, Metabolism, Bariatric surgery and cardiovascular risk factors: a scientific statement from the American Heart Association, Circulation 123(15) (2011) 1683–701. [DOI] [PubMed] [Google Scholar]
- [10].Espeland MA, Luchsinger JA, Baker LD, Neiberg R, Kahn SE, Arnold SE, Wing RR, Blackburn GL, Bray G, Evans M, Hazuda HP, Jeffery RW, Wilson VM, Clark JM, Coday M, Demos-McDermott K, Foreyt JP, Greenway F, Hill JO, Horton ES, Jakicic JM, Johnson KC, Knowler WC, Lewis CE, Nathan DM, Peters A, Pi-Sunyer X, Pownall H, Wadden TA, Rapp SR, Look ASG, Effect of a long-term intensive lifestyle intervention on prevalence of cognitive impairment, Neurology 88(21) (2017) 2026–2035. [DOI] [PMC free article] [PubMed] [Google Scholar]
- [11].Rapp SR, Luchsinger JA, Baker LD, Blackburn GL, Hazuda HP, Demos-McDermott KE, Jeffery RW, Keller JN, McCaffery JM, Pajewski NM, Evans M, Wadden TA, Arnold SE, Espeland MA, Look ARG, Effect of a Long-Term Intensive Lifestyle Intervention on Cognitive Function: Action for Health in Diabetes Study, J Am Geriatr Soc 65(5) (2017) 966–972. [DOI] [PMC free article] [PubMed] [Google Scholar]
- [12].Banerjee S, Ghoshal S, Girardet C, DeMars KM, Yang C, Niehoff ML, Nguyen AD, Jayanth P, Hoelscher BA, Xu F, Banks WA, Hansen KM, Zhang J, Candelario-Jalil E, Farr SA, Butler AA, Adropin correlates with aging-related neuropathology in humans and improves cognitive function in aging mice, NPJ Aging Mech Dis 7(1) (2021) 23. [DOI] [PMC free article] [PubMed] [Google Scholar]
- [13].Kumar KG, Trevaskis JL, Lam DD, Sutton GM, Koza RA, Chouljenko VN, Kousoulas KG, Rogers PM, Kesterson RA, Thearle M, Ferrante AW Jr., Mynatt RL, Burris TP, Dong JZ, Halem HA, Culler MD, Heisler LK, Stephens JM, Butler AA, Identification of adropin as a secreted factor linking dietary macronutrient intake with energy homeostasis and lipid metabolism, Cell metabolism 8(6) (2008) 468–81. [DOI] [PMC free article] [PubMed] [Google Scholar]
- [14].Butler AA, Zhang J, Price CA, Stevens JR, Graham JL, Stanhope KL, King S, Krauss RM, Bremer AA, Havel PJ, Low plasma adropin concentrations increase risks of weight gain and metabolic dysregulation in response to a high-sugar diet in male nonhuman primates, J Biol Chem 294(25) (2019) 9706–9719. [DOI] [PMC free article] [PubMed] [Google Scholar]
- [15].Wong CM, Wang Y, Lee JT, Huang Z, Wu D, Xu A, Lam KS, Adropin is a brain membrane-bound protein regulating physical activity via the NB-3/Notch signaling pathway in mice, J Biol Chem 289(37) (2014) 25976–86. [DOI] [PMC free article] [PubMed] [Google Scholar]
- [16].Yang C, DeMars KM, Candelario-Jalil E, Age-Dependent Decrease in Adropin is Associated with Reduced Levels of Endothelial Nitric Oxide Synthase and Increased Oxidative Stress in the Rat Brain, Aging Dis 9(2) (2018) 322–330. [DOI] [PMC free article] [PubMed] [Google Scholar]
- [17].Ghoshal S, Stevens JR, Billon C, Girardet C, Sitaula S, Leon AS, Rao DC, Skinner JS, Rankinen T, Bouchard C, Nunez MV, Stanhope KL, Howatt DA, Daugherty A, Zhang J, Schuelke M, Weiss EP, Coffey AR, Bennett BJ, Sethupathy P, Burris TP, Havel PJ, Butler AA, Adropin: An endocrine link between the biological clock and cholesterol homeostasis, Mol Metab 8 (2018) 51–64. [DOI] [PMC free article] [PubMed] [Google Scholar]
- [18].Butler AA, Tam CS, Stanhope KL, Wolfe BM, Ali MR, O’Keeffe M, St-Onge MP, Ravussin E, Havel PJ, Low circulating adropin concentrations with obesity and aging correlate with risk factors for metabolic disease and increase after gastric bypass surgery in humans, The Journal of clinical endocrinology and metabolism 97(10) (2012) 3783–91. [DOI] [PMC free article] [PubMed] [Google Scholar]
- [19].Gluck M, Gluck J, Wiewiora M, Rogala B, Piecuch J, Serum Irisin, Adropin, and Preptin in Obese Patients 6 Months After Bariatric Surgery, Obes Surg 29(10) (2019) 3334–3341. [DOI] [PubMed] [Google Scholar]
- [20].Ishibashi S, Brown MS, Goldstein JL, Gerard RD, Hammer RE, Herz J, Hypercholesterolemia in low density lipoprotein receptor knockout mice and its reversal by adenovirus-mediated gene delivery, J Clin Invest 92(2) (1993) 883–93. [DOI] [PMC free article] [PubMed] [Google Scholar]
- [21].Wu L, Vikramadithyan R, Yu S, Pau C, Hu Y, Goldberg IJ, Dansky HM, Addition of dietary fat to cholesterol in the diets of LDL receptor knockout mice: effects on plasma insulin, lipoproteins, and atherosclerosis, J Lipid Res 47(10) (2006) 2215–22. [DOI] [PubMed] [Google Scholar]
- [22].Neuhofer A, Wernly B, Leitner L, Sarabi A, Sommer NG, Staffler G, Zeyda M, Stulnig TM, An accelerated mouse model for atherosclerosis and adipose tissue inflammation, Cardiovasc Diabetol 13 (2014) 23. [DOI] [PMC free article] [PubMed] [Google Scholar]
- [23].Buga GM, Frank JS, Mottino GA, Hendizadeh M, Hakhamian A, Tillisch JH, Reddy ST, Navab M, Anantharamaiah GM, Ignarro LJ, Fogelman AM, D-4F decreases brain arteriole inflammation and improves cognitive performance in LDL receptor-null mice on a Western diet, J Lipid Res 47(10) (2006) 2148–60. [DOI] [PubMed] [Google Scholar]
- [24].Rutkowsky JM, Lee LL, Puchowicz M, Golub MS, Befroy DE, Wilson DW, Anderson S, Cline G, Bini J, Borkowski K, Knotts TA, Rutledge JC, Mouse G Metabolic Phenotyping Center Imaging Working, Reduced cognitive function, increased blood-brain-barrier transport and inflammatory responses, and altered brain metabolites in LDLr −/−and C57BL/6 mice fed a western diet, PLoS One 13(2) (2018) e0191909. [DOI] [PMC free article] [PubMed] [Google Scholar]
- [25].Ritchie ME, Phipson B, Wu D, Hu Y, Law CW, Shi W, Smyth GK, limma powers differential expression analyses for RNA-sequencing and microarray studies, Nucleic Acids Res 43(7) (2015) e47. [DOI] [PMC free article] [PubMed] [Google Scholar]
- [26].Webster SJ, Bachstetter AD, Nelson PT, Schmitt FA, Van Eldik LJ, Using mice to model Alzheimer’s dementia: an overview of the clinical disease and the preclinical behavioral changes in 10 mouse models, Front Genet 5 (2014) 88. [DOI] [PMC free article] [PubMed] [Google Scholar]
- [27].Banks WA, Morley JE, Farr SA, Price TO, Ercal N, Vidaurre I, Schally AV, Effects of a growth hormone-releasing hormone antagonist on telomerase activity, oxidative stress, longevity, and aging in mice, Proc Natl Acad Sci U S A 107(51) (2010) 22272–7. [DOI] [PMC free article] [PubMed] [Google Scholar]
- [28].Collins S, Martin TL, Surwit RS, Robidoux J, Genetic vulnerability to diet-induced obesity in the C57BL/6J mouse: physiological and molecular characteristics, Physiol Behav 81(2) (2004) 243–8. [DOI] [PubMed] [Google Scholar]
- [29].Gao S, McMillan RP, Jacas J, Zhu Q, Li X, Kumar GK, Casals N, Hegardt FG, Robbins PD, Lopaschuk GD, Hulver MW, Butler AA, Regulation of substrate oxidation preferences in muscle by the peptide hormone adropin, Diabetes 63(10) (2014) 3242–52. [DOI] [PMC free article] [PubMed] [Google Scholar]
- [30].Gao S, McMillan RP, Zhu Q, Lopaschuk GD, Hulver MW, Butler AA, Therapeutic effects of adropin on glucose tolerance and substrate utilization in diet-induced obese mice with insulin resistance, Mol Metab 4(4) (2015) 310–24. [DOI] [PMC free article] [PubMed] [Google Scholar]
- [31].Banerjee S, Ghoshal S, Stevens JR, McCommis KS, Gao S, Castro-Sepulveda M, Mizgier ML, Girardet C, Kumar KG, Galgani JE, Niehoff ML, Farr SA, Zhang J, Butler AA, Hepatocyte expression of the micropeptide adropin regulates the liver fasting response and is enhanced by caloric restriction, J Biol Chem 295(40) (2020) 13753–13768. [DOI] [PMC free article] [PubMed] [Google Scholar]
- [32].Zang H, Jiang F, Cheng X, Xu H, Hu X, Serum adropin levels are decreased in Chinese type 2 diabetic patients and negatively correlated with body mass index, Endocr J 65(7) (2018) 685–691. [DOI] [PubMed] [Google Scholar]
- [33].Jahrling JB, Lin AL, DeRosa N, Hussong SA, Van Skike CE, Girotti M, Javors M, Zhao Q, Maslin LA, Asmis R, Galvan V, mTOR drives cerebral blood flow and memory deficits in LDLR(−/−) mice modeling atherosclerosis and vascular cognitive impairment, J Cereb Blood Flow Metab 38(1) (2018) 58–74. [DOI] [PMC free article] [PubMed] [Google Scholar]
- [34].Thirumangalakudi L, Prakasam A, Zhang R, Bimonte-Nelson H, Sambamurti K, Kindy MS, Bhat NR, High cholesterol-induced neuroinflammation and amyloid precursor protein processing correlate with loss of working memory in mice, J Neurochem 106(1) (2008) 475–85. [DOI] [PMC free article] [PubMed] [Google Scholar]
- [35].Sofroniew MV, Molecular dissection of reactive astrogliosis and glial scar formation, Trends Neurosci 32(12) (2009) 638–47. [DOI] [PMC free article] [PubMed] [Google Scholar]
- [36].Beaulieu JM, Espinoza S, Gainetdinov RR, Dopamine receptors - IUPHAR Review 13, Br J Pharmacol 172(1) (2015) 1–23. [DOI] [PMC free article] [PubMed] [Google Scholar]
- [37].Alexander SPH, Christopoulos A, Davenport AP, Kelly E, Mathie A, Peters JA, Veale EL, Armstrong JF, Faccenda E, Harding SD, Pawson AJ, Sharman JL, Southan C, Davies JA, Collaborators C, THE CONCISE GUIDE TO PHARMACOLOGY 2019/20: G protein-coupled receptors, Br J Pharmacol 176 Suppl 1 (2019) S21–S141. [DOI] [PMC free article] [PubMed] [Google Scholar]
- [38].Wallace CW, Fordahl SC, Obesity and dietary fat influence dopamine neurotransmission: exploring the convergence of metabolic state, physiological stress, and inflammation on dopaminergic control of food intake, Nutr Res Rev (2021) 1–16. [DOI] [PMC free article] [PubMed] [Google Scholar]
- [39].van Galen KA, Ter Horst KW, Serlie MJ, Serotonin, food intake, and obesity, Obes Rev 22(7) (2021) e13210. [DOI] [PMC free article] [PubMed] [Google Scholar]
Associated Data
This section collects any data citations, data availability statements, or supplementary materials included in this article.