

Abstract

The heme enzyme chlorite dismutase (Cld) catalyzes O–O bond formation as part of the conversion of the toxic chlorite (ClO2–) to chloride (Cl–) and molecular oxygen (O2). Enzymatic O–O bond formation is rare in nature, and therefore, the reaction mechanism of Cld is of great interest. Microsecond timescale pre-steady-state kinetic experiments employing Cld from Azospira oryzae (AoCld), the natural substrate chlorite, and the model substrate peracetic acid (PAA) reveal the formation of distinct intermediates. AoCld forms a complex with PAA rapidly, which is cleaved heterolytically to yield Compound I, which is sequentially converted to Compound II. In the presence of chlorite, AoCld forms an initial intermediate with spectroscopic characteristics of a 6-coordinate high-spin ferric substrate adduct, which subsequently transforms at kobs = 2–5 × 10⁴ s–1 to an intermediate 5-coordinated high-spin ferric species. Microsecond-timescale freeze-hyperquench experiments uncovered the presence of a transient low-spin ferric species and a triplet species attributed to two weakly coupled amino acid cation radicals. The intermediates of the chlorite reaction were not observed with the model substrate PAA. These findings demonstrate the nature of physiologically relevant catalytic intermediates and show that the commonly used model substrate may not behave as expected, which demands a revision of the currently proposed mechanism of Clds. The transient triplet-state biradical species that we designate as Compound T is, to the best of our knowledge, unique in heme enzymology. The results highlight electron paramagnetic resonance spectroscopic evidence for transient intermediate formation during the reaction of AoCld with its natural substrate chlorite. In the proposed mechanism, the heme iron remains ferric throughout the catalytic cycle, which may minimize the heme moiety’s reorganization and thereby maximize the enzyme’s catalytic efficiency.
Keywords: biradical, chlorite dismutase, electron paramagnetic resonance spectroscopy, heme, microsecond-timescale freeze hyperquenching, rapid kinetics, resonance Raman spectroscopy, triplet state
Introduction
The reaction mechanism of chlorite (ClO2–) conversion by the enzyme chlorite dismutase (Cld) remains poorly understood due to technical difficulties in studying enzymes with fast turnovers. Cld is a heme b-dependent enzyme, which has been classified as a chlorite O2-lyase (EC 1.13.11.49).1,2 This enzyme is an essential component of (per)chlorate-respiring bacteria, which can reduce (per)chlorate (ClO4–/ClO3–) to chlorite (ClO2–). This respiration product chlorite is toxic.2−4 Therefore, the physiological role of Cld is detoxifying chlorite to harmless chloride (Cl–) and molecular oxygen (O2). At least some of the produced O2 can be utilized to generate a proton motive force using a terminal oxidase.5 Despite the natural occurrence of (per)chlorate in minerals, the contamination of the aqueous environment with (per)chlorate is of recent anthropogenic origin, as it is the persistent degradation product of chlorine bleach.6−9
Enzymes of the Cld family have numerous potential biotechnological applications, such as chlorite bioremediation in water, in situ oxygen production for medical and synthetic biology applications,10 or for studying O2-utilizing enzymes.11 The fundamental chemistry of Cld catalysis is also fascinating, as it represents a rare example of enzymatic O–O bond formation. So far, only the water-splitting manganese oxygen-evolving complex of photosystem II and the poorly characterized nitric oxide dismutase have been identified in nature to catalyze O–O bond formation.12,13 Therefore, it is of great interest to understand the precise molecular mechanism of Cld.
To obtain direct evidence of a molecular mechanism, transient enzyme intermediates have to be identified and characterized over time, which is technically challenging, especially since Clds exhibit generally high turnover rates. For example, the Cld from Dechloromonas aromatica (DaCld) and the Cld from Magnetospirillum sp. exhibit a kcat of 7.5 × 10³ and 12 × 103 s–1, respectively, at pH 7.14,15 As a consequence, the time constant for a single turnover is 133 μs for DaCld and 83 μs for the Cld from Magnetospirillum sp, which is too short for most commonly used pre-steady-state kinetic techniques: stopped-flow spectroscopy (dead time of circa 1 ms) and rapid freeze quench (dead time of circa 10 ms). To overcome this problem, we used in-house developed microsecond-timescale pre-steady-state kinetic methods,16,17 which allowed us to obtain direct evidence for transient catalytic intermediates.
It has been established through isotope-labeling studies that both oxygen atoms in produced O2 originate from one ClO2– molecule in 1:1 stoichiometry.4,14,18−20 However, how the Cl–O bonds in the ClO2– molecule are cleaved by the enzyme remains to be established. Multiple possible mechanisms (Scheme 1) have been proposed.18,21,22 The Cl–O bond could be cleaved heterolytically (Scheme 1, mechanism I) to yield a hypochlorite (ClO–) intermediate product and a high-valent ferryl (Fe(IV)=O) species with a cation radical on the porphyrin ring (Compound I, Cpd I). Alternatively, the Cl–O bond could be cleaved homolytically (Scheme 1, mechanism II) to yield a chlorine monoxide (ClO•) radical intermediate product and a neutral high-valent ferryl (Fe(IV)=O) species (Compound II, Cpd II). The reaction intermediates (either ClO– or ClO•) attack the ferryl oxygen in a rebound step to form a Fe(III)-peroxyhypochlorite (Fe(III)–OOCl–) species. The products, Cl– and O2, are released after this rebound step, and the ferric resting state is restored.23 Two computational studies support the idea that the Cl–O bond cleavage by Cld is homolytic, unlike the heterolytic cleavage by synthetic Fe-containing porphyrins, which was attributed to the specific active site environment in Cld.24,25
Scheme 1. Currently Proposed Putative Mechanisms for Heterolytic (I) or Homolytic (II) Cl–O Bond Cleavage and O–O Bond Formation by the Enzyme Chlorite Dismutase.

Here, we present the results of pre-steady-state kinetic experiments on recombinantly expressed Cld from Azospira oryzae (AoCld) with the native substrate chlorite and the model substrate peracetic acid (PAA) that is frequently used to study transient reaction intermediates of heme enzymes. We present evidence that the reaction with the native substrate chlorite results in different transient intermediates compared to the reaction with the model substrate PAA. Finally, the first snapshots of the real, physiologically relevant catalytic intermediates of AoCld were obtained, suggesting a new reaction mechanism for Cld involving a triplet-state biradical species (Compound T, Cpd T), which, to the best of our knowledge, is unique in heme biochemistry.
Materials and Methods
Recombinant Protein Expression in Escherichia coli and Enzyme Purification
The chlorite dismutase from A. oryzae (AoCld) was recombinantly expressed in Escherichia coli and purified extensively, as previously described.26
Activity Measurements
The activity of AoCld was measured polarographically using a Clark-type oxygen electrode (type 5331, YSI Life Science) with 100 mM potassium phosphate buffer (KPi), pH 7, and 1 mM sodium chlorite as a substrate at 20 °C. The electrode was calibrated with 100% air-saturated buffer and 0% oxygen after adding a spatula tip of sodium dithionite. The measurements were carried out in a total reaction volume of 3 mL with approximately 120–200 pM AoCld (final concentration). After flushing the reaction chamber with nitrogen, the reactions were initiated by injecting the enzyme solution with a gastight syringe (Hamilton).
UV–Vis Measurements
All UV–vis spectroscopic measurements were performed with a Cary 60 spectrophotometer from Agilent Technologies at 21 °C. The spectra were measured with 10 μM AoCld in 100 mM KPi, pH 5.8 and pH 7.0, respectively, in a 3 mL quartz cuvette. Spectra were recorded in a wavelength range from 200 to 800 nm.
Pre-Steady-State Kinetic Techniques
The rapid kinetic experiments were performed with a continuous flow ultrafast rapid mixing UV–vis spectroscopy instrument, called Nanospec, and a freeze-quench technique, called microsecond freeze hyperquenching (MHQ). The Nanospec and MHQ have a dead time of 4 μs27,28 and 80 μs,28−30 respectively, which allow observation of short-lived intermediates in the microsecond to millisecond timescale.
Nanospec Continuous Flow Spectroscopy
The optical PMMA cell has a path length of ∼100 μm, and with a rapid scanning monochromator and a CCD camera as a detector, 1900 UV–vis spectra are recorded in a single run.27 The Nanospec experiments were performed at 29 °C. Spectra were recorded from 350 to 650 nm, with a total flow rate of 7 and 20 mL min–1 for PAA and sodium chlorite (NaClO2), respectively. For single mixing experiments, 350 μM AoCld (final concentration) was mixed with various concentrations of PAA (1–40 mM final concentration) and 330 μM AoCld (final concentration) was mixed with various concentrations of sodium chlorite (10–50 mM final concentration). The enzyme and both substrates PAA and sodium chlorite were dissolved in 100 mM KPi, pH 7.0, shortly before the experiments. For all results, the final concentrations of the enzyme and substrate for the mixing experiments are reported.
Microsecond Freeze Hyperquenching
0.5 mM AoCld and 1.5 mM PAA or 75 mM NaClO2 (final concentrations) were mixed 1:1 (v/v) at various flow rates. The mixed solutions were sprayed as a free-flowing jet under a vacuum (30 mbar) on a rotating plate (6000 rpm) and cooled down with liquid nitrogen.29,30 To pick specific time points, the first-order rate constants obtained from the Nanospec experiments at 29 °C were transformed to a calculated first-order rate constant at 9 °C, the MHQ operating temperature, using (eq 1) as we have described previously.28 The length of the aging loop, the linear flow rate, and the distance between the nozzle and the rotor plate determine the time point at which the reaction is quenched. For a jet with a 20 μm diameter, the freezing time is 40 μs. After the samples were sprayed, additional liquid nitrogen was immediately poured into the rotor to keep the powder cold. The powder was scraped off the rotor plate, packed in EPR tubes, and stored at 77 K for EPR and resonance Raman (RR) spectroscopic analysis. For all results, the final concentrations of the enzyme and substrate for the mixing experiments are reported.
| 1 |
kB = Boltzmann constant equal to 1.381 × 10⁻²³ J·K–1, h = Planck constant equal to 6.626 × 10⁻³⁴ J·s, T1 = 9 °C, T2 = 29 °C, and k2 = first-order rate constant at 29 °C.
Singular Value Decomposition Analysis of Kinetic Data
The time-resolved spectra generated with the Nanospec were loaded into the program KinTek Explorer (version 8, KinTek Corp.), which uses singular value decomposition (SVD) to deconvolute the data regardless of the shape and the amplitude of the spectra.31−34 More information on the SVD analysis is provided in the Supporting Information.
Electron Paramagnetic Resonance Spectroscopy
EPR spectra were recorded on a Bruker EMXplus spectrometer with a helium-flow cryostat at 20 K,35,36 using the following EPR parameters: microwave frequency 9.406 GHz, microwave power 0.2, 20, or 79 mW, a modulation frequency of 100 kHz, and a modulation amplitude of 2, 10, or 20 G. Spectra were scanned from 5–505 mT [high-spin (HS) signals], 200–400 mT [low-spin (LS) signals], or 316–356 mT (radical signals). One spectrum was recorded at a slightly higher microwave frequency of 9.620 GHz by using a dual-mode resonator (Bruker ER 4116DM) in the perpendicular mode instead of the standard resonator (Bruker ER 4102ST). The measured samples contained 75 μM AoCld in 200 μL of 100 mM KPi, pH 7.0, unless stated otherwise. The magnetic field was calibrated using the Bruker BDPA [1,3-bis(diphenylene)-2-phenylallyl radical] standard with the g-value 2.00254 ± 0.00003. EPR simulations of selected spectra were performed using the programs TRIPLET to simulate a triplet spectrum and HyperfineSpectrum to simulate an apparent chlorine-based radical.37 TRIPLET was written in mixed language, LabVIEW graphical language, using the LabVIEW professional development system 2020 with a call to a dynamic link library for the computational-intensive procedures written in FORTRAN using the Intel Visual Fortran Compiler 2020 integrated into the Microsoft Visual Studio Community 2019 development environment. The program is based on the usual spin Hamiltonian H = βB·g·S + D[Sz2 – S(S + 1)/3] + E(Sx2 – Sy2) in which the first term is the electronic Zeeman interaction of the S = 1 system and the second and third terms describe the axial and rhombic zero-field interaction between the two unpaired electrons. Executables are freely available upon request.
Resonance Raman Spectroscopy
RR spectra were acquired with a Raman spectrometer (Jobin Yvon LabRAM 800 HR) with a back-illuminated CCD detector cooled by liquid nitrogen and an Olympus 20× objective was used for laser focusing onto the sample and light collection in the backscattering geometry. Liquid N2-stored samples were introduced into a pre-cooled liquid N2-cooled cryostat (Linkam), mounted on a microscope stage under strictly anaerobic conditions. The same samples as the ones prepared for EPR were measured with the 458 nm line from an Argon ion laser (Coherent Innova 90c). The spectra were recorded using 500 μW laser power and 10–60 s accumulation time at 77 K. Typically, 10 spectra were co-added in each measurement to improve the signal to noise ratio. All spectra were subjected to polynomial baseline subtraction; the frequencies and widths of RR bands were determined by component analysis using LabSpec software.
Results
Transient Intermediates in the Reaction of PAA and AoCld
Peracetic acid (PAA) is an organic peroxide acting as a two-electron oxidant, which has been used to study the formation of Cpd I and Cpd II in different peroxidases38 and chlorite dismutases (Clds).18,21 The formation and subsequent decay of these intermediates can be followed using UV–vis spectroscopy because they exhibit distinct spectral features. AoCld was rapidly mixed with PAA in a 1:1 volume ratio (final concentration in the optical cell: 350 μM AoCld and 1–40 mM PAA) in the Nanospec to observe the reaction (Figure 1A,C). AoCld and PAA rapidly reacted to form an early intermediate (EI) with maximum absorption of the Soret peak at 403 nm, which has a higher absorptivity than AoCld in its ferric resting state (Figures 1A and S1). Furthermore, the spectrum shows charge transfer (CT) bands with a broad peak around 525 nm comparable with the spectrum of the ferric resting-state enzyme (Figure 1A,C). The rate of formation of this new species from the ferric resting state is so high that the transition happened within the dead time (4 μs) of the Nanospec. Hence, the second-order rate constant k1 for the formation of this initial intermediate could not be determined, but it was assumed to be above 18.8 × 10⁶ M–1 s–1, the kcat/Km of AoCld at pH 7.0. This EI is attributed to the ferric-PAA complex [Fe(III)-OOAc] of AoCld and PAA.
Figure 1.

AoCld pre-steady-state kinetics with PAA and chlorite substrates observed with Nanospec continuous flow UV–vis spectroscopy. PAA substrate: (A,C) 350 μM AoCld and 1 mM PAA, both dissolved in 100 mM KPi, pH 7, were rapidly mixed with a flow rate of 7 mL min–1. Spectra were obtained for 2.5 ms at 29 °C. Chlorite substrate: (B,D) 330 μM AoCld and 50 mM sodium chlorite, both dissolved in 100 mM KPi, pH 7, were rapidly mixed with a flow rate of 20 mL min–1. Spectra were obtained for 700 μs at 29 °C. The reaction occurs so fast that the standard ferric resting state cannot be observed, but it is illustrated as a reference (unreacted sample). Arrows indicate the direction of absorption changes. (E) Reconstructed spectra of the catalytic intermediates of the reaction of PAA and AoCld after SVD analysis. EI, Early Intermediate; CpdI, Compound I; CpdII, Compound II. (F) Reconstructed spectra of the catalytic intermediates of the reaction of sodium chlorite and AoCld. I1, Intermediate 1; I2, Intermediate 2.
The absorptivity of the EI decreased by 30% after 30 μs, and the EI exhibited a new Soret peak with a shoulder at 403 nm and a decreased absorptivity for the CT bands (Figure 1A,C), which is characteristic for Cpd I, as has been described for horseradish peroxidase (HRP).39 The formation of Cpd I was calculated for each experiment (various PAA concentrations) individually (Table S1) and fitted linearly for the PAA concentration range 1–20 mM (Figure S2) with k2,0 = (3.45 ± 0.41) × 103 s–1 and a second-order rate constant k2′ = (0.22 ± 0.04) × 106 M–1 s–1. A second-order rate constant of 1.28 × 10⁶ M–1 s–1 for Cpd I formation from ferric DaCld with PAA has been observed previously.18
The decrease in absorptivity (hypochromicity) stopped at 800 μs before the spectrum started to red-shift to a narrower Soret band at 414 nm with prominent α and β bands at 550 and 530 nm, respectively, which is consistent with the presence of a Cpd II species.39 The absorption at 414 nm increased until 2 ms after the mixing. Cpd I conversion to Cpd II was fitted to a first-order rate constant k3 = (1.69 ± 0.08) × 103 s–1 in the PAA concentration range 1–20 mM (Figure S2). Subsequently, bleaching of the AoCld UV–vis signal was observed, as the spectrum at 414 nm showed decreased intensity (Figure 1A,C). This decay of the Cpd II signal was insignificant in the Nanospec experiments as only the initial 2.5 ms of the reaction was observed. The complete decay of the Cpd II signal was followed in a separate experiment using a conventional spectrophotometer (Figure S3), where the decay of the 412 nm intensity was followed for 45 min. This decay fits to a double exponential curve with rate constants k4 = 8.44 ± 0.41 min–1 and k5 = 0.696 ± 0.021 min–1 at pH 7.0.
The nature of these three distinct species (EI, Cpd I, and Cpd II) was further characterized by EPR. PAA (final concentration 1.5 mM) and AoCld (final concentration 500 μM) were rapidly mixed 1:1 (v/v) in the microsecond freeze-hyperquenching device under similar conditions as in the Nanospec, and the reaction was quenched at different time points. At 9 °C, which is the operating temperature of the MHQ device, Cpd I was expected to form with a time constant τ of circa 1.3 ms, and the conversion of Cpd I to Cpd II was expected to take place with a τ of circa 3.3 ms based on the Nanospec results (Figure 2).
Figure 2.
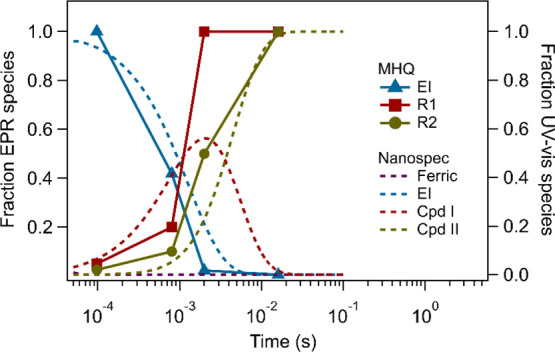
Time traces of the intermediate species of AoCld detected in the MHQ (solid lines) and Nanospec (dashed lines) experiments with PAA as the substrate. The traces from the Nanospec experiments have been recalculated to 9 °C. EI, early intermediate; R1, initially formed radical; and R2, second formed radical.
The EPR spectrum of the sample quenched at 97 μs was dominated by species 1, an axial HS ferric signal that was markedly different from the (less axial) HS ferric signal of the resting state (Figure 3A, Table 1). Furthermore, an isotropic radical signal (species 2) appeared with a g value close to 2 (Figure 3C).
Figure 3.

AoCld pre-steady-state kinetics with PAA and chlorite substrates observed with MHQ-EPR spectroscopy. PAA substrate: (A,C,E) 1.5 mM PAA and 500 μM AoCld, both dissolved in 100 mM KPi, pH 7, were mixed at 9 °C and frozen rapidly. The control experiment consisted of 500 μM AoCld and 100 mM KPi buffer, pH 7, mixed and quenched at 97 μs. The reaction between PAA and AoCld was quenched at 97 μs, 800 μs, 2 ms, and 16 ms after mixing. Chlorite substrate: (B,D,F) 75 mM sodium chlorite and 500 μM AoCld, both dissolved in 100 mM KPi, pH 7, were mixed at 9 °C and frozen rapidly. The reaction between sodium chlorite and AoCld was quenched at 97 μs, 300 μs, 2 ms, and 200 ms after mixing. EPR spectra in (A–D) were obtained with microwave frequency 9.41 GHz, microwave power 20 mW, modulation frequency 100 kHz, modulation amplitude 10 G, and temperature 20 K. EPR spectra in (E,F) were obtained with microwave frequency 9.406 GHz, microwave power 0.2 mW, modulation frequency 100 kHz, modulation amplitude 2 G, and temperature 20 K, and four spectra were averaged.
Table 1. EPR Parameters of AoCld Intermediates.
| resting state | gx | gy | gz |
|---|---|---|---|
| HS broad | 6.70 | 5.02 | 1.99 |
| HS narrow | 6.24 | 5.42 | 1.99 |
| PAA as a substrate | gx | gy | gz | giso | Appa |
|---|---|---|---|---|---|
| species 1, EI | 5.95 | 5.80 | 1.99 | ||
| species 2, R1 | 2.005 | 7.8 | |||
| species 2, R2 | 2.003 | 7.8 |
Species 1 disappeared with time (Figure 3A), while species 2 increased over time (Figure 3C). Analysis of the signal evolution of species 2 at the different time points (Figure S4) shows that the signal is composed of two different radical species: an initially formed radical species with giso = 2.005 (R1) and a second radical that accumulates over time with giso = 2.003 (R2) (Figure 3E). Both radicals exhibited partially resolved hyperfine coupling between 7 and 8 gauss (Figure 3E). These EPR parameters are characteristic for Trp or Tyr radicals.40−42 RR spectra of the AoCld sample quenched at 2 ms upon addition of PAA showed marker bands ν4 at 1379 cm–1 and ν3 at 1507 cm–1, which we attribute to the Cpd II species (Figure S5A). This species was absent in the sample quenched at 0.8 ms, which only contained the ν4 at 1374 cm–1 and ν3 at 1492 cm–1 characteristic for the 5-coordinate high-spin (5cHS) ferric enzyme. The major species observed in RR spectra originate from laser-induced photoreduction (ν4 and ν3 at 1361 and 1475 cm–1, respectively). Formation of this ferrous 5cHS species is inevitable under the employed experimental conditions. Its amount is directly proportional to the exposure of the sample to the laser beam (see the Figure S5 legend for details), and its presence does not affect the interpretation of the physiologically relevant species. RR spectroscopy of a transient intermediate intC of DaCld with PAA quenched after 15 s has been reported for the W227F variant, with ν4 at 1377 cm–1 and ν3 at 1507 cm–1 at pH 5.8 and pH 7.9, respectively.43 These results are consistent with the Cpd II species of AoCld.44,45
Transient Intermediates in the Reaction of Sodium Chlorite and AoCld
AoCld was rapidly mixed 1:1 (v/v) with various sodium chlorite concentrations in the Nanospec (final concentration in the optical cell: 330 μM AoCld and 10–50 mM sodium chlorite), and a new species was formed with a narrow Soret peak at 408 nm and CT bands with a decreased absorptivity compared with the spectrum of the ferric resting state. The sharp Soret band at 408 nm, which has a higher absorptivity than the resting state AoCld, reached its absorption maximum 8 μs after mixing and subsequently started to decrease and blue-shift (Figure 1B). The formation of this species from the ferric resting state occurred entirely within the dead time of the Nanospec (4 μs). Thus, the second-order rate constant k1 could not be obtained, but it was considered to be above 18.8 × 10⁶ M–1 s–1, the kcat/Km of AoCld at pH 7.0.
The decrease in absorptivity stopped after 100 μs as the Soret band shifted to 395 nm (Figure 1B). This experiment was a multiple-turnover experiment of 30–150 turnovers, of which maximally 3–4 turnovers are observable within the timeframe of the experiment (τtotal = 1/kcat = 200 μs). We, therefore, attribute the spectral change to the formation of a second intermediate, the UV–vis spectrum of which is similar to that of the resting state enzyme in the absence of a substrate. Interestingly, the second intermediate signal had a higher absorptivity of the Soret band than the ferric resting state enzyme (Figure 1F), and the broad CT band around 500 nm is blue-shifted (Figure 1D). The measurement of the UV–vis spectrum of AoCld after completion of 50 turnovers of chlorite conversion in a conventional spectrophotometer showed that the enzyme returned to its standard Fe3+ resting-state spectrum after completion of all turnovers and showed no instability (Figure S6).
The first-order rate constant kobs for the intermediate species’ conversion is in the 2 to 4 × 10⁴ s–1 range and shows a negative trend with the chlorite concentration (Table S2, Figures S7 and S8). The time constant τ for the reaction is linearly correlated to the chlorite concentration and hence the number of turnovers (at 50 mM chlorite ∼ 150 turnovers). To choose the correct time points for the MHQ samples for subsequent EPR analysis, the kobs was recalculated for the operating temperature of the MHQ setup. The τ for the intermediate conversion under the MHQ conditions was predicted to be circa 200 μs, while the τtotal for a full turnover was circa 0.9 ms. This indicates that the Nanospec and MHQ experiment timescales overlap (Figure 4).
Figure 4.
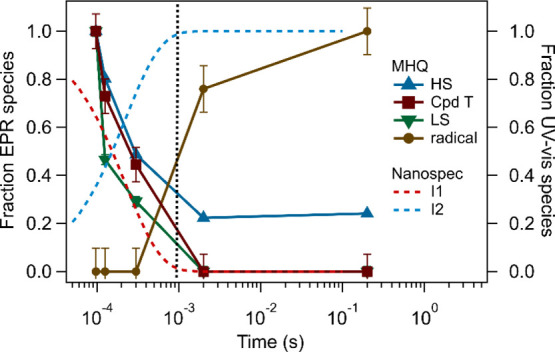
Time traces of the intermediate species of AoCld detected in the MHQ (solid lines) and Nanospec (dashed lines) experiments with chlorite as the substrate. The traces from the Nanospec experiments were recalculated to 9 °C. The vertical dotted line (black) indicates the time constant for a single turnover (τtotal = 1/kcat) recalculated to 9 °C. HS, HS ferric intermediate; Cpd T, triplet-state intermediate Compound T; LS, LS ferric intermediate; radical, amino acid cation radical; I1, intermediate 1; and I2, intermediate 2.
The EPR spectrum of the sample frozen at 97 μs showed four new signals that do not coincide with those of the resting state enzyme. The spectrum was dominated by a HS ferric signal (S = 5/2, gxyz = 5.87, 5.72, and 1.99), which has a more axial character and an increased amplitude compared to the ferric resting state (Figure 3B,D and Table 1, gxyz = 6.70., 5.02, and 1.99 and 6.24, 5.42, and 1.99). The gxy < 6.0 indicates that the signal represents a quantum mechanically spin mixed S = 5/2 and S = 3/2 state (QS).46 This different HS signal indicates that the iron’s environment has changed, but its oxidation state (Fe3+) remained unchanged. We attribute this species to the substrate adduct with chlorite bound to the ferric enzyme, a 6-coordinate HS (6cHS) or QS ferric species.
Two nearly isotropic signals characterized by average effective g values 2.023 and 2.005 (Figure 3D,F) were detected in the 97 μs sample. geff = 2.023 would be an unusually high g-value for an amino acid radical. Indeed, the two signals are found to be part of a single species as indicated by a measurement at two different microwave frequencies 9.403 and 9.620 GHz (Figure 5A). The spectra are identical if the field is normalized by an overall field shift, but they are not identical if the field is normalized on an inverted g-value scale. This shows that the two lines represent zero field splitting (ZFS) due to spin coupling rather than two independent near-isotropic radicals. The signals have the same power saturation behavior and temperature dependence (Figures S9 and S10). In the reaction with PAA, this signal was not observed (Figure 3C,E). The two signals are separated by circa 25 gauss, which is too large to be the result of the hyperfine coupling of a single Tyr or Trp radical species.48 We, therefore, propose that this signal represents a triplet state (S = 1, g ≈ 2.015) resulting from two spin-coupled amino acid-based cation radicals. We designate this triplet-state intermediate as Compound T, or Cpd T. An approximate simulation assuming S = 1 revealed giso = 2.0135 and ZFS parameters D = 0.003 cm–1 and E = 0.00025 cm–1 (Figure 5B). Following the decay of the triplet species, an isotropic radical signal with giso = 2.004 appeared in the millisecond to subsecond timescale (Figure 3D,F, bottom traces), which suggests that this may represent a minor off-pathway intermediate. The signal is similar to species 2 observed in the PAA reaction, although the low abundance of this radical did not allow observation of resolved hyperfine interaction.
Figure 5.

Assignment of the Compound T EPR signal as a triplet-state biradical. (A) Cpd T EPR signal was recorded at two different microwave frequencies: 9.62054 and 9.40333 GHz. The AoCld MHQ sample at 97 μs reaction time with chlorite was measured at microwave frequencies of 9.40333 (blue or red line) and 9.62054 GHz (black line). The blue spectrum shows that the 9.40 GHz spectrum shifted to a field corresponding to that of the 9.62 GHz spectrum. The red spectrum shows that the 9.40 GHz spectrum transformed to the frequency 9.62 GHz. The blue and black spectra overlap, which shows that the spectral features are independent of the frequency; that is, they do not correspond to real g values. The red spectrum (transformed 9.40 GHz) slightly extends beyond the limits of the black spectrum, which again proves that the main spectral features are not real g values, that is, they cannot represent two independent S = 1/2 radicals. (B) Experimental and simulated Cpd T signal of AoCld reacted with chlorite as a triplet-state biradical (blue) or a chlorine-based radical (red). The top trace (black) is the AoCld MHQ 97 μs reaction mixture with chlorite recorded at 9.62054 GHz. The middle trace (blue) is a simulation assuming S = 1, giso = 2.0135, D = 0.0030 cm–1, E = 0.00025 cm–1, and linewidths wz = 0.0045 and wxy = 0.0015 (standard deviation of g strain). The lower trace (red) is a simulation assuming S = 1/2, I (35Cl) = I (37Cl) = 3/2, relative intensity 35Cl/37Cl component = 1:0.32, giso = 2.014, Azyx(35Cl) = 40, 4, and 4 gauss, linewidth Wzyx(35Cl) = 3, 3, and 10 gauss, Azyx(37Cl) = 33, 3.3, and 3.3 gauss, and linewidth Wzyx(37Cl) = 3, 3, and 10 gauss.
Alternatively, the doublet signal centered around g = 2.015 could represent a chlorine-based radical, which is the mechanistic intermediate product that has been proposed previously (Scheme 1). To investigate the possibility of a chlorine-based radical, an EPR simulation was performed using the following conditions: (i) the presence of two different isotropic components in a ratio of 75.76% 35Cl to 24.24% 37Cl, each with a nuclear spin I = 3/2, (ii) the hyperfine splitting of 35Cl is circa 20% larger than that of 37Cl, corresponding to the difference in their nuclear g factor, and (iii) the giso is circa 2.01 for each component. Based on these conditions, we obtained a simulated spectrum that resembles the triplet-state spectrum (Figure 5B). However, in the simulated spectrum, two “satellite signals” are prominently present due to the Cl atom hyperfine splitting, which are absent in the experimental spectrum. Broadening the linewidth of these satellite peaks in the simulation also broadened the signal in the center. We can, therefore, exclude that the experimental signal represents a chlorine-based radical.
A transient LS ferric signal with gzy = 2.98, 2.264 was observed, for which the gx contribution could not be observed but was calculated to be 1.41 (Figure 3D, Table 1). This shows that a transient LS ferric species, formed at 97 μs – 2 ms reaction times, originating from a complex with a strong-field ligand is involved in the Cld mechanism.
The rhombic HS ferric signal (S = 5/2) was partially restored with time (Figure 3B); however, it is clearly different from the ferric resting state HS signal. The reaction between AoCld and chlorite at 200 ms could be approaching steady-state, resulting in multiple overlaying spectra that form an altered signal, which is slightly different from the resting HS signal. We estimate the τtotal for 150 turnovers at 9 °C to be 136 ms, which means that the total conversion is circa 80% complete at 200 ms.
RR spectra of the AoCld sample quenched at 97 μs showed ν4 at 1375 cm–1 and ν3 at 1494 cm–1, which we attribute to the substrate adduct (Figure S5B). Although the bands are not characteristic for the 6cHS ferric species, the ν3 mode is slightly upshifted compared to the 5cHS mode of the resting state enzyme, suggesting an altered electronic structure (1492 cm–1, not detectible in the Figure S5B top trace but consistently present in the RR spectra of other samples). An example of an established 6cHS ferric species, the fluoride adduct of DaCld, has ν3 at 1478 cm–1 for the 6cHS ferric state.49
Discussion
Early Intermediate in the Reaction Mechanism of PAA and AoCld
It is well-established that PAA readily forms Cpd I and Cpd II with heme enzymes. Here, we provide evidence for an EI in the PAA reaction with Cld that has not been previously observed. We attribute the EI to the [Fe(III)–OOAc] complex, which is the product of the first step in the mechanism (Scheme 2). This assignment can be justified by the reconstructed UV–vis spectrum that shows a Soret band with a peak at 403 nm and a higher absorptivity than the resting state spectrum of AoCld and the same broad CT bands around 525 nm as the resting state spectrum (Figures 1E and S1). The EPR signal of the EI is consistent with a HS ferric species with gxy = 5.95 and 5.80 (Table 1 and Figure 3A). The binding step of PAA to the ferric heme is fast and the O–O bond of PAA is cleaved heterolytically to yield Cpd I and an acetate anion with a rate constant of (3.45 ± 0.41) × 103 s–1, which linearly increases with the PAA concentration with a second-order rate constant (0.22 ± 0.04) × 106 M–1 s–1. The UV–vis spectra show a species with decreased absorptivity and Soret absorbance at 401 nm characteristic of Cpd I, although no Cpd I EPR signal at g ∼ 2 that is asymmetric and unsaturated at high power was detected. The cation radical migrates from the porphyrin ring to a nearby amino acid due to electron transfer from one of the aromatic amino acids close to the heme (W127, W155, W156, or Y118), as can be seen at 16 ms reaction time (Figure 3E), and Cpd II is formed with an apparent first-order rate constant of 1.69 × 10³ s–1. The reconstructed UV–vis spectrum (Figure 1E) demonstrates Cpd II hallmark properties39,50 with a narrow Soret band at 414 nm and prominent α and β bands at 550 and 530 nm, respectively. After Cpd II formation, AoCld bleaches out (Figure S3) as it cannot return to its ferric resting state, which makes Cpd II a dead-end for the enzyme in the absence of reducing agents. After prolonged incubation (5–140 s), the axial HS ferric signal characteristic of the free heme becomes visible (Figure S11). The Cpd II signal change in the second to minute time range followed a two-exponential decay. This instability was not observed for AoCld after completing 50 turnovers with chlorite, which showed negligible spectroscopic changes from the resting state ferric enzyme in the time range at least up to 15 min (Figure S6).
Scheme 2. Proposed Reaction Mechanism of the Reaction between AoCld and (I) Peracetic Acid (II) Chlorite Based on Direct Spectroscopic Evidence Presented in This Work.

AA, amino acid.
A direct comparison of our findings with previously reported kinetic studies on Clds is not straightforward, as those have been performed with different artificial substrates, like hypochlorite22 or in the case of PAA reactions, have been performed at different pH values.21 Lee et al. used PAA at pH 7 as an artificial substrate to study the mechanism of DaCld.18 The overall reaction (until Cpd II formation) was slower (τ = 20 ms) than in our study of AoCld (τtotal = 6–9 ms). It is important to note that the PAA concentration used in the study by Lee et al. was 5–200 times lower than in our Nanospec experiments and the temperature was 10 °C and not 29 °C. Consequently, the EI rate of formation could have obscured the observed rate of Cpd I formation in the previous study. Furthermore, the Cpd II formation in AoCld (1.69 × 10³ s–1) is 10 times faster than the Cpd II formation in DaCld (170 s–1), which is partially explained by the temperature difference. Based on the Eyring equation, we can predict a k3 = 423 s–1 at 10 °C for AoCld. It is expected that these two Clds behave similarly as they share a 98% amino acid sequence identity and have similar structural and kinetic properties.
A computational study based on density functional theory (DFT) calculations on the mechanism of the Cld active site with PAA predicted a mechanism involving homolytic cleavage of the O–O bond leading to Cpd II and an acetate radical, followed by rapid electron transfer resulting in Cpd I and an acetate.24 This contradicts our experimental observation that Cpd I is formed first, followed by Cpd II formation, as has been found for DaCld previously.18 In contrast to the computational predictions, the PAA conversion mechanism involves heterolytic O–O bond cleavage.
Heterolytic Cleavage of Cl–O and a Triplet-State (Compound T) Intermediate in the Mechanism of AoCld
The Nanospec and MHQ experiments provide evidence of a new mechanism for the reaction of Cld with its natural substrate chlorite (Scheme 2). AoCld reacts fast with chlorite to form a substrate adduct. Subsequently, the Cl–O bond is cleaved heterolytically to yield a triplet-state intermediate that we designate as Compound T (Cpd T) and hypochlorite (ClO–) as an intermediate reaction product. The existence of Cpd T shows the involvement of a two-electron transfer step, which is evidence of heterolytic, and not homolytic, cleavage of the Cl–O bond. We attribute the triplet state to two weakly coupled amino acid cation radicals. The Nanospec data (Figure 1B,D) provide no evidence for a Cpd I and Cpd II intermediate. A single amino acid radical signal is present after multiple turnovers (Figure 4), which we attribute to the formation of an off-pathway species due to electron transfer from a nearby aromatic amino acid to Cpd T, or to incomplete electron transfer to neutralize Cpd T. The identity of the responsible amino acids remains to be determined (ongoing work), although the nearby aromatic amino acids W127, W155, W156, and Y118 are the most likely candidates. Mutational studies on some of these residues in DaCld and Nitrospira defluvii Cld (NdCld) have been reported.43,51 Wild-type NdCld has 1–2 orders of magnitude lower catalytic efficiency than DaCld. Mutagenesis of the proximal arginine has a large effect on both KM and kcat in DaCld but a much smaller effect on NdCld.52,53 Mutation of W155 and W156 (AoCld numbering) to F, V, or Y in NdCld and F in DaCld resulted in only relatively small changes in the kinetic parameters. The DaCld W155F variant was unstable. No mutations to Ala have been reported for these residues.
A computational study on the reaction mechanism of Cld with chlorite based on DFT calculations predicted homolytic cleavage of the Cl–O bond resulting in a Cpd II and ClO• radical as an intermediate state.25 We did not find evidence for Cpd II formation in the reaction of AoCld with chlorite. The authors considered only Arg183 and His170 as part of the active site and not the aromatic amino acids close to the heme, which may explain the discrepancy.
Taken together, we provide here novel evidence that the commonly used model substrate, PAA, might not be as well-behaved as previously assumed, since an acetate-leaving group could be involved in the reaction. It has been shown that acetate has a negative effect on the activity of AoCld and binds directly to the ferric heme, therefore influencing the UV–vis spectrum.26 Furthermore, the model substrate PAA might not be suitable to predict the actual mechanism as the natural substrate is cleaved heterolytically, but no Cpd I and Cpd II species are involved in the reaction. Therefore, we need to revisit the previously proposed mechanisms of Cld catalysis.
We propose that in a rebound step in the reaction with the natural substrate chlorite, the intermediate product ClO– reacts with the heme group to form a transient LS ferric peroxyhypochlorite complex with concerted two-electron transfer to neutralize Cpd T (Figure 3D). This transient Fe(III)-peroxyhypochlorite species is represented by the transient LS ferric EPR signal (Figure 3D). Alternatively, the transient LS signal may represent the Fe(III)–OH complex. However, the EPR spectrum of transient LS, with gzyx = 2.98, 2.26, (1.41), does not correspond to previously reported spectra for AoCld Fe(III)–OH, with gzyx = 2.54, 2.18, and 1.87.2 Also, for other LS Fe(III)–OH complexes in heme proteins, gz ≈ 2.6 is generally found.54−56
Triplet EPR Spectra Represent the Spin–Spin Interaction of Two S = 1/2 Species
These spectra can be described by their g-value and their ZFS parameters |D| and |E|, which are sensitive to the local symmetry of the spin–spin interaction. Most cases of triplet states in enzymes and proteins involve photoexcited states of aromatic amino acids and cofactors such as chlorophyll and flavins.57 These photoexcited states are transient and decay with a lifetime of milliseconds to seconds even at 77 K. Molecular oxygen also has a triplet state, which exhibits very broad EPR spectra characterized by a very large ZFS parameter D = 3.572 cm–1 observed in condensed phases.58,59
A triplet state has been identified as a transient intermediate in the mechanism of oxygen reduction by a variant of the small laccase SLAC in which only the trinuclear Cu cluster was present and the T1 Cu site was vacant.60 This triplet state was attributed to a Cu2+–Tyr radical pair in which the two spins are exchange-coupled. More recently, a biradical redox state that produced a triplet EPR signal was identified in the pyrroloquinoline quinone (PQQ)-dependent methanol dehydrogenase, which was attributed to a cysteine disulfide radical dipolarly coupled to a PQQ radical.61 Triplet states resulting from the spin–spin interaction between two S = 1/2 species have also been observed in reduced ferredoxins containing two [4Fe–4S] clusters and in di- and trimethylamine hydrogenases containing a flavin radical and a Fe–S cluster.62,63
To the best of our knowledge, no triplet states of natural heme proteins have been reported. A study on photoexcited triplet states in myoglobin reconstituted with Mg-protoporphyrin IX complexes showed triplet EPR signals characterized by ZFS parameters |D| = 0.035 – 0.037 cm–1 and |E| = 0.006 cm–1.64 A recent report on self-assembled J-aggregates of tetrakis(4-sulfonatophenyl)porphyrin in different protonated forms showed photoexcited triplet EPR signals with ZFS parameters |D| = 0.023 – 0.039 cm–1 and |E| = 0.006 – 0.008 cm–1.65 The triplet EPR signal of the AoCld Cpd T intermediate has ZFS parameters that are significantly smaller than for any of the biologically relevant triplet states mentioned above.
A half field EPR signal at a g ≈ 4 signal representing the forbidden ms = −1 ↔ +1 transition is a typical indicator of the triplet state, which unfortunately overlaps with the isotropic (therefore: of relatively high intensity) rhombic HS ferric signal at g = 4.3 of non-specifically bound iron. A small g = 4.3 signal can be seen in all AoCld EPR spectra. Given the small ZFS parameters of the Cpd T signal of AoCld, only a low amplitude signal at half field can be anticipated since the amplitude of the half field triplet signal relative to the high field signal (close to g = 2.0) increases with increasing ZFS.37 Based on the EPR simulation of the Cpd T signal, we expect the g ≈ 4 signal to be of 1000 times lower intensity than the g ≈ 2 signal. The intensity of the half field signal of a triplet species will not be higher in parallel mode EPR.
The overall conversion of the substrate adduct to the second intermediate state and subsequent catalytic cycles occurs at a rate in the range from 2 to 5 × 10⁴ s–1 (Scheme 2), which is considerably faster than the kcat. This supports the fact that the Nanospec data represent pre-steady-state kinetic data of primarily the first turnover (Figure 1B,D), as 80% of the 1900 UV–vis spectra are similar to the second intermediate state. This intermediate state spectrum dominated the subsequent turnovers as the enzyme is approaching a steady state. The total time constant τtotal for 150 turnovers at 29 °C is 30 ms, which is well past the time range of the Nanospec experiments (0.6 ms).
The use of chlorite as an oxidant and halogen donor has been studied for HRP and chloroperoxidase.66 Chlorination of monochlorodimedone to dichlorodimedone by the two enzymes was optimal at low pH values ranging from 2.5 for chloroperoxidase to 4.1 for HRP. Several studies have provided evidence of a Cpd I intermediate as the oxidizing species and released hypochlorite, chlorine dioxide, or chlorous acid as chlorinating species.67,68 More recently, the reaction of chlorite with mammalian myeloperoxidase and lactoperoxidase has been reported.69 After the formation of a transient HS ferric chlorite adduct, both enzymes rapidly inactivated and showed evidence of heme degradation. One-electron oxidation of chlorite to chlorine dioxide by Cpd I and Cpd II preformed with hydrogen peroxide was observed using sequential mixing SF experiments for both enzymes. Our proposal that neither Cpd I nor Cpd II is involved in the natural mechanism of chlorite conversion by Cld may explain why other heme enzymes react so differently and why Cld cannot use chlorite for peroxidation reactions. The high turnover rate is an essential feature of Cld to prevent heme degradation and therefore ensures survival of the bacteria despite a toxic respiratory metabolite.
In this work, we identify new catalytic intermediates for the reaction of AoCld with its natural substrate chlorite (ClO2–), based on the analysis of MHQ and Nanospec data. Therefore, we propose a revised mechanism (Scheme 2) as the previous mechanistic studies on different Clds were predominantly based on artificial substrates, which, at least in the case of PAA, has now been shown to be misleading. We present direct spectroscopic evidence that chlorite binds to the heme iron of AoCld to form a substrate adduct. The substrate adduct is cleaved heterolytically at a high rate to yield a ferric heme and two weakly coupled amino acid radicals in a triplet state. The latter represents a new transient catalytic intermediate Cpd T that can be detected only using the MHQ setup. It is transformed in a rebound step with the intermediate product hypochlorite ClO– to a transient LS ferric peroxyhypochlorite intermediate with concerted two-electron transfer to neutralize Cpd T. The peroxyhypochlorite intermediate cleaves into chloride Cl– and molecular oxygen O2, resulting in the return to the resting-state ferric enzyme. In the newly proposed mechanism, the heme iron remains ferric throughout the catalytic cycle, which may minimize the heme moiety’s reorganization and thereby maximize the enzyme’s catalytic efficiency. Further studies using different pH values and variants of the catalytically important Arg183 and the Trp and Tyr residues that may be responsible for the radical species are in progress to evaluate the newly proposed mechanism in more detail.
Acknowledgments
This research was supported by the grant NWO–CW 711.014.006 from the Council for Chemical Sciences of The Netherlands Organization for Scientific Research. S.T. acknowledges the support from the Project LISBOA-01-0145-FEDER-007660 (Microbiologia Molecular, Estrutural e Celular) funded by FEDER funds through COMPETE 2020—Programa Operacional Competitividade e Internacionalização (POCI) and by national funds through FCT—Fundação para a Ciência e a Tecnologia and from the European Union’s Horizon 2020 Research and Innovation Program through TIMB3 (grant agreements no 810856). This work is dedicated to the late Prof. Simon de Vries, who pioneered the development of the rapid kinetic techniques that have been seminal in this study.
Supporting Information Available
The Supporting Information is available free of charge at https://pubs.acs.org/doi/10.1021/acscatal.1c03432.
SVD analysis, supplementary figures containing the Nanospec data, deconvolution of the R1 and R2 radical spectra, RR spectra, temperature and power dependence of the Cpd T EPR signal, and rate constants from the Nanospec experiments (PDF)
Author Present Address
∥ Institute for Integrative Biology of the Cell (I2BC), CEA, CNRS, Univ. Paris-Sud, Université Paris-Saclay, 91198 Gif-sur-Yvette cedex, France
Author Contributions
J.P and D.M. contributed equally. The article was written through contributions of all authors. All authors have given approval to the final version of the article.
The authors declare no competing financial interest.
Notes
⊥ The described work is part of activities not related to the current position of DCG at Janssen Vaccines & Prevention, a pharmaceutical company of Johnson & Johnson.
Supplementary Material
References
- van Ginkel C. G.; Rikken G. B.; Kroon A. G. M.; Kengen S. W. M. Purification and Characterization of Chlorite Dismutase: A Novel Oxygen-Generating Enzyme. Arch. Microbiol. 1996, 166, 321–326. 10.1007/s002030050390. [DOI] [PubMed] [Google Scholar]
- Hagedoorn P. L.; De Geus D. C.; Hagen W. R. Spectroscopic Characterization and Ligand Binding Properties of Chlorite Dismutase from the Chlorate Respiring Bacterial Strain GR-1. Eur. J. Biochem. 2002, 269, 4905–4911. 10.1046/j.1432-1033.2002.03208.x. [DOI] [PubMed] [Google Scholar]
- Moore G. S.; Calabrese E. J. Toxicological Effects of Chlorite in the Mouse. Environ. Health Perspect. 1982, 46, 31–37. 10.1289/ehp.824631. [DOI] [PMC free article] [PubMed] [Google Scholar]
- Rikken G. B.; Kroon A. G. M.; van Ginkel C. G. Transformation of (Per)Chlorate into Chloride by a Newly Isolated Bacterium: Reduction and Dismutation. Appl. Microbiol. Biotechnol. 1996, 45, 420–426. 10.1007/s002530050707. [DOI] [Google Scholar]
- Nilsson T.; Rova M.; Smedja Bäcklund A. Microbial Metabolism of Oxochlorates: A Bioenergetic Perspective. Biochim. Biophys. Acta, Bioenerg. 2013, 1827, 189–197. 10.1016/j.bbabio.2012.06.010. [DOI] [PubMed] [Google Scholar]
- Gullick R. W.; Lechevallier M. W.; Barhorst T. S. Occurrence of Perchlorate in Drinking Water Sources. J. Am. Water Works Assoc. 2001, 93, 66–77. 10.1002/j.1551-8833.2001.tb09100.x. [DOI] [Google Scholar]
- Urbansky E. T. Perchlorate as an Environmental Contaminant. Environ. Sci. Pollut. Res. 2002, 9, 187–192. 10.1007/bf02987487. [DOI] [PubMed] [Google Scholar]
- Coates J. D.; Achenbach L. A. Microbial Perchlorate Reduction: Rocket-Fuelled Metabolism. Nat. Rev. Microbiol. 2004, 2, 569–580. 10.1038/nrmicro926. [DOI] [PubMed] [Google Scholar]
- WHO . Chlorite and Chlorate in Drinking-Water. Background Document for Development of WHO Guidelines for Drinking-Water Quality. WHO/SDE/WSH/05.08/86; World Health Organisation (WHO), 2005. [Google Scholar]
- Harrison B. S.; Eberli D.; Lee S. J.; Atala A.; Yoo J. J. Oxygen producing biomaterials for tissue regeneration. Biomaterials 2007, 28, 4628–4634. 10.1016/j.biomaterials.2007.07.003. [DOI] [PubMed] [Google Scholar]
- Dassama L. M. K.; Yosca T. H.; Conner D. A.; Lee M. H.; Blanc B.; Streit B. R.; Green M. T.; DuBois J. L.; Krebs C.; Bollinger J. M. Jr. O2-Evolving Chlorite Dismutase as a Tool for Studying O2-Utilizing Enzymes. Biochemistry 2012, 51, 1607–1616. 10.1021/bi201906x. [DOI] [PMC free article] [PubMed] [Google Scholar]
- Rutherford A. W. Photosystem II, the Water-Splitting Enzyme. Trends Biochem. Sci. 1989, 14, 227–232. 10.1016/0968-0004(89)90032-7. [DOI] [PubMed] [Google Scholar]
- Zhu B.; Wang J.; Bradford L. M.; Ettwig K.; Hu B.; Lueders T. Nitric Oxide Dismutase (nod) Genes as a Functional Marker for the Diversity and Phylogeny of Methane-Driven Oxygenic Denitrifiers. Front. Microbiol. 2019, 10, 1577. 10.3389/fmicb.2019.01577. [DOI] [PMC free article] [PubMed] [Google Scholar]
- Streit B. R.; DuBois J. L. Chemical and Steady-State Kinetic Analyses of a Heterologously Expressed Heme Dependent Chlorite Dismutase. Biochemistry 2008, 47, 5271–5280. 10.1021/bi800163x. [DOI] [PMC free article] [PubMed] [Google Scholar]
- Freire D. M.; Rivas M. G.; Dias A. M.; Lopes A. T.; Costa C.; Santos-Silva T.; Van Doorslaer S.; González P. J. The Homopentameric Chlorite Dismutase from Magnetospirillum sp. J. Inorg. Biochem. 2015, 151, 1–9. 10.1016/j.jinorgbio.2015.07.006. [DOI] [PubMed] [Google Scholar]
- Cornish-Bowden A.Fundamentals of Enzyme Kinetics, 4th ed.; Wiley-VCH Verlag GmbH & Co. KGaA: Weinheim, Germany, 2012. [Google Scholar]
- Mitic S.; de Vries S.. Rapid Mixing Techniques for the Study of Enzyme Catalysis. Comprehensive Biophysics; Elsevier, 2012; Vol. 1, pp 514–532. [Google Scholar]
- Lee A. Q.; Streit B. R.; Zdilla M. J.; Abu-Omar M. M.; DuBois J. L. Mechanism of and Exquisite Selectivity for O–O Bond Formation by the Heme-Dependent Chlorite Dismutase. Proc. Natl. Acad. Sci. 2008, 105, 15654–15659. 10.1073/pnas.0804279105. [DOI] [PMC free article] [PubMed] [Google Scholar]
- Mehboob F.; Wolterink A. F. M.; Vermeulen A. J.; Jiang B.; Hagedoorn P.-L.; Stams A. J. M.; Kengen S. W. M. Purification and Characterization of a Chlorite Dismutase from Pseudomonas chloritidismutans. FEMS Microbiol. Lett. 2009, 293, 115–121. 10.1111/j.1574-6968.2009.01517.x. [DOI] [PubMed] [Google Scholar]
- De Geus D. C.; Thomassen E. A. J.; Hagedoorn P.-L.; Pannu N. S.; van Duijn E.; Abrahams J. P. Crystal Structure of Chlorite Dismutase, a Detoxifying Enzyme Producing Molecular Oxygen. J. Mol. Biol. 2009, 387, 192–206. 10.1016/j.jmb.2009.01.036. [DOI] [PubMed] [Google Scholar]
- Mayfield J. A.; Blanc B.; Rodgers K. R.; Lukat-Rodgers G. S.; DuBois J. L. Peroxidase-Type Reactions Suggest a Heterolytic/Nucleophilic O-O Joining Mechanism in the Heme-Dependent Chlorite Dismutase. Biochemistry 2013, 52, 6982–6994. 10.1021/bi4005599. [DOI] [PMC free article] [PubMed] [Google Scholar]
- Schaffner I.; Mlynek G.; Flego N.; Pühringer D.; Libiseller-Egger J.; Coates L.; Hofbauer S.; Bellei M.; Furtmüller P. G.; Battistuzzi G.; Smulevich G.; Djinović-Carugo K.; Obinger C. Molecular Mechanism of Enzymatic Chlorite Detoxification: Insights from Structural and Kinetic Studies. ACS Catal. 2017, 7, 7962–7976. 10.1021/acscatal.7b01749. [DOI] [PMC free article] [PubMed] [Google Scholar]
- DuBois J. L.; Ojha S. Production of Dioxygen in the Dark: Dismutases of Oxyanions. Met. Ions Life Sci. 2015, 15, 45–87. 10.1007/978-3-319-12415-5_3. [DOI] [PMC free article] [PubMed] [Google Scholar]
- Su J.-X.; Chen S.-L. Significant Electron Transfer in Heme Catalysis: The Case of Chlorite Dismutase. J. Catal. 2017, 348, 40–46. 10.1016/j.jcat.2017.02.006. [DOI] [Google Scholar]
- Sun S.; Li Z.-S.; Chen S.-L. A Dominant Homolytic O–Cl Bond Cleavage with Low-Spin Triplet-State Fe(IV)=O Formed is Revealed in the Mechanism of Heme-Dependent Chlorite Dismutase. Dalton Trans. 2014, 43, 973–981. 10.1039/c3dt52171k. [DOI] [PubMed] [Google Scholar]
- Mahor D.; Püschmann J.; van den Haak M.; Kooij P. J.; van den Ouden D. L. J.; Strampraad M. J. F.; Srour B.; Hagedoorn P.-L. A Traffic Light Enzyme: Acetate Binding Reversibly Switches Chlorite Dismutase from a Red- to a Green-Colored Heme Protein. J. Biol. Inorg Chem. 2020, 25, 609–620. 10.1007/s00775-020-01784-1. [DOI] [PMC free article] [PubMed] [Google Scholar]
- Mitić S.; Strampraad M. J. F.; Hagen W. R.; De Vries S. Microsecond Time-Scale Kinetics of Transient Biochemical Reactions. PLoS One 2017, 12, e0185888 10.1371/journal.pone.0185888. [DOI] [PMC free article] [PubMed] [Google Scholar]
- Srour B.; Strampraad M. J. F.; Hagen W. R.; Hagedoorn P.-L. Refolding Kinetics of Cytochrome C Studied with Microsecond Timescale Continuous-Flow UV–Vis Spectroscopy and Rapid Freeze-Quench EPR. J. Inorg. Biochem. 2018, 184, 42–49. 10.1016/j.jinorgbio.2018.04.011. [DOI] [PubMed] [Google Scholar]
- Cherepanov A. V.; De Vries S. Microsecond Freeze-Hyperquenching: Development of a New Ultrafast Micro-Mixing and Sampling Technology and Application to Enzyme Catalysis. Biochim. Biophys. Acta, Bioenerg. 2004, 1656, 1–31. 10.1016/j.bbabio.2004.02.006. [DOI] [PubMed] [Google Scholar]
- Wiertz F. G. M.Electron Transfer and Proton Pumping Pathways in Cytochrome Aa3. Ph.D. Dissertation; Delft University of Technology: Delft, 2008. [Google Scholar]
- Henry E. R.; Hofrichter J. [8] Singular value decomposition: Application to analysis of experimental data. Methods Enzymol. 1992, 210, 129–192. 10.1016/0076-6879(92)10010-b. [DOI] [Google Scholar]
- Johnson K. A. Chapter 23 Fitting Enzyme Kinetic Data with KinTek Global Kinetic Explorer. Methods Enzymol. 2009, 467, 601–626. 10.1016/s0076-6879(09)67023-3. [DOI] [PubMed] [Google Scholar]
- Johnson K. A.; Simpson Z. B.; Blom T. Global Kinetic Explorer: A New Computer Program for Dynamic Simulation and Fitting of Kinetic Data. Anal. Biochem. 2009, 387, 20–29. 10.1016/j.ab.2008.12.024. [DOI] [PubMed] [Google Scholar]
- Johnson K. A.; Simpson Z. B.; Blom T. FitSpace Explorer: An Algorithm to Evaluate Multidimensional Parameter Space in Fitting Kinetic Data. Anal. Biochem. 2009, 387, 30–41. 10.1016/j.ab.2008.12.025. [DOI] [PubMed] [Google Scholar]
- Salmeen I.; Palmer G. Electron Paramagnetic Resonance of Beef-Heart Ferricytochrome C. J. Chem. Phys. 1968, 48, 2049–2052. 10.1063/1.1669014. [DOI] [PubMed] [Google Scholar]
- Lundin A.; Aasa R. A Simple Device to Maintain Temperatures in the Range 4.2–100 K for EPR Measurements. J. Magn. Reson. 1972, 8, 70–73. 10.1016/0022-2364(72)90023-6. [DOI] [Google Scholar]
- Hagen W. R.Biomolecular EPR Spectroscopy; CRC Press: Boca Raton, FL, USA, 2008; pp 1–251. [Google Scholar]
- Yu S.; Girotto S.; Zhao X.; Magliozzo R. S. Rapid Formation of Compound II and a Tyrosyl Radical in the Y229F Mutant of Mycobacterium tuberculosis Catalase-Peroxidase Disrupts Catalase but not Peroxidase Function. J. Biol. Chem. 2003, 278, 44121–44127. 10.1074/jbc.m304757200. [DOI] [PubMed] [Google Scholar]
- Hewson W. D.; Hager L. P. Oxidation of Horseradish Peroxidase Compound II to Compound I. J. Biol. Chem. 1979, 254, 3182–3186. 10.1016/s0021-9258(18)50741-9. [DOI] [PubMed] [Google Scholar]
- Svistunenko D. A.; Wilson M. T.; Cooper C. E. Tryptophan or Tyrosine? On the Nature of the Amino Acid Radical Formed Following Hydrogen Peroxide Treatment of Cytochrome C Oxidase. Biochim. Biophys. Acta, Bioenerg. 2004, 1655, 372–380. 10.1016/j.bbabio.2003.06.006. [DOI] [PubMed] [Google Scholar]
- Stoll S.; Shafaat H. S.; Krzystek J.; Ozarowski A.; Tauber M. J.; Kim J. E.; Britt R. D. Hydrogen Bonding of Tryptophan Radicals Revealed by EPR at 700 GHz. J. Am. Chem. Soc. 2011, 133, 18098–18101. 10.1021/ja208462t. [DOI] [PMC free article] [PubMed] [Google Scholar]
- Svistunenko D. A.; Cooper C. E. A New Method of Identifying the Site of Tyrosyl Radicals in Proteins. Biophys. J. 2004, 87, 582–595. 10.1529/biophysj.104.041046. [DOI] [PMC free article] [PubMed] [Google Scholar]
- Blanc B.; Rodgers K. R.; Lukat-Rodgers G. S.; DuBois J. L. Understanding the Roles of Strictly Conserved Tryptophan Residues in O2 Producing Chlorite Dismutases. Dalton Trans. 2013, 42, 3156–3169. 10.1039/c2dt32312e. [DOI] [PMC free article] [PubMed] [Google Scholar]
- Todorovic S.; Hildebrandt P.; Martins L. O. Surface Enhanced Resonance Raman Detection of a Catalytic Intermediate of DyP-Type Peroxidase. Phys. Chem. Chem. Phys. 2015, 17, 11954–11957. 10.1039/c5cp01283j. [DOI] [PubMed] [Google Scholar]
- Chuang W. J.; Van Wart H. E. Resonance Raman spectra of horseradish peroxidase and bovine liver catalase compound I species. Evidence for predominant 2A2u pi-cation radical ground state configurations. J. Biol. Chem. 1992, 267, 13293–13301. 10.1016/s0021-9258(18)42209-0. [DOI] [PubMed] [Google Scholar]
- Maltempo M. M. Magnetic State of an Unusual Bacterial Heme Protein. J. Chem. Phys. 1974, 61, 2540–2547. 10.1063/1.1682376. [DOI] [Google Scholar]
- Griffith J. S. Theory of E.P.R. in Low-Spin Ferric Haemoproteins. Mol. Phys. 1971, 21, 135–139. 10.1080/00268977100101251. [DOI] [Google Scholar]
- Stubbe J.; van der Donk W. A. Protein Radicals in Enzyme Catalysis. Chem. Rev. 1998, 98, 705–762. 10.1021/cr9400875. [DOI] [PubMed] [Google Scholar]
- Geeraerts Z.; Rodgers K. R.; DuBois J. L.; Lukat-Rodgers G. S. Active Sites of O2-Evolving Chlorite Dismutases Probed by Halides and Hydroxides and New Iron–Ligand Vibrational Correlations. Biochemistry 2017, 56, 4509–4524. 10.1021/acs.biochem.7b00572. [DOI] [PMC free article] [PubMed] [Google Scholar]
- Dunford H. B.Horseradish Peroxidase I. The Native Enzyme, Compounds I and II, Their Structures, and Their Cycle. Peroxidases and Catalases: Biochemistry, Biophysics, Biotechnology and Physiology; Wiley-CH: New York, 2010; pp 13–39. [Google Scholar]
- Hofbauer S.; Gysel K.; Bellei M.; Hagmüller A.; Schaffner I.; Mlynek G.; Kostan J.; Pirker K. F.; Daims H.; Furtmüller P. G.; Battistuzzi G.; Djinović-Carugo K.; Obinger C. Manipulating Conserved Heme Cavity Residues of Chlorite Dismutase: Effect on Structure, Redox Chemistry, and Reactivity. Biochemistry 2014, 53, 77–89. 10.1021/bi401042z. [DOI] [PMC free article] [PubMed] [Google Scholar]
- Kostan J.; Sjöblom B.; Maixner F.; Mlynek G.; Furtmüller P. G.; Obinger C.; Wagner M.; Daims H.; Djinović-Carugo K. Structural and Functional Characterisation of the Chlorite Dismutase from the Nitrite-Oxidizing Bacterium “Candidatus Nitrospira defluvii”: Identification of a Catalytically Important Amino Acid Residue. J. Struct. Biol. 2010, 172, 331–342. 10.1016/j.jsb.2010.06.014. [DOI] [PubMed] [Google Scholar]
- Blanc B.; Mayfield J. A.; McDonald C. A.; Lukat-Rodgers G. S.; Rodgers K. R.; DuBois J. L. Understanding How the Distal Environment Directs Reactivity in Chlorite Dismutase: Spectroscopy and Reactivity of Arg183 Mutants. Biochemistry 2012, 51, 1895–1910. 10.1021/bi2017377. [DOI] [PMC free article] [PubMed] [Google Scholar]
- Brautigan D. L.; Feinberg B. A.; Hoffman B. M.; Margoliash E.; Preisach J.; Blumberg W. E. Multiple Low Spin Forms of the Cytochrome C Ferrihemochrome. EPR Spectra of Various Eukaryotic and Prokaryotic Cytochromes C. J. Biol. Chem. 1977, 252, 574–582. 10.1016/s0021-9258(17)32756-4. [DOI] [PubMed] [Google Scholar]
- Lanne B.; Malmstrom B. G.; Vanngard T. The Influence of pH on the EPR and Redox Properties of Cytochrome C Oxidase in Detergent Solution and in Phospholipid Vesicles. Biochim. Biophys. Acta Bioenerg. 1979, 545, 205–214. 10.1016/0005-2728(79)90200-7. [DOI] [PubMed] [Google Scholar]
- Hagen W. R. Dislocation Strain Broadening as a Source of Anisotropic Linewidth and Asymmetrical Lineshape in the Electron Paramagnetic Resonance Spectrum of Metalloproteins and Related Systems. J. Magn. Reson. 1981, 44, 447–469. 10.1016/0022-2364(81)90279-1. [DOI] [Google Scholar]
- Lubitz W.; Lendzian F.; Bittl R. Radicals, Radical Pairs and Triplet States in Photosynthesis. Acc. Chem. Res. 2002, 35, 313–320. 10.1021/ar000084g. [DOI] [PubMed] [Google Scholar]
- Pardi L. A.; Krzystek J.; Telser J.; Brunel L.-C. Multifrequency EPR Spectra of Molecular Oxygen in Solid Air. J. Magn. Reson. 2000, 146, 375–378. 10.1006/jmre.2000.2175. [DOI] [PubMed] [Google Scholar]
- Kon H. Paramagnetic Resonance of Molecular Oxygen in Condensed Phases. J. Am. Chem. Soc. 1973, 95, 1045–1049. 10.1021/ja00785a009. [DOI] [Google Scholar]
- Tepper A. W. J. W.; Milikisyants S.; Sottini S.; Vijgenboom E.; Groenen E. J. J.; Canters G. W. Identification of a Radical Intermediate in the Enzymatic Reduction of Oxygen by a Small Laccase. J. Am. Chem. Soc. 2009, 131, 11680–11682. 10.1021/ja900751c. [DOI] [PubMed] [Google Scholar]
- Chan S. I.; Chuankhayan P.; Reddy Nareddy P. K.; Tsai I.-K.; Tsai Y.-F.; Chen K. H.-C.; Yu S. S.-F.; Chen C.-J. Mechanism of Pyrroloquinoline Quinone-Dependent Hydride Transfer Chemistry from Spectroscopic and High-Resolution X-ray Structural Studies of the Methanol Dehydrogenase from Methylococcus capsulatus (Bath). J. Am. Chem. Soc. 2021, 143, 3359–3372. 10.1021/jacs.0c11414. [DOI] [PubMed] [Google Scholar]
- Mathews R.; Charlton S.; Sands R. H.; Palmer G. On the Nature of the Spin Coupling between the Iron-Sulfur Clusters in the Eight-Iron Ferredoxins. J. Biol. Chem. 1974, 249, 4326–4328. 10.1016/s0021-9258(19)42521-0. [DOI] [PubMed] [Google Scholar]
- Stevenson R. C.; Dunham W. R.; Sands R. H.; Singer T. P.; Beinert H. Studies on the Spin-Spin Interaction Between Flavin and Iron-Sulfur Cluster in an Iron-Sulfur Flavoprotein. Biochim. Biophys. Acta 1986, 869, 81–88. 10.1016/0167-4838(86)90313-4. [DOI] [PubMed] [Google Scholar]
- Angiolillo P. J.; Vanderkooi J. M. The Photoexcited Triplet State as a Probe of Chromophore-Protein Interaction in Myoglobin. Biophys. J. 1998, 75, 1491–1502. 10.1016/s0006-3495(98)74068-8. [DOI] [PMC free article] [PubMed] [Google Scholar]
- Bolzonello L.; Albertini M.; Collini E.; Di Valentin M. Delocalized Triplet State in Porphyrin J-Aggregates Revealed by EPR Spectroscopy. Phys. Chem. Chem. Phys. 2017, 19, 27173–27177. 10.1039/c7cp02968c. [DOI] [PubMed] [Google Scholar]
- Hollenberg P. F.; Rand-Meir T.; Hager L. P. The Reaction of Chlorite with Horseradish Peroxidase and Chloroperoxidase: Enzymatic Chlorination and Spectral Intermediates. J. Biol. Chem. 1974, 249, 5816–5825. 10.1016/s0021-9258(20)79890-x. [DOI] [PubMed] [Google Scholar]
- Jakopitsch C.; Spalteholz H.; Furtmüller P. G.; Arnhold J.; Obinger C. Mechanism of Reaction of Horseradish Peroxidase with Chlorite and Chlorine Dioxide. J. Inorg. Biochem. 2008, 102, 293–302. 10.1016/j.jinorgbio.2007.09.002. [DOI] [PubMed] [Google Scholar]
- Shahangian S.; Hager L. P. The Reaction of Chloroperoxidase with Chlorite and Chlorine Dioxide. J. Biol. Chem. 1981, 256, 6034–6040. 10.1016/s0021-9258(19)69124-6. [DOI] [PubMed] [Google Scholar]
- Jakopitsch C.; Pirker K. F.; Flemmig J.; Hofbauer S.; Schlorke D.; Furtmüller P. G.; Arnhold J.; Obinger C. Mechanism of Reaction of Chlorite with Mammalian Heme Peroxidases. J. Inorg. Biochem. 2014, 135, 10–19. 10.1016/j.jinorgbio.2014.02.010. [DOI] [PMC free article] [PubMed] [Google Scholar]
Associated Data
This section collects any data citations, data availability statements, or supplementary materials included in this article.