

Abstract

Kidney injury is a complication frequently encountered in hospitalized patients. Early detection of kidney injury prior to loss of renal function is an unmet clinical need that should be targeted by a protein-based biomarker panel. In this study, we aim to quantitate urinary kidney injury biomarkers at the picomolar to nanomolar level by liquid chromatography coupled to tandem mass spectrometry in multiple reaction monitoring mode (LC-MRM-MS). Proteins were immunocaptured from urinary samples, denatured, reduced, alkylated, and digested into peptides before LC-MRM-MS analysis. Stable-isotope-labeled peptides functioned as internal standards, and biomarker concentrations were attained by an external calibration strategy. The method was evaluated for selectivity, carryover, matrix effects, linearity, and imprecision. The LC-MRM-MS method enabled the quantitation of KIM-1, NGAL, TIMP2, IGFBP7, CXCL9, nephrin, and SLC22A2 and the detection of TGF-β1, cubilin, and uromodulin. Two to three peptides were included per protein, and three transitions were monitored per peptide for analytical selectivity. The analytical carryover was <1%, and minimal urine matrix effects were observed by combining immunocapture and targeted LC-MRM-MS analysis. The average total CV of all quantifier peptides was 26%. The linear measurement range was determined per measurand and found to be 0.05–30 nmol/L. The targeted MS-based method enables the multiplex quantitation of low-abundance urinary kidney injury biomarkers for future clinical evaluation.
Keywords: quantitative bottom-up proteomics, protein markers, LC-MRM-MS, kidney injury, urine, low-abundance biomarkers
Introduction
The occurrence of kidney injury contributes significantly to in-hospital patient morbidity and mortality.1 Acute kidney injury (AKI) is a clinical syndrome defined by the rise of serum creatinine and a reduction in urinary output.2 Because of the delayed response of serum creatinine, early kidney injury frequently remains unnoticed until a significant decline in kidney function has occurred.3 Moreover, clinicians currently lack frequent noninvasive diagnostic tools to differentiate acute kidney injury (AKI) with an often transient prerenal cause from intrinsic renal damage, such as established acute tubular necrosis (ATN).4 The early and specific detection of kidney injury, prior to the decline of serum-creatinine-based kidney function, was identified as an unmet clinical need in routine patient care through a structured questionnaire developed by the European Federation of Clinical Chemistry and Laboratory Medicine (EFLM).5,6 To address this clinical need, we defined a protein-based biomarker panel including the early injury markers kidney injury molecule-1 (KIM-1), neutrophil gelatinase-associated protein (NGAL), tissue inhibitor of metalloproteinases 2 (TIMP2), insulin-growth factor binding protein (IGFBP7), inflammatory chemokine ligand 9 (CXCL9), and fibrosis marker transforming growth factor β-1 (279TGF-β1390, without latency-associated peptide, 30LAP278), and kidney tissue-enriched proteins nephrin, cubilin, solute carrier family 22 member 2 (SLC22A2), and uromodulin.5 Currently, no multiplex test is available for the quantitation of these proteins in urinary samples. We propose that a combination of early injury and biology-driven markers could detect kidney injury while gaining insight into the most likely site of injury.
Quantitation of proteins from complex biological matrices in the clinical chemistry laboratory is typically realized through immunoassays or mass-spectrometry (MS)-based tests.7−10 In MS-based quantitative bottom-up proteomics, proteins are enzymatically digested into peptides, which are quantified to represent the original protein concentration.11−13 Urine specimens are highly variable in composition and concentration; in particular, proteinuria and hematuria may challenge protein quantitation.14 The combination of the immunocapture of target proteins and liquid-chromatography coupled to tandem mass spectrometry in multiple reaction monitoring mode (LC-MRM-MS) has been shown to enable the robust quantitation of low-abundance proteins below 1 nmol/L.9 Through the selection of multiple proteotypic peptides per protein and multiple mass transitions per peptide, a high biological and analytical selectivity may be achieved.15
The clinical and analytical performance specifications for the intended kidney injury biomarker panel should be set prior to method development,16,17 yet limited insight into the relationship between the analytical performance and the clinical outcome is available. Moreover, there is a large biological variation in the protein biomarker concentration in urine, which will result in a large allowable measurement uncertainty.18,19 Therefore, the total allowable error (TEa) of the intended test should be set based on the state of the art.19 Thus far, MS-based methods have been reported for the singleplex quantitation of NGAL20,21 and uromodulin22,23 and the quadruplex analysis of urinary proteins including NGAL.24 In these studies, the achieved analytical precision of protein quantitation from urine with LC-MRM-MS was typically 8–20%.21,24 Here we define a desirable TEa of ≤25% based on expert opinion. Moreover, at least two proteotypic peptides should be included per protein. Three MRM transitions should be monitored per peptide, carryover should be <1% and not affect the biomarker quantitation, and linearity needs to be achieved (r > 0.975) over the expected clinical measurement range.
We previously developed and showed the long-term robust performance of a multiplex MS-based test for serum apolipoprotein quantitation.25,26 In this study, we aim to develop a multiplex LC-MRM-MS test for the quantitation of our proposed kidney injury biomarker panel that fulfills predefined analytical performance specifications. To allow the quantitation of the low-abundance proteins in the panel from variable urine matrices, we introduced immunocapture prior to proteolytic digestion and LC-MRM-MS analysis. The method is provisionally validated with an emphasis on the analytical selectivity, carryover, matrix effects, linearity, and imprecision.
Material and Methods
Reagents and Materials
All solvents were LC-MS grade and the reagents used were of the highest available purity. Sample preparations and instrumental conditions are detailed in the Supporting Information Section S1, Detailed Material and Methods.
Patient Samples, Calibration Strategy, and Quality Control
Ten fresh midstream spot urines were collected from apparently healthy donors, centrifuged at 3000g for 8 min at room temperature (RT), and pooled for calibrator (CAL) preparation. CAL1 was the native urine pool without protein spiking, and CAL2, CAL3, CAL4, and CAL5 were spiked with recombinant target proteins to prepare five calibrator levels spanning the range of measurement. The relationship between increasing amounts of spiked recombinant protein and the biomarker relative response in LC-MRM-MS was used to target the biomarker concentrations in the calibrators. The baseline native biomarker concentrations of CAL1 were determined by taking the x-intercept in the linear regression analysis of CAL2–CAL5. The calibrators were assigned values in molar units by calculating the estimated mass from the amino acid sequence of recombinant proteins provided by the manufacturer (Supporting Information Section S1. Detailed Material and Methods). Two quality-control (QC) samples, QC1 and QC2, were prepared from two individual leftover and deidentified urine samples from routine clinical care. Three additional QC samples were prepared from a urine pool and spiked with recombinant target proteins. Single-use aliquots were stored at −80 °C until LC-MRM-MS analysis. The LC-MRM-MS test was piloted among 20 deidentified urine samples of patients with AKI.
Peptide Selection
Target proteins were digested in silico using the ExPASy PeptideMass tool (web.expasy.org/peptide_mass) to list all tryptic peptides. Subsequently, tryptic peptides of TIMP2, IGFBP7, NGAL, KIM-1, nephrin, CXCL9, calbindin, 279TGF-β1390, uromodulin, cubilin, and SLC22A2 were identified by product-ion scans. Two to three signature peptides per protein were selected based on the detectability in MS, protein uniqueness, and nonsusceptibility to biological and chemical modifications.15 Per protein, the peptide with the most favorable digestion kinetics, yielding stable results, was selected for quantitation, whereas the other peptide(s) were used for confirmation.25 For all selected peptides, synthetic unlabeled and stable-isotope-labeled (SIL) ([13C6, 15N2]-lysine, or [13C6, 15N4]-arginine) peptides were synthesized and assessed for their purity by our in-house peptide synthesis facility.
Sample Preparation Optimization
Polyclonal antibodies were selected for immunocapture to maximize protein capture with analytical specificity obtained by MS read-out. Biotinylated antibodies were immobilized separately per antigen type on streptavidin-coated magnetic beads and washed three times with phosphate-buffered saline (PBS). The beads with immobilized antibodies were mixed just before urine sample addition. For immunocapture, the minimum amount of antibody and the linear capture range was examined through the serial dilution of a urine sample with PBS, and the incubation time and temperature were optimized. The efficiency of the enzymatic proteolysis of immunocaptured proteins from a 50 μL urinary sample was studied by increasing the incubation time with 0.4 μg trypsin at 37 °C.
In the final sample preparation procedure, proteins were captured from a 50 μL urinary sample. Subsequently, 1.5 nM SIL peptides for each measurand were added as the internal standard (IS). Five mM tris(2-carboxyethyl)phosphine (TCEP) was added to reduce disulfide bonds, and proteins were denatured at 56 °C for 30 min. Cysteine residues were alkylated with 5 mM iodoacetamide (IAM) for 30 min at RT followed by an 18 h incubation with 0.4 μg trypsin at 37 °C. To quench the enzymatic digestion, we added 0.5% (v/v) formic acid to obtain pH 3. The relative response (RR), which is the ratio of the analyte peak to the IS peak, was converted to biomarker concentration in pmol/L by an external calibration curve.
LC-MRM-MS Analysis and System Suitability Testing
The LC-MS/MS measurements were performed on a 1290 ultraperformance liquid chromatography (UPLC) system coupled to a triple–quadrupole mass spectrometer (Agilent Technologies, Santa Clara, CA). Peptide separations were performed on a Zorbax SB-C18 column 2.1 × 50 mm, 1.8 μm (Agilent Technologies) at a flow rate of 0.3 mL/min. The LC-MS/MS instrument performance was monitored through a system suitability test (SST), in which a system suitability sample (SSS), containing synthetic labeled peptides and their unlabeled counterparts, was measured in five replicates prior to and after each sample batch. The acceptance criteria were: RR Coefficient of Variation < 10% for each peptide, retention time drift ≤0.2 min, and qualifier ratio CV < 20%.
Provisional Method Validation
The analytical selectivity, carryover, matrix effects, linearity, and imprecision of the LC-MRM-MS method were examined using the two individual native QC samples and three urine-based spiked QC samples. The analytical selectivity was obtained by measuring at least two to three proteotypic peptides per protein and three MRM transitions per peptide. The carryover was evaluated by injecting a blank sample immediately after an SSS and through the intermitted measurement of samples with high and low concentrations.27 Ion suppression in electrospray ionization (ESI) was examined by the postextraction spiking of the IS in five prepared urinary samples, with and without proteinuria and hematuria.28 The effect of total urinary protein on the linearity of the method was studied by urine specimen admixing. The linearity of the LC-MRM-MS method was evaluated by admixing the lowest and highest urine-based calibrators.28 The within-run and total imprecision were evaluated by measuring five samples in five replicates over five days.
Data Analysis
Mass Hunter Workstation software, version 10.0 (Agilent Technologies) was used for peak integration, and GraphPad Prism version 8.0.1 (GraphPad Software, San Diego, CA) was used for data analysis. The transition list is available at the PeptideAtlas selected reaction monitoring (SRM) experiment library (PASS01687). The analytical linearity was assessed by a comparison of the goodness-of-fit in polynomial and linear regression analysis. The within-run and total imprecision were determined by one-way analysis of variance (ANOVA) according to the CLSI-EP15 protocol.29 EP Evaluator (12.0.0.11, Data Innovations, Burlington, Vermont) was used to assess the carryover.
Results
Signature Peptide Selection for Protein Quantitation
Candidate peptides from the proteins KIM-1, NGAL, TIMP2, IGFBP7, nephrin, SLC22A2, calbindin, CXCL9, 279TGF-β1390, cubilin, and uromodulin were identified from tryptic digests of recombinant and purified proteins. For the 11 proteins, a total of 60 signature peptides were selected for quantitation based on the uniqueness, enzymatic digestion kinetics and nonsusceptibility to miscleavages, biological and chemical modifications, and stable performance in LC-MRM-MS analysis (Table S1). At least two peptides were selected per protein, with one serving as a quantifying peptide and the other(s) used for qualification. The selected peptides and MRM transitions are provided in Table S2. Cysteine-containing peptides were excluded for quantitation purposes, and peptides with chemically unstable methionine (M) and tryptophan (W) residues were avoided when possible. However, because of the limited availability of tryptic peptides from 279TGF-β1390 (13 kDa), the methionine-containing peptide VEQSLNMIVR was selected for quantitation. Carbamidomethylation (cm) of cysteine residues enabled measurement of the stabilized products CcmSCcmISTNQGTIHLQSLK (CXCL9), FFACcmIK (TIMP2), ALDTNYCcmFSSTEK (279TGF-β1390), and STEYGEGYACcmDTDLR (UMOD) for protein qualification.
LC-MRM-MS Performance
For all 60 peptides, three product ions were monitored, resulting in 180 transitions with a minimum dwell time of 8.5 ms (Table S2). The LC gradient was optimized for all 60 peptides to elute between 1 and 10 min (Figure 1A). Using the SST, the LC-MS instrument performance was monitored during all experiments. For the SST, a 0.15 μM mixture of 30 synthetic peptides and their SIL analogues was measured five times prior to and five times after the sample run. The within-run CV on the RR, between the non labeled and labeled peptides, of the SST was 1–8% (N = 10) (Table S2).
Figure 1.

Sample preparation workflow and LC-MRM-MS chromatograms of the kidney injury biomarker panel in a system suitability sample and in urine. (A) LC-MRM-MS chromatogram of the system suitability samples with signature peptides annotated. (B) Workflow urine sample preparation combining immunocapture and enzymatic digestion prior to LC-MRM-MS analysis. (C) LC-MRM-MS chromatogram of peptides from recombinant proteins spiked and immunocaptured from urine. (D) LC-MRM-MS chromatogram of peptides from native proteins present in the pooled urine of healthy individuals.
Sample Preparation Optimization
The immunocapture of low-abundance target proteins minimizes the urine matrix effects and improves the analytical sensitivity (Figure 1B). For each target protein, biotinylated antibodies were immobilized on streptavidin-coated beads prior to the addition of 50 μL of urinary sample. Maximal immunocapture with a recovery of ±90% was achieved with 2 h of incubation at RT (Figure S1). The upper limits of quantitation (ULoQs) for higher abundant proteins NGAL and IGFBP7 were 50 and 5 nmol/L, respectively. For midabundant proteins, the ULoQs were 10 nmol/L for KIM-1, 30 nmol/L for TIMP2, and 2 nmol/L for CXCL9.The immunocapture of lower abundant proteins SLC22A2 and nephrin was linear up to 1 and 2 nmol/L, respectively (Figure S2). The urinary concentration of uromodulin is at least 50 times higher compared with that of the other biomarkers; however, coprecipitation by nonspecific binding enabled the semiquantitative measurement of uromodulin in the final multiplex test. In contrast with the other 10 proteins, calbindin could not be quantified from urinary samples through our multiplex immunocapture protocol and used reagents.
To achieve stable and absolute protein quantitation through the RR, the net product of peptide formation and degradation needs to be in equilibrium. Time-course digestion kinetics for the proteins KIM-1, IGFBP7, TIMP2, NGAL, nephrin, CXCL9, 279TGF-β1390, and uromodulin yielded a stable maximum peptide response upon overnight trypsin digestion (Figure S3). Two proteins, IGFBP7 and NGAL, digested relatively slowly. The miscleaved peptide TELLPGDR|DNLAIQTR was monitored in addition to TELLPGDR and DNLAIQTR and confirmed the slow digestion of IGFBP7, and good interpeptide agreements were reached by overnight digestion (Figure 2). Because overnight incubation yielded stable digestion for all peptides, 18 h was selected as the final incubation time.
Figure 2.
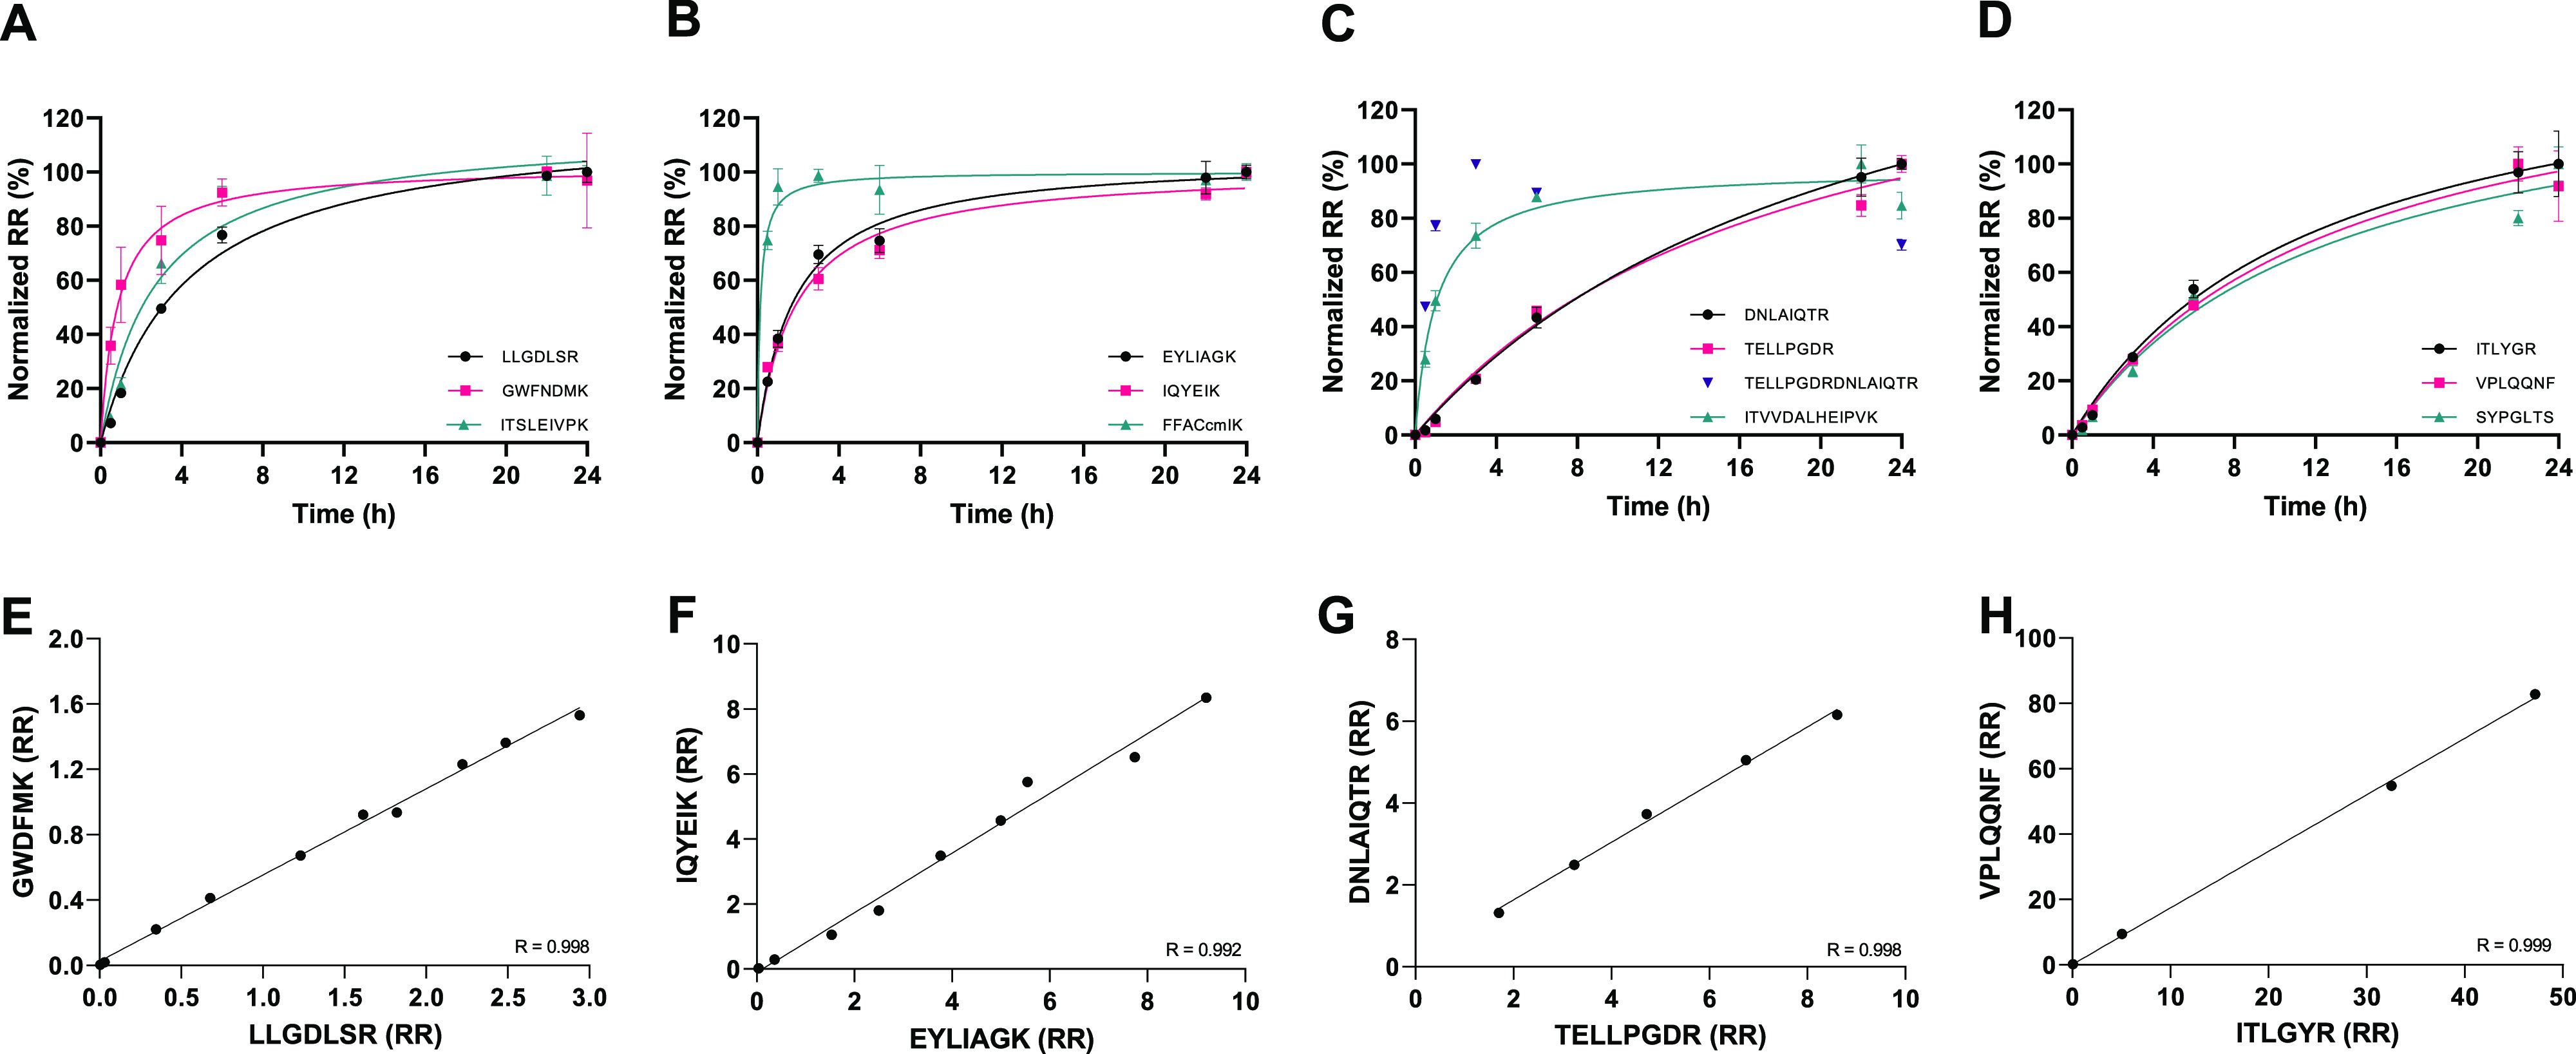
Evaluation of the digestion kinetics and peptide comparison of KIM-1, IGFBP7, TIMP2 and NGAL. Target proteins were immunocaptured from urine and digested with a constant amount of trypsin. The formed peptides were monitored over time, and the results were normalized to t = 24 h. Results are shown for (A) KIM-1, (B) TIMP2, (C) IGFBP7, and (D) NGAL. To verify the maximal protein digestion at 18 h, we compare the response of the quantifier and qualifier peptides of the same protein for (E) KIM-1, (F) IGFBP7, (G) TIMP2, and (H) NGAL. The relative response (RR) is obtained by an evaluation of the linearity, and the interpeptide correlation (R) is given.
Protein and Peptide Detectability in Urinary Samples
The multiplex method was developed based on purified proteins spiked in pooled urine. Except for calbindin, all proteins could be detected by 25 of the 30 peptides originally included in the multiplex panel (Figure 1C). Specifically, peptides ALDTNYCcmFSSTEK (calbindin), TFVDQYGQR (calbindin), AGLELSPEMK (calbindin), EQLANPIVSSGNSLFR (cubilin), and SPGVAELSR (SLC22A2) could not be identified due to discrepant qualifier transitions or a poor signal-to-noise ratio (S/N < 10). Yet for clinical chemistry purposes, the biomarkers should be detectable from native urinary samples. The biomarkers uromodulin, IGFBP7, NGAL, TIMP2, KIM-1, CXCL9, and cubilin could be detected in urinary samples from healthy individuals (N = 10), whereas SLC22A2, 279TGF-β1390 and nephrin were not observed (Figure 1D). In addition, CXCL9 could be quantified by a single peptide only in a healthy urine pool because the signal response of the qualifier peptides CcmSCcmISTNQGTIHLQLSK (CXCL9) was too low. Because increased biomarker levels are expected in individuals with kidney damage, all 10 biomarkers in the multiplex panel were eligible for further analytical evaluation.
Calibration
For NGAL, KIM-1, TIMP2, nephrin, SLC22A2, CXCL9, and 279TGF-β1390 the external calibration strategy enabled the interpolation of the QC samples. A five-point calibration curve for TIMP2, KIM-1, and nephrin, a four-point calibration for NGAL, CXCL9, and SLC22A2, and a two-point calibration for 279TGF-β1390 were appointed (Table S3). A calibration strategy based on recombinant protein spiking was not feasible for the relatively larger proteins cubilin (3623 AA) and uromodulin (640 AA) because (nearly) full-length recombinant proteins were not available. Because of the poor antibody affinity for the recombinant protein, an alternative calibration strategy was developed for IGFBP7 quantitation, in which the native urine-based calibrator CAL1 was value-assigned by an immunoassay. For all biomarkers, a true zero was obtained by applying the full sample preparation to a sample containing only diluent PBS.
Provisional Analytical Validation
The test was evaluated for analytical selectivity, carryover, matrix effects, linearity, and imprecision. An overview of the validation strategy, predefined criteria, and performance characteristics of the multiplex test is given in Table 1. The final 10-plex test enables the quantitation of NGAL, IGFBP7, TIMP2, KIM-1, CXCL9, nephrin, and SLC22A2 and the detection of 279TGF-β1390, cubilin, and uromodulin from urinary samples.
Table 1. Overview of the Multiplex LC-MRM-MS Test Results.
| parameter | strategy | desirable criteria | performance results |
|---|---|---|---|
| selectivity and interferences | proteotypic peptides per protein | min. 2 | two to three proteotypic peptides per protein |
| multiple MRM transitions per peptide | min. 3 | one quantifier and two qualifier product ions | |
| ion ratio monitoring in biological matrix urine for agreement with SSS | H0: μQual ratioSSS = μQual ratiourine | no difference (p > 0.05), except for cubilin, TGF-β1, and calbindin | |
| CV < 20% | CV < 20%, except for cubilin, TGF-β1, and calbindin | ||
| carryover | blank after SSS | <1% | ≤0.9% for all peptides |
| specimen-to-specimen carryover (EP10) | carryover <3*low-low SD | carryover < than error limit (pass)a | |
| matrix effects (MEs) | postextraction spiking of IS to asses matrix effect ion suppression in ESI | absolute ME < 15% | ±15% signal intensity reduction compared with signal in LC eluent A |
| area CV < 15% | CV < 12% for all quantifier peptides | ||
| admixing samples with high total protein and hematuria samples | r > 0.975 | r ≥ 0.958, quantitation was not affected by proteinuria or hematuria | |
| linearity | admix sample low and sample high, N = 9 in triplicate | r > 0.975 (range specified per measurand) | r ≥ 0.975 for NGAL,TIMP2, KIM-1, NGAL, SLC22A2, and CXCL9; r = 0.824 for nephrin |
| by dilution of CAL1 (N = 5) in duplicate | r > 0.975 | r ≥ 0.995 for uromodulin and IGFBP7; no linear correlation obtained for cubilin and TGF-β1 | |
| peptide agreement | r > 0.975 | r ≥ 0.991 for NGAL,TIMP2, IGFBP7, KIM-1, nephrin, SLC22A2, CXCL9, and UMOD; no linear correlation obtained for cubilin and TGF-β1 | |
| imprecision | within-run imprecision by measuring five QC samples in five replicates | CVwr < 15% | AV CV = 13.3% for NGAL, 4.7% for IGFBP7, 11.4% for KIM-1, 9.7% for TIMP2, 8.2% for nephrin, 8.3% for CXCL9, 34.2% for SLC22A2, 15.1% for UMOD, 19.6% for TGF-β1, and 20.3% for cubilin |
| total imprecision by measuring five QC samples in five replicates over 5 days | CVtot < 15% | average CVtot = ±26% depending on the measurand and concentration level |
No data for peptides from TGF-β1 or cubilin due to poor response (S/N < 10) in urine of healthy individuals. AV, average over five QC samples; CVwr, within-run imprecision; CVtot, total imprecision; CV, coefficient of variance; r, Pearson’s r in linear regression.
Analytical Selectivity and Interferences
Analytical selectivity was achieved for NGAL, TIMP2 KIM-1, IGFBP7, CXCL9, SLC22A2, and uromodulin through monitoring of the ion ratio, which is the ratio of peak quantifier to peak qualifier, of two qualifier product ions. The variance in the ion ratio’s in the SSS was CV < 20% (n = 5) for NGAL, TIMP2, KIM-1, IGFBP7, CXCL9, SLC22A2, and uromodulin. For the cubilin, calbindin, 279TGF-β1390, the ion ratios exceeded the set imprecision of 20%, and these proteins were considered invalid for quantitation by the multiplex test. No difference in the qualifier ion ratios in the urine-matrix based CAL5 compared with the neat SSS were identified (p ≥ 0.1), with the exception of one qualifier ratio for peptide EQAGEPK (cubilin), which may indicate urinary interferences but can also be explained by the relatively low signal intensity of cubilin in the native urine sample (Table S4). A minimum of two proteotypic peptides were included per protein to ensure selectivity. Except for cubilin, 279TGF-β1390, and calbindin, the interpeptide comparison resulted in a linear agreement for each protein (Pearson’s r ≥ 0.991) (Figure S4).
Carryover
There is a risk for sample carryover in continuous-flow LC-MS/MS measurement systems. In our setup, carryover in the SSS was <1% for all peptides, with the highest carryover of 0.9% for peptide SYPGLTSYLVR (Table S2). Additionally, NGAL, IGFBP7, TIMP2, KIM-1, and nephrin were measured in three urinary samples (low, mid, high concentrations) according to the EP10 guidelines. All tested analytes passed the criterion (three times the low-low SD as the error limit), indicating that the extent of carryover (<1%) did not affect the quantitation of NGAL, IGFBP7, TIMP2, KIM-1, or nephrin (results not shown).
Matrix Effects
Urine specimens are highly variable in composition and concentration, which poses challenges for robust quantitation. Urine-specimen-dependent matrix effects were minimized by the introduction of the immunocapture procedure prior to enzymatic digestion and LC-MRM-MS analysis (Figure 3A). Post-extraction spiking of the IS in five urinary samples (with increasing total protein concentration) resulted in an average absolute matrix effect of 15% compared with the positive control (IS in mobile phase A). The variation in matrix effects was <12% for all quantifier peptides, and proteinuria and hematuria did not affect the extent of ion suppression (Table S5). In addition, linearity in quantitation was maintained (r > 0.975) when admixing native specimens with low (0.06 g/L) and high (5.73 g/L) total urinary protein and hematuria (Figure 3B, Figure S5).
Figure 3.

Evaluation of urine matrix effects, linearity, and total imprecision. (A) Five urine samples with varying total protein were prepared with and without immunocapture, and the total matrix effect was evaluated by the postextraction spiking of the IS in mobile phase A (control, 0% matrix effect) prior to LC-MRM-MS analysis. (B) A urine specimen with 0.06 g/L total protein and a specimen with 5.75 g/L and hematuria were admixed to test for matrix affects (n = 3). (C) Analytical linearity by urine specimen admixing to obtain nine increasing calculated and experimental measured concentrations for linear regression analysis. (D) Total imprecision, CVtot (%), evaluated by measuring five samples in five replicates over 5 days (boxplot with minimum, mean. and maximum). The results are shown for peptide EYLIAGK (TIMP2) in panels A–C and for all quantifier peptides in the biomarker panel in panel D.
Linearity
The linearity was determined by the admixing of a low native urine sample pool and a high urine sample pool supplemented with measurand at the estimated maximal expected concentration per protein. Proportional mixing resulted in linearity over the expected concentration range for NGAL (862–5862 nmol/L), TIMP2 (157–5157 pmol/L), KIM-1 (29–5029 nmol/L), CXCL9 (2–1002 pmol/L), and SLC22A2 (50–300 pmol/L) (all Pearson’s r ≥ 0.975). A linear measurement range was obtained for nephrin over 5–1005 pmol/L with a correlation coefficient of r = 0.824. For IGFBP7, uromodulin, and cubulin, the linearity was assessed by increasing the urine sample volume. A correlation in the linear regression was obtained for IGFBP7 (1–2000 pmol/L, r = 0.998) and uromodulin (0–6 AU, r = 0.995) but not for 279TGF-β1390 and cubilin (sigmoidal, r = 0.989) (Figure 3C, Figure S6).
Imprecision
The kidney injury biomarker panel was quantified in five human urine-based QC samples in five replicates over 5 days, yielding an overall within-run CVwr of 12.1–18.4% for NGAL, 5.1–11.7% for IGFBP7, 3.9–18.1% for TIMP2, 8.1–15.5% for KIM-1, 5.8–11.2% for nephrin, 6.8–9.5% for CXCL9, 8.2–24% for uromodulin, and 16.2–46.8% for SLC22A2 (minimal and maximal imprecision depending on the concentration level) (Supplementary Table 6). The total CV (CVtot) of quantifier peptides calculated over 5 days was 12.8–38.1% for NGAL, 9.4–17.7% for IGFBP7, 13.3–25.8% for TIMP2, 14.3–32.5% for KIM-1, 14–20.3% for nephrin, 8.6–16.4% for CXCL9, 23–51.2% for uromodulin, and 45.8–75.6% for SLC22A2 (Figure 3D, Table S6). The within-run and total CVs were typically higher for concentrations below the lowest calibrator, which was the case for SLC22A2 (11 pmol/L, CVwr = 46.8).
Analysis of Patient Samples
The biomarker panel was piloted among patients with AKI (n = 20). The proteins NGAL, IGFBP7, TIMP2, KIM-1, CXCL9, and uromodulin were detectable in urine samples from this target population, and concentrations were within the linear range and below the ULoQ. The median biomarker concentrations were 1820 pmol/L (IQR: 183–11421 pmol/L) for NGAL, 983 pmol/L (IQR: 340–2168 pmol/L) for IGFBP7, 314 pmol/L (IQR: 108–1562 pmol/L) for TIMP2, 88 pmol/L (IQR: 27–274 pmol/L) for KIM-1, 6 pmol/L (IQR: 1–24 pmol/L) for CXCL9, and 0.11 RR/RR CAL1 (IQR: 0.01–1.03 RR/RR CAL1) for uromodulin.
Discussion
Kidney injury is a frequent complication in tertiary care centers and contributes to patient morbidity and mortality. Insufficient recovery of kidney function after an AKI episode can progress to chronic renal dysfunction, including the need for renal replacement therapy.30 Adequate monitoring of patients at risk and early intervention could improve clinical outcome. Yet clinicians are in need of early diagnostic tools that identify patients with or at risk for progressive kidney injury and provide information about the kidney pathology.4,5 In our search for a “troponin” test for kidney injury, a panel of biomarkers associated with AKI in clinical studies and biology-driven proteins had to be selected, encompassing the early injury markers NGAL, IGFBP7, TIMP2, and KIM-1, inflammation marker CXCL9, fibrosis marker 279TGF-β1390, and tissue-enriched proteins nephrin (glomerulus), SLC22A2, cubilin (proximal tubules), calbindin (distal tubules), and uromodulin (distal tubules and loop of Henle).5
We decided to compose a multiplex test to address each of the unmet clinical needs in kidney injury. Currently, in vitro diagnostics tests are available that determine only one or two proteins in a single test.31−33 For the biomarkers TIMP-2 and IGFBP7, a diagnostic test with CE (European Conformity) marking and U.S. Food and Drug Administration (FDA) clearance is available, the NephroCheck Test, but this test merely reports the product of the mass concentrations of the two biomarkers.33 Transference studies should be conducted for NGAL and uromodulin because single-plex in vitro diagnostic immunoassay tests are available.34−36 Because a single and selective kidney injury marker does not exist and because the clinical performances of emerging uniplex tests like NGAL demonstrated moderate clinical performance, we decided to opt for a biomarker panel and to prioritize the clinical evaluation of the selected multiplexed markers in translational research studies to eventually address the clinical need for early and specific kidney injury detection.19
The LC-MRM-MS technology was selected for test development because it allows for multiplexed testing and the direct quantitation of the proteotypic peptides, which is considered the preferred strategy for protein quantitation with high analytical selectivity.37 The selection of signature peptides is of utmost importance in protein quantitation by LC-MRM-MS. Previously, MS-based methods were developed for uromodulin and NGAL.20,22−24 The study by Hammond et al. selected STEYGEGYACDTDLR and DWVSVVTPAR, and Fu et al. included the peptides YFIIQDR, DWVSVVTPAR, FVGQGGAR, and TLDEYWR for uromodulin quantitation after a well-designed peptide selection workflow including in silico and experimental protein digestion.22,23 Here we selected YFIIQDR as the quantifying peptide and TLDEYWR and STEYGEGYACDTDLR as the qualifying peptides from 13 identified peptides from a native urine sample pool. In our hands, these peptides had a stable response after 6 h of digestion and were highly correlated (r ≥ 0.998). In this study, the stability of the (SIL−) STEYGEGYACcmDTDLR signal was relatively poor, and the peptide DWVSVVTPAR was considered to be an alternative peptide with good signal intensity, peak shape and peptide agreement. The studies of Ion et al. and Gilquin et al. described the development of assays to quantitate NGAL and selected, respectively, SYPGLTSYVR and SYNVTSVLFR or SYPGLTSYVR and VPLQQNFQDNQFQGK for their LC-MRM-MS methods.20,24 Although good peak intensity and peak shape were obtained for SYNVTSVLFR, we did not select this peptide based on the potential site for N-glycosylation in this peptide.38 In our hands, a robust performance with the relatively small peptide ITLYGR was obtained in addition to SYPGLTSYVR and VPLQQNFQDNQFQGK. Besides ITLYGR, more short peptides consisting of five to six amino acids were selected in the LC-MRM-MS method, namely, IQYEIK (TIMP2), FFACcmIk (TIMP2), and DLGWK (279TGF-β1390). Even though we checked the protein uniqueness of these peptides by sequence blasting and by inspecting previous observations reported in the SRM atlas, shorter amino acid sequences are more likely to be nonspecific for the protein of interest. Therefore, IQYEIK, FFACcmIk, and DLGWK were selected for qualification purposes only, and ion ratios need to be closely monitored in future studies to identify potential interreferences. In addition, peptides originating from the same proteins need to be in agreement to confirm the analytical selectivity.
The protein quantitation of lower abundant proteins from urine can be realized only using cleanup procedures, such as protein enrichment by ultrafiltration,24,39 membrane immobilization,40 chemical precipitation,41,42 peptide enrichment by solid-phase extraction (SPE),22,23 or stable isotope standards and capture by anti-peptide antibodies (SISCAPA).43 In this study, we minimized the urine matrix effects in protein quantitation by the introduction of an immunocapture step. We experienced major urine matrix effects when using other sample preparation strategies for the analysis of urine samples with wide-ranging protein concentrations. Specifically, the nonspecific proteolytic activity of endogenous proteases during incubation at 37 °C, the variable digestion efficiency in urine samples with high total protein content, and the inconsistent degree of ion suppression in ESI during the LC-MRM-MS analysis hampered a robust protein quantitation. In particular, proteinuria and hematuria can be expected in urinary samples obtained in the clinical target population. The current sample preparation strategy is antibody-dependent, which can be accompanied by increasing costs and potential batch-to-batch variations. The antibody specificity was considered less critical for this LC-MRM-MS method compared with immunoassay-based strategies because the analytical specificity was obtained by a direct MS read-out of the measurands. The antibody-based enrichment of target proteins prior to enzymatic digestion enables the quantitation of lower abundant proteins and overcomes the specimen-dependent matrix effects.
The provisional analytical validation of the LC-MRM-MS method demonstrated that the predefined criteria for carryover, matrix effects, and linearity were actually met for the proteins NGAL, TIMP-2, IGFBP7, KIM-1, CXCL9, SLC22A2, nephrin, and uromodulin. The analytical selectivity in our test was generally optimal; however, the quantitation of cubilin and CXCL9 was achieved by only one peptide due to poor qualifier peptide responses. The achieved average imprecision of 26% for the quantifier peptides was near the predefined desirable CV ≤ 25%. We expect that this level of imprecision should not affect the clinical performance when taking into consideration the high biological variation of these urinary biomarkers and the previously observed biomarker fold increases under pathological conditions.18,19,44 However, it remains to be evaluated whether this imprecision affects the clinical decision making or the clinical outcome.16 Automation of the sample preparation should be considered to improve the test imprecision and the long-term robustness.25,45 Furthermore, the analytical validation needs to be completed by an examination of the test accuracy by spiking or a measurement procedure comparison.28,46
In a proof-of-principle study, we showed that the LC-MRM-MS test enabled the quantitation of kidney injury biomarkers from patient samples. The value in terms of the clinical and cost effectiveness of this kidney injury panel has to be proven in randomized clinical trials; however, it is anticipated that this multiplex protein test will enable the early detection of kidney injury prior to progression into a full kidney insult. New treatment regimens and clinical guidelines should then be developed to prevent chronic kidney disease progression. In addition to the well-studied early kidney injury biomarkers, inflammation, fibrosis, and kidney-tissue-enriched proteins have been added to the biomarker panel to study the potential etiology underlying the encountered kidney injury. We believe that this multiplex urinary protein test will enable a molecular and refined definition of kidney injury, contributing to personalized protocols for the prevention of and timely intervention in acute and chronic kidney damage.
Acknowledgments
BioTechne (Minneapolis, MN) provided biotinylated antibodies at a reduced price but had no role in the study design, data collection and analysis, or decision to publish or preparation of the manuscript.
Glossary
Abbreviations
- AA
amino acid
- CE
collision energy
- CLSI
Clinical Laboratory Standards Institute
- ELISA
enzyme-linked immunosorbent assay
- LC-MRM-MS
liquid chromatography linked to tandem mass spectrometry in multiple reaction monitoring mode
- RR
relative response
- SIL
stable-isotope-labeled.
Supporting Information Available
The Supporting Information is available free of charge at https://pubs.acs.org/doi/10.1021/acs.jproteome.1c00532.
Section S1. Detailed materials and methods. Table S1. List MS identified peptides and selection criteria. Table S2. Selected signature peptides, MRM transitions, analytical imprecision. and carryover. Table S3. Calibration strategy. Table S4. Qualifier ratio monitoring. Table S5. Matrix effects by post-extraction spiking. Table S6. Imprecision multiplex kidney injury biomarker panel. Figure S1. Immunocapture protocol development. Figure S2. Linear range and ULoQ of immunocapture. Figure S3. Digestion kinetics. Figure S4. Peptide comparison. Figure S5. Matrix effects evaluated by admixing. Figure S6. Linearity (PDF)
Author Contributions
C.M.C. and J.W.d.F. conceived the approach and enabled the quantitative proteomics research. T.T.v.D., L.R.R., and F.P.H.T.M.R. designed and performed the experiments. J.W.D. and N.D. synthesized and purified peptides. C.M.C., L.R.R., J.W.d.F., N.P.M.S., and M.M.P. contributed to reviewing the data and commented on the manuscript. T.T.v.D. and L.R.R. wrote the manuscript. All authors were involved in reviewing and commenting on the manuscript.
The authors declare no competing financial interest.
Supplementary Material
References
- Lafrance J. P.; Miller D. R. Acute kidney injury associates with increased long-term mortality. J. Am. Soc. Nephrol. 2010, 21 (2), 345–52. 10.1681/ASN.2009060636. [DOI] [PMC free article] [PubMed] [Google Scholar]
- Khwaja A. KDIGO clinical practice guidelines for acute kidney injury. Nephron Clin Pract 2012, 120 (4), c179–84. 10.1159/000339789. [DOI] [PubMed] [Google Scholar]
- Moledina D. G.; Parikh C. R. Phenotyping of Acute Kidney Injury: Beyond Serum Creatinine. Semin. Nephrol. 2018, 38 (1), 3–11. 10.1016/j.semnephrol.2017.09.002. [DOI] [PMC free article] [PubMed] [Google Scholar]
- Hertzberg D.; Ryden L.; Pickering J. W.; Sartipy U.; Holzmann M. J. Acute kidney injury-an overview of diagnostic methods and clinical management. Clin. Kidney J. 2017, 10 (3), 323–331. 10.1093/ckj/sfx003. [DOI] [PMC free article] [PubMed] [Google Scholar]
- van Duijl T. T.; Soonawala D.; de Fijter J. W.; Ruhaak L. R.; Cobbaert C. M. Rational selection of a biomarker panel targeting unmet clinical needs in kidney injury. Clin. Proteomics 2021, 18 (1), 10. 10.1186/s12014-021-09315-z. [DOI] [PMC free article] [PubMed] [Google Scholar]
- Monaghan P. J.; Robinson S.; Rajdl D.; Bossuyt P. M. M.; Sandberg S.; St John A.; O’Kane M.; Lennartz L.; Röddiger R.; Lord S. J.; Cobbaert C. M.; Horvath A. R. Practical guide for identifying unmet clinical needs for biomarkers. EJIFCC 2018, 29 (2), 129–137. [PMC free article] [PubMed] [Google Scholar]
- Wu A. H. A selected history and future of immunoassay development and applications in clinical chemistry. Clin. Chim. Acta 2006, 369 (2), 119–24. 10.1016/j.cca.2006.02.045. [DOI] [PubMed] [Google Scholar]
- Hoofnagle A. N.; Wener M. H. The fundamental flaws of immunoassays and potential solutions using tandem mass spectrometry. J. Immunol. Methods 2009, 347 (1–2), 3–11. 10.1016/j.jim.2009.06.003. [DOI] [PMC free article] [PubMed] [Google Scholar]
- Neubert H.; Shuford C. M.; Olah T. V.; Garofolo F.; Schultz G. A.; Jones B. R.; Amaravadi L.; Laterza O. F.; Xu K.; Ackermann B. L. Protein Biomarker Quantification by Immunoaffinity Liquid Chromatography-Tandem Mass Spectrometry: Current State and Future Vision. Clin. Chem. 2020, 66 (2), 282–301. 10.1093/clinchem/hvz022. [DOI] [PubMed] [Google Scholar]
- Smit N. P. M.; Ruhaak L. R.; Romijn F.; Pieterse M. M.; van der Burgt Y. E. M.; Cobbaert C. M. The Time Has Come for Quantitative Protein Mass Spectrometry Tests That Target Unmet Clinical Needs. J. Am. Soc. Mass Spectrom. 2021, 32 (3), 636–647. 10.1021/jasms.0c00379. [DOI] [PMC free article] [PubMed] [Google Scholar]
- Zhang Y.; Fonslow B. R.; Shan B.; Baek M. C.; Yates J. R. 3rd Protein analysis by shotgun/bottom-up proteomics. Chem. Rev. 2013, 113 (4), 2343–94. 10.1021/cr3003533. [DOI] [PMC free article] [PubMed] [Google Scholar]
- van den Broek I.; Romijn F. P.; Smit N. P.; van der Laarse A.; Drijfhout J. W.; van der Burgt Y. E.; Cobbaert C. M. Quantifying protein measurands by peptide measurements: where do errors arise?. J. Proteome Res. 2015, 14 (2), 928–42. 10.1021/pr5011179. [DOI] [PubMed] [Google Scholar]
- Shuford C. M.; Walters J. J.; Holland P. M.; Sreenivasan U.; Askari N.; Ray K.; Grant R. P. Absolute Protein Quantification by Mass Spectrometry: Not as Simple as Advertised. Anal. Chem. 2017, 89 (14), 7406–7415. 10.1021/acs.analchem.7b00858. [DOI] [PubMed] [Google Scholar]
- Furey A.; Moriarty M.; Bane V.; Kinsella B.; Lehane M. Ion suppression; a critical review on causes, evaluation, prevention and applications. Talanta 2013, 115, 104–22. 10.1016/j.talanta.2013.03.048. [DOI] [PubMed] [Google Scholar]
- Lange V.; Picotti P.; Domon B.; Aebersold R. Selected reaction monitoring for quantitative proteomics: a tutorial. Mol. Syst. Biol. 2008, 4, 222. 10.1038/msb.2008.61. [DOI] [PMC free article] [PubMed] [Google Scholar]
- Horvath A. R.; Bossuyt P. M.; Sandberg S.; John A. S.; Monaghan P. J.; Verhagen-Kamerbeek W. D.; Lennartz L.; Cobbaert C. M.; Ebert C.; Lord S. J.; Setting analytical performance specifications based on outcome studies - is it possible?. Clin. Chem. Lab. Med. 2015, 53 (6), 841–8. 10.1515/cclm-2015-0214. [DOI] [PubMed] [Google Scholar]
- Sandberg S.; Fraser C. G.; Horvath A. R.; Jansen R.; Jones G.; Oosterhuis W.; Petersen P. H.; Schimmel H.; Sikaris K.; Panteghini M. Defining analytical performance specifications: Consensus Statement from the 1st Strategic Conference of the European Federation of Clinical Chemistry and Laboratory Medicine. Clin. Chem. Lab. Med. 2015, 53 (6), 833–5. 10.1515/cclm-2015-0067. [DOI] [PubMed] [Google Scholar]
- Carter J. L.; Parker C. T.; Stevens P. E.; Eaglestone G.; Knight S.; Farmer C. K.; Lamb E. J. Biological Variation of Plasma and Urinary Markers of Acute Kidney Injury in Patients with Chronic Kidney Disease. Clin. Chem. 2016, 62 (6), 876–83. 10.1373/clinchem.2015.250993. [DOI] [PubMed] [Google Scholar]
- van Duijl T. T.; Ruhaak L. R.; de Fijter J. W.; Cobbaert C. M. Kidney Injury Biomarkers in an Academic Hospital Setting: Where Are We Now?. Clin Biochem Rev. 2019, 40 (2), 79–97. 10.33176/AACB-18-00017. [DOI] [PMC free article] [PubMed] [Google Scholar]
- Ion V.; Nys G.; Cobraiville G.; Cavalier E.; Crommen J.; Servais A. C.; Muntean D. L.; Fillet M. Ultra-high-performance liquid chromatography-mass spectrometry method for neutrophil gelatinase-associated lipocalin as a predictive biomarker in acute kidney injury. Talanta 2019, 195, 668–675. 10.1016/j.talanta.2018.11.050. [DOI] [PubMed] [Google Scholar]
- Ji H.; Xu L.; Su J.; Shen L.; Wang H.; Wang J.; Wang F.; Ju S. Absolute quantification of urinary neutrophil gelatinase-associated lipocalin by ultra-high-performance liquid chromatography/tandem mass spectrometry and the diagnostic efficacy of acute kidney injury. Rapid Commun. Mass Spectrom. 2020, 34 (7), e8637. 10.1002/rcm.8637. [DOI] [PubMed] [Google Scholar]
- Hammond T. G.; Moes S.; Youhanna S.; Jennings P.; Devuyst O.; Odermatt A.; Jeno P. Development and characterization of a pseudo multiple reaction monitoring method for the quantification of human uromodulin in urine. Bioanalysis 2016, 8 (12), 1279–96. 10.4155/bio-2016-0055. [DOI] [PubMed] [Google Scholar]
- Fu Q.; Grote E.; Zhu J.; Jelinek C.; Kottgen A.; Coresh J.; Van Eyk J. E. An Empirical Approach to Signature Peptide Choice for Selected Reaction Monitoring: Quantification of Uromodulin in Urine. Clin. Chem. 2016, 62 (1), 198–207. 10.1373/clinchem.2015.242495. [DOI] [PubMed] [Google Scholar]
- Gilquin B.; Louwagie M.; Jaquinod M.; Cez A.; Picard G.; El Kholy L.; Surin B.; Garin J.; Ferro M.; Kofman T.; Barau C.; Plaisier E.; Ronco P.; Brun V. Multiplex and accurate quantification of acute kidney injury biomarker candidates in urine using Protein Standard Absolute Quantification (PSAQ) and targeted proteomics. Talanta 2017, 164, 77–84. 10.1016/j.talanta.2016.11.023. [DOI] [PubMed] [Google Scholar]
- van den Broek I.; Romijn F. P.; Nouta J.; van der Laarse A.; Drijfhout J. W.; Smit N. P.; van der Burgt Y. E.; Cobbaert C. M. Automated Multiplex LC-MS/MS Assay for Quantifying Serum Apolipoproteins A-I, B, C-I, C-II, C-III, and E with Qualitative Apolipoprotein E Phenotyping. Clin. Chem. 2016, 62 (1), 188–97. 10.1373/clinchem.2015.246702. [DOI] [PubMed] [Google Scholar]
- Ruhaak L. R.; Smit N. P. M.; Romijn F.; Pieterse M. M.; van der Laarse A.; van der Burgt Y. E. M.; Cobbaert C. M. Robust and Accurate 2-Year Performance of a Quantitative Mass Spectrometry-Based Apolipoprotein Test in a Clinical Chemistry Laboratory. Clin. Chem. 2018, 64 (4), 747–749. 10.1373/clinchem.2017.285098. [DOI] [PubMed] [Google Scholar]
- Briscoe C. J.; Stiles M. R.; Hage D. S. System suitability in bioanalytical LC/MS/MS. J. Pharm. Biomed. Anal. 2007, 44 (2), 484–91. 10.1016/j.jpba.2007.03.003. [DOI] [PubMed] [Google Scholar]
- Lynch K. L. CLSI C62-A: A New Standard for Clinical Mass Spectrometry. Clin. Chem. 2016, 62 (1), 24–9. 10.1373/clinchem.2015.238626. [DOI] [PubMed] [Google Scholar]
- Clinical and Laboratory Standards Institute (CLSI). User Verification of Precision and Estimation of Bias; Approved Guideline, 3rd ed; CLSI document EP15-A3; Clinical and Laboratory Standards Institute: Wayne, PA, 2014
- Bhatraju P. K.; Zelnick L. R.; Chinchilli V. M.; Moledina D. G.; Coca S. G.; Parikh C. R.; Garg A. X.; Hsu C. Y.; Go A. S.; Liu K. D.; Ikizler T. A.; Siew E. D.; Kaufman J. S.; Kimmel P. L.; Himmelfarb J.; Wurfel M. M. Association Between Early Recovery of Kidney Function After Acute Kidney Injury and Long-term Clinical Outcomes. JAMA network open 2020, 3 (4), e202682. 10.1001/jamanetworkopen.2020.2682. [DOI] [PMC free article] [PubMed] [Google Scholar]
- Guzzi L. M.; Bergler T.; Binnall B.; Engelman D. T.; Forni L.; Germain M. J.; Gluck E.; Gocze I.; Joannidis M.; Koyner J. L.; Reddy V. S.; Rimmele T.; Ronco C.; Textoris J.; Zarbock A.; Kellum J. A. Clinical use of [TIMP-2]*[IGFBP7] biomarker testing to assess risk of acute kidney injury in critical care: guidance from an expert panel. Critical care (London, England) 2019, 23 (1), 225. 10.1186/s13054-019-2504-8. [DOI] [PMC free article] [PubMed] [Google Scholar]
- Lippi G.; Aloe R.; Storelli A.; Cervellin G.; Trenti T. Evaluation of NGAL Test, a fully-automated neutrophil gelatinase-associated lipocalin (NGAL) immunoassay on Beckman Coulter AU 5822. Clin. Chem. Lab. Med. 2012, 50 (9), 1581–4. 10.1515/cclm.2011.839. [DOI] [PubMed] [Google Scholar]
- Fan W.; Ankawi G.; Zhang J.; Digvijay K.; Giavarina D.; Yin Y.; Ronco C. Current understanding and future directions in the application of TIMP-2 and IGFBP7 in AKI clinical practice. Clin. Chem. Lab. Med. 2019, 57 (5), 567–576. 10.1515/cclm-2018-0776. [DOI] [PubMed] [Google Scholar]
- Makris K.; Stefani D.; Makri E.; Panagou I.; Lagiou M.; Sarli A.; Lelekis M.; Kroupis C. Evaluation of a particle enhanced turbidimetric assay for the measurement of neutrophil gelatinase-associated lipocalin in plasma and urine on Architect-8000: Analytical performance and establishment of reference values. Clin. Biochem. 2015, 48 (18), 1291–7. 10.1016/j.clinbiochem.2015.08.003. [DOI] [PubMed] [Google Scholar]
- Hansen Y. B.; Damgaard A.; Poulsen J. H. Evaluation of NGAL TestTM on Cobas 6000. Scand. J. Clin. Lab. Invest. 2014, 74 (1), 20–6. 10.3109/00365513.2013.855943. [DOI] [PubMed] [Google Scholar]
- BioVendor R&D. Uromodulin Human ELISA. https://www.biovendor.com/uromodulin-human-elisa#technical-data (accessed 2021-07-01).
- Duarte T. T.; Spencer C. T. Personalized Proteomics: The Future of Precision Medicine. Proteomes 2016, 4 (4), 29. 10.3390/proteomes4040029. [DOI] [PMC free article] [PubMed] [Google Scholar]
- Kristiansen T. Z.; Bunkenborg J.; Gronborg M.; Molina H.; Thuluvath P. J.; Argani P.; Goggins M. G.; Maitra A.; Pandey A. A proteomic analysis of human bile. Mol. Cell Proteomics 2004, 3 (7), 715–28. 10.1074/mcp.M400015-MCP200. [DOI] [PubMed] [Google Scholar]
- Wisniewski J. R. Filter-Aided Sample Preparation for Proteome Analysis. Methods Mol. Biol. (N. Y., NY, U. S.) 2018, 1841, 3–10. 10.1007/978-1-4939-8695-8_1. [DOI] [PubMed] [Google Scholar]
- Berger S. T.; Ahmed S.; Muntel J.; Cuevas Polo N.; Bachur R.; Kentsis A.; Steen J.; Steen H. MStern Blotting-High Throughput Polyvinylidene Fluoride (PVDF) Membrane-Based Proteomic Sample Preparation for 96-Well Plates. Molecular & cellular proteomics: MCP 2015, 14 (10), 2814–23. 10.1074/mcp.O115.049650. [DOI] [PMC free article] [PubMed] [Google Scholar]
- Nickerson J. L.; Doucette A. A. Rapid and Quantitative Protein Precipitation for Proteome Analysis by Mass Spectrometry. J. Proteome Res. 2020, 19 (5), 2035–2042. 10.1021/acs.jproteome.9b00867. [DOI] [PubMed] [Google Scholar]
- Selevsek N.; Matondo M.; Carbayo M. S.; Aebersold R.; Domon B. Systematic quantification of peptides/proteins in urine using selected reaction monitoring. Proteomics 2011, 11 (6), 1135–47. 10.1002/pmic.201000599. [DOI] [PubMed] [Google Scholar]
- Anderson N. L.; Anderson N. G.; Haines L. R.; Hardie D. B.; Olafson R. W.; Pearson T. W. Mass spectrometric quantitation of peptides and proteins using Stable Isotope Standards and Capture by Anti-Peptide Antibodies (SISCAPA). J. Proteome Res. 2004, 3 (2), 235–44. 10.1021/pr034086h. [DOI] [PubMed] [Google Scholar]
- Bank J. R.; Ruhaak R.; Soonawala D.; Mayboroda O.; Romijn F. P.; van Kooten C.; Cobbaert C. M.; de Fijter J. W. Urinary TIMP-2 Predicts the Presence and Duration of Delayed Graft Function in Donation After Circulatory Death Kidney Transplant Recipients. Transplantation 2019, 103 (5), 1014–1023. 10.1097/TP.0000000000002472. [DOI] [PubMed] [Google Scholar]
- Fu Q.; Kowalski M. P.; Mastali M.; Parker S. J.; Sobhani K.; van den Broek I.; Hunter C. L.; Van Eyk J. E. Highly Reproducible Automated Proteomics Sample Preparation Workflow for Quantitative Mass Spectrometry. J. Proteome Res. 2018, 17 (1), 420–428. 10.1021/acs.jproteome.7b00623. [DOI] [PMC free article] [PubMed] [Google Scholar]
- Grant R. P.; Hoofnagle A. N. From lost in translation to paradise found: enabling protein biomarker method transfer by mass spectrometry. Clin. Chem. 2014, 60 (7), 941–4. 10.1373/clinchem.2014.224840. [DOI] [PMC free article] [PubMed] [Google Scholar]
Associated Data
This section collects any data citations, data availability statements, or supplementary materials included in this article.