

R-SMAD stability is essential for TGF-β signaling. In this study, Zhou and Dabiri et al. describe a new role of the tumor suppressor pVHL as an E3 ligase for R-SMAD ubiquitination, implicating the potential interaction between oxygen sensing and TGF-β signaling in human cells and Drosophila tissue development.
Abstract
Transforming growth factor β (TGF-β) signaling plays a fundamental role in metazoan development and tissue homeostasis. However, the molecular mechanisms concerning the ubiquitin-related dynamic regulation of TGF-β signaling are not thoroughly understood. Using a combination of proteomics and an siRNA screen, we identify pVHL as an E3 ligase for SMAD3 ubiquitination. We show that pVHL directly interacts with conserved lysine and proline residues in the MH2 domain of SMAD3, triggering degradation. As a result, the level of pVHL expression negatively correlates with the expression and activity of SMAD3 in cells, Drosophila wing, and patient tissues. In Drosophila, loss of pVHL leads to the up-regulation of TGF-β targets visible in a downward wing blade phenotype, which is rescued by inhibition of SMAD activity. Drosophila pVHL expression exhibited ectopic veinlets and reduced wing growth in a similar manner as upon loss of TGF-β/SMAD signaling. Thus, our study demonstrates a conserved role of pVHL in the regulation of TGF-β/SMAD3 signaling in human cells and Drosophila wing development.
Introduction
The TGF-β/SMAD signaling pathway plays an essential role in cell growth, differentiation, migration, and communication during metazoan development and tissue homeostasis (Yu and Feng, 2019). Deregulation of TGF-β/SMAD signaling results in many developmental, immune, and fibrotic diseases, as well as cancer (Colak and Ten Dijke, 2017; David and Massagué, 2018; Prunier et al., 2019). Upon encountering TGF-β ligands, the type I and type II receptor serine/threonine kinases form receptor complexes that induce active phosphorylation of receptor-regulated SMAD2/3 (R-SMAD), which in turn binds to common SMAD (SMAD4) and accumulates in the nucleus for transcriptional regulation of TGF-β/SMAD target genes.
The discovery of SMADs was initiated by a genetic screen for decapentaplegic regulators in Drosophila melanogaster (Peterson and O’Connor, 2014). In flies, a complex of type I receptor (Baboon) and type II receptor (Punt) recognizes TGF-β ligands (Activin, Dawdle, Maverick, and Myoglianin) and phosphorylates Smox, a homologue of vertebrate SMAD2/3 (Peterson and O’Connor, 2013). Compelling evidence demonstrates the conserved role of TGF-β/SMAD in the development of diverse organisms, including the growth and patterning of adult Drosophila wing (Hevia and de Celis, 2013; Peterson and O’Connor, 2013).
Ubiquitination is an enzymatic posttranslational modification. This process involves an E3 ubiquitin ligase, which brings a target protein in close proximity to the ubiquitination machinery for proteasomal destruction (Zheng and Shabek, 2017). Ubiquitination of phosphorylated R-SMAD2/3 is one of the key mechanisms regulating the activity of TGF-β signaling. For instance, NEDD4L represents the major ubiquitin ligase responsible for the degradation of activated phospho-SMAD2/3 (Gao et al., 2009). Moreover, the HECT domain–containing E3 ligase Smurf2 has been also shown to ubiquitinate phosphorylated R-SMAD2/3 (Zhang et al., 2001).
The von Hippel–Lindau (VHL) tumor suppressor (pVHL) is a key E3 ligase of Cullin RING E3 ubiquitin complex and is involved in a number of signaling pathways (Tarade and Ohh, 2018). The best-studied pVHL target is the α subunits of hypoxia inducible factor 1 (HIF-1α). Under normoxic conditions, pVHL recognizes hydroxylated proline residues of HIF-1α (P402 and P564) catalyzed by prolyl hydroxylase domain (PHD) protein for oxygen-dependent degradation, whose activity is blocked under hypoxia (Fong and Takeda, 2008). In addition, the functional importance and complexity of pVHL has been implicated in various HIF-independent cellular processes and diseases. For example, previous studies have shown that pVHL promotes extracellular matrix remodeling, cell invasion, and angiogenesis by down-regulating vascular endothelial growth factor (Kurban et al., 2006). A number of studies evidenced the activation of TGF-β in hypoxia (Falanga et al., 1991). However, the role of pVHL in this context is still unknown.
We previously reported indirubin derivatives, including E738, as inhibitors of TGF-β signaling via degrading SMAD2/3 (Cheng et al., 2012). However, the precise molecular mechanism by which E738 destabilizes R-SMAD2/3 and terminates TGF-β signaling activity is still unclear. In this study, we combined proteome-wide analysis using biotinylated-E738 with an siRNA screen and revealed pVHL as a potent negative regulator of TGF-β/SMAD3 signaling. Mechanistically, pVHL degraded SMAD3 by directly binding to the conserved LxLxxP motif in the C terminus of the MH2 domain and attenuated TGF-β–mediated downstream gene expression and cell migration in cultured mammalian cells. In addition, overexpression of pVHL in Drosophila caused smaller wings with ectopic veinlets, similar to loss of function in TGF-β/SMAD signaling. In contrast, pVHL depletion resulted in SMAD-dependent wing developmental defects. Our work suggests a conserved role of pVHL as an E3 ligase repressing TGF-β/SMAD signaling.
Results
pVHL is an E3 ligase degrading SMAD2/3
In a previous study, we showed that certain indirubin derivatives, like E738, could interfere with TGF-β signaling by promoting SMAD2/3 degradation (Cheng et al., 2012). To get a deeper insight into the mechanism of action, we conducted a high-resolution proteomic analysis on HeLa cells treated with biotinylated E738 (Fig. S1 A). The chemical synthesis and characterization of biotin-E738 is exclusively described in Materials and methods. Of note, the resulting biotinylated E738 degraded SMAD2/3 at concentrations slightly higher than E738 (Fig. S1 B), probably due to reduced cell permeability upon biotinylation. In addition to the enrichment of proteins involved in ubiquitination and protein stability, proteomic analysis also implicated that E738 modulated proteins in the response to hypoxia (Fig. S1 C). We next performed a small-scale siRNA screen targeting individual E3 ligases related to the targets obtained in proteomic analysis. We found that the knockdown (KD) of pVHL, CUL2, or RBX1 led to an increase in SMAD2/3 stability (Figs. 1 A and S1 D). All of these genes are associated with the Cullin RING E3 ubiquitin ligase complex (Cardote et al., 2017). Thus, we focused on pVHL and found that depletion of pVHL with either individual siRNAs (siVHL1 and siVHL2) or the combination (siVHL1 and siVHL2) increased SMAD2/3 expression (Figs. 1 B and S1 E), while the SMAD2/3 level was reduced in cases of pVHL overexpression (VHL OE; Fig. S1 F). We performed the second proteome-wide analysis on extracts of pVHL-depleted cells (Fig. 1 C) and verified that R-SMADs (SMAD1/5/8 and SMAD2/3) were one of the top hits, which were differentially expressed in cells lacking siVHL as compared with that in control cells (Fig. 1 D). The enrichment study confirmed that abundant proteins upon pVHL depletion were associated with diverse ubiquitin- and TGF-β–mediated biological processes (Fig. S1 G).
Figure S1.

pVHL regulates SMAD3 stability. (A) A schematic overview of proteomics-based approach to identify interacting proteins of biotinylated E738. (B) Comparison of SMAD2/3 and SMAD1/5/8 depletion induced by biotinylated E738 against that induced by E738 in HCT116 cells. (C) Functional enrichment analysis shows statistically significant enrichment in gene ontology terms related to ubiquitination and protein stability. P values represent values after adjustment. Orange arrows highlight gene ontology terms related to hypoxia. ERAD, ER-associated protein degradation. (D) Quantified pVHL expression in cells transfected with diverse siRNAs indicated. (E and F) SMAD2/3 stability is negatively related to the expression of pVHL. Immunoblotting images of pVHL and SMAD2/3 expression in VHL-deficient (E) and pVHL OE (F) HeLa cells. (G) Functional enrichment analysis shows statistically significant enrichment in gene ontology terms related to R-SMAD signaling pathways and ubiquitination. (H) The expression of pVHL was negatively correlated to the expression of SMAD2/3 in various human tissues. We compared the expression of pVHL and SMAD2/3 in areas expressing high levels of pVHL or SMAD2/3 in human samples from 17 patients. HCC results from patients 8 and 25 are depicted. Patient information can be found in Materials and methods and Table 1. P, patient number; NC, noncancerous tissue; C, cancerous tissue. pVHL, green; SMAD2/3, red. Scale bar, 160 µm. (I) pVHL is negatively correlated with SMAD3 and phospho-SMAD3 expression in patient tissues. No correlation was found between HIF-1α and SMAD3. One-way ANOVA and one-sided Student’s t test were performed in D (n = 3). ***, P < 0.001; the center line represents the median. In D, the quantification data are presented as mean ± SEM. Source data are available for this figure: SourceData FS1.
Figure 1.

pVHL regulates SMAD3 stability. (A) siRNA screening shows enhanced stability of SMAD2/3 in pVHL-, CUL2-, or RBX1-deficient HeLa cells. siVHL indicates pVHL siRNA. The related densitometric analysis can be found in Fig. S1 D. (B) SMAD2/3 stability is negatively related to the expression of pVHL. The correlation between pVHL and SMAD2/3 expression was quantified by densitometric analysis. siVHL1, siVHL2, and their combination (siVHL1+2) were used to study SMAD2/3 stability in pVHL KD cells. pVHL OE indicates cells overexpressing pVHL. Three concentrations of either siRNAs or DNA were used. The immunoblotting results can be found in Fig. S1, E and F. The relative SMAD2/3 expression compared with the respective control is depicted. One-way ANOVA was performed. *, P < 0.05; ***, P < 0.001; one-way ANOVA and one-sided Student's t test (n = 3). The lower and upper ends of bars indicate the minimum and maximum values, respectively, and the center line represents the median. (C) Schematic illustration of proteomic analysis of protein expression on VHL-deficient HeLa cells. (D) Heatmap of R-SMAD–related protein expression obtained from proteomic analysis of pVHL-deficient cells from two independent experiments. R-SMAD indicates SMAD1/5/8 and SMAD2/3. The color scale indicates the fold change of related protein found in pVHL-deficient cells compared with control. (E) Inverse correlation between SMAD2/3 and pVHL in the cancer tissue from patient 7. Red, SMAD2/3; green, VHL; blue, nucleus. Scale bar, 40 µm. (F) pVHL is negatively correlated to SMAD2/3 stability in HCT116 and HEK293T cell lines. Source data are available for this figure: SourceData F1.
The inverse correlation between pVHL and TGF-β receptor expression had been noted in clear cell renal cell carcinoma patient samples (Mallikarjuna et al., 2018). In line with this, we found that pVHL protein was highly expressed in the bile duct of human liver tissue, whereas the level of SMAD2/3 was low or undetectable (Fig. 1 E). Conversely, high expression of SMAD2/3 detected in surrounding tissue was correlated with low levels of pVHL (Fig. 1 E). Similar results were obtained from various tissues from 17 patients (Fig. S1 H). We found that the expression pattern of an actively phosphorylated form of SMAD3 (pSMAD3) was also inversely correlated with pVHL expression in patient liver tissues (Fig. S1 I). However, no correlation was found between HIF-1α and SMAD3 or pSMAD3 (Fig. S1 I). Additionally, we confirmed increased SMAD2/3 expression in pVHL-deficient HCT116 and HEK293T cell lines (Fig. 1 F). These results suggest a negative correlation between the expression of pVHL and SMAD2/3 and provide evidence that pVHL could have a functional role in TGF-β/SMAD–associated signaling pathways during disease progression.
pVHL directly interacts and degrades SMAD3
As mentioned above, pVHL is the predominant E3 ligase controlling HIF-1α stability (Min et al., 2002). Previous studies have described an indirect role of HIF-1α in TGF-β–stimulated glycolysis (Hua et al., 2020). Our immunohistochemistry results suggested a potential independence of pVHL-mediated SMAD2/3 degradation and HIF-1α. CoCl2 is a chemical that mimics hypoxia by inhibition of PHD proteins (Fong and Takeda, 2008). The investigation of FLAG-SMAD3 stability in the pVHL-deficient HeLa cells treated revealed that CoCl2 attenuated pVHL KD–induced FLAG-SMAD3 elevation (Figs. 2 A and S2 A). However, this induction of SMAD3 expression was not diminished in cells transfected with siRNA against HIF-1α (siHIF-1α; Figs. 2 A and S2 A). These results suggest that the pVHL-induced SMAD3 degradation probably requires PHD-mediated hydroxylation, but it is independent of HIF-1α.
Figure 2.

pVHL directly binds to SMAD3 for ubiquitination. (A) The influence of the PHD inhibitor CoCl2 and HIF-1α on pVHL-mediated SMAD3 degradation. The impact of either CoCl2 with increasing concentrations or HIF-1α siRNA (siHIF-1α) on FLAG-SMAD3 was investigated in pVHL-deficient HeLa cells (pVHL KD). Densitometric analysis can be found in Fig. S2 B. (B) MG132 rescued pVHL-mediated SMAD3 degradation, as shown by live-cell imaging. Red, SMAD3-OFP; green, VHL-GFP. Cells expressing only SMAD3-OFP were used as a control. Scale bar, 40 µm. (C) pVHL-mediated polyubiquitination on FLAG-SMAD3. The ubiquitination on SMAD3 was compared in the absence and presence of MG132 in cells expressing FLAG-SMAD3, HA-pVHL, or the combination. FLAG-SMAD3 was precipitated, and ubiquitination on FLAG-SMAD3 was detected with specific ubiquitin antibody. (D) The pVHL-mediated SMAD3 degradation is dependent on the catalytic activity of VHL. Loss-of-function mutation of pVHL or cotreatment with pVHL inhibitor blocks FLAG-SMAD3 degradation. HA-pVHL WT indicates HeLa cells expressing WT HA-pVHL, HA-VHL m98 indicates HA-VHL Y98N mutation, and Inh indicates chemical pVHL inhibitor. FLAG-SMAD3 was precipitated, and the level of HA-VHL binding to FLAG-SMAD3 was detected with specific HA antibody. (E) Schematic illustration of the in vitro ubiquitination assay. (F) pVHL destabilizes SMAD3 in vitro. pVHL-deficient HeLa cells expressing FLAG-SMAD3 were lysed and incubated with respective isolated protein, including HA-pVHL WT, in the presence or absence of pVHL chemical inhibitor, pVHL W117R mutation (pVHL m117), or pVHL Y98N mutation (pVHL m98). ATP consumption was measured. (G) FRET assay for pVHL-GFP binding to SMAD3-OFP. FRET signal was measured in cells expressing SMAD3-OFP, VHL-GFP, or the combination. The absolute fluorescence intensity was compared in the presence or absence of MG132. In F and G, a dot plot was used, and the fold change compared with the respective control is depicted. One-way ANOVA and one-sided Student's t test were performed in F (n = 6) and G (n = 6). *, P < 0.05; ***, P < 0.001; the center line represents the median. BF, bright field; IP, immunoprecipitation; NS, non-staining; UBI ubiquitin; WB, Western blot. Source data are available for this figure: SourceData F2.
Figure S2.

pVHL directly binds to SMAD3 for ubiquitination. (A) Densitometric analysis related to Fig. 2 A. (B) Detection of FLAG-SMAD3 degradation using samples collected from the in vitro ubiquitination assay as described in the main text. (C) In vitro ubiquitination assay analysis in immunoblotting. One-way ANOVA and one-sided Student’s t test were performed in A (n = 3). **, P < 0.01; ***, P < 0.001; the center line represents the median. Source data are available for this figure: SourceData FS2.
The ubiquitin proteasome pathway (UPP) is the major mechanism of protein degradation and requires E3 ligase to transfer ubiquitin units to target proteins for polyubiquitination and proteasomal degradation (Zheng and Shabek, 2017). To ask whether the observed SMAD2/3 degradation in pVHL OE cells is associated with UPP, we coexpressed FLAG-SMAD3-OFP and pVHL-GFP in cells in the presence or absence of a well-known proteasome inhibitor, MG132. We found that SMAD-OFP was not detectable in the coexpression, which was rescued in the presence of MG132 (Fig. 2 B). Results from immunoblotting further confirmed that the overexpression of pVHL facilitated FLAG-SMAD3 degradation, which was blocked by MG132 (Fig. 2 C). Moreover, we detected the accumulation of polyubiquitin in the precipitant of FLAG protein isolated from MG132-treated cells coexpressing pVHL and FLAG-SMAD3 (Fig. 2 C). Taken together, these results indicate that pVHL-mediated SMAD3 degradation is UPP dependent.
We next attempted to figure out how pVHL facilitated SMAD3 degradation. The crystal structure of pVHL with HIF-1α revealed that pVHL contains an acidic region together with the α and β domains (Cardote et al., 2017). The α subdomain is required for recruiting the components of the Cullin RING E3 ubiquitin ligase complex, including elongin B, elongin C, Cullin 2, and Rbx1. The β subdomain is important for binding and recognition of pVHL substrates such as HIF-1α (Cardote et al., 2017; Min et al., 2002). This binding model is also demonstrated by several loss-of-function mutations, including Y98N (m98) and W117R (m117) variants (Min et al., 2002). We therefore compared the stability of FLAG-SMAD3 in cells expressing HA-pVHL WT or HA-pVHL m98 and found that the FLAG-SMAD3 degradation required functional pVHL (Fig. 2 D), while adding a commercially available pVHL inhibitor rescued the degradation of FLAG-SMAD3 (Fig. 2 D: panel without MG132). In addition, we recruited MG132 to block the degradation and immunoprecipitated HA-pVHL (both WT and m98). We detected FLAG-SMAD3 in cell extracts containing HA-pVHL WT, but not HA-pVHL m98 or in the presence of pVHL inhibitor (Fig. 2 D), suggesting that SMAD3 degradation required catalytically active pVHL.
ATP hydrolysis is required for ubiquitination of targeted proteins and 26S proteasome–mediated protein degradation (Peth et al., 2013). We adapted our recently developed in vitro ubiquitination assay to investigate chemically induced target protein degradation in vitro by determination of ATP consumption and immunoblotting (Gama-Brambila et al., 2021a, 2021b). As shown in Fig. 2 E, we overexpressed FLAG-SMAD3 in HeLa cells lacking pVHL, which contained all required components for ubiquitination except pVHL. The reaction was initiated by adding purified HA-pVHL, HA-pVHL m98, or HA-pVHL m117 into cell lysate. We detected an increase of ATP consumption in the presence of pVHL WT, but not pVHL m98 or m117 mutations (Fig. 2 F). Moreover, the ATP consumption was blocked by chemical pVHL inhibition (Fig. 2 F). Immunoblotting further confirmed that the degradation was related to the amount of pVHL WT (Fig. S2 B) and required functional pVHL, because FLAG-SMAD3 was resistant in the presence of pVHL inhibitor or loss-of-function pVHL variants (m117 and m98; Fig. S2 C). Förster resonance energy transfer (FRET) assay is a useful approach to investigate protein–protein interactions (Kim et al., 2010). We detected a nearly 10-fold higher fluorescence signal (excitation/emission [Em/Ex], 488/573 nm) in MG132-treated cells coexpressing pVHL-GFP (Em/Ex, 488/510 nm) and SMAD3-OFP (Em/Ex, 548/573 nm) than cells individually expressing pVHL-GFP or SMAD3-OFP (Fig. 2 G). In addition, the increased fluorescence signal is diminished in the presence of the pVHL inhibitor (Fig. 2 G). These results demonstrated that pVHL degraded SMAD2/3 through physical interaction, which is dependent on key residues (tyrosine 98 and tryptophan 117) in the β domain of pVHL.
pVHL promotes SMAD3 degradation by interacting with its MH2 domain
SMAD3 contains two conserved Mad homology (MH) domains (MH1 and MH2), which are connected by a less conserved linker region. Both MH1 and MH2 domains are involved in the interaction with other transcriptional cofactors (coactivators or cosuppressors) and binding to DNA for downstream gene expression (Shi, 2006). Our aforementioned results showed the physical interaction between pVHL and SMAD3 using a coimmunoprecipitation assay, in vitro ubiquitination assay, and FRET assay. To better understand the binding model, we attempted to figure out the binding domain of SMAD3 to pVHL. Different variants of FLAG-SMAD3s (Fig. 3 A) were individually coexpressed with either HA-pVHL WT (OE) or siVHL (KD) in HeLa cells. The stability of FLAG-SMAD3 was examined using immunoblotting with specific FLAG antibody. As shown in Fig. 3 B and Fig. S3 A, expression of pVHL reduced the protein level of FLAG-tagged full-length SMAD3 (SMAD3FL), while siVHL enhanced its stability. Similar results were found for SMAD3EPSM, which contains four mutations in the linker region, SMAD3LC lacking MH1 domain, and MH2-only SMAD3C, as well as C-terminal–deficient SMAD3ΔSSVS (Figs. 3 B and S3 A). However, variants excluding the entire MH2 domain, like SMAD3NL (with MH1 and linker) or SMAD3N (only MH1), were unaffected by pVHL (Figs. 3 B and S3 A). Moreover, we immunoprecipitated FLAG-SMAD3 variants in cell extracts and detected pVHL only in those FLAG-SMAD3s containing MH2 domain (Fig. S3 B) These results suggest that the MH2 domain is indispensable for pVHL-induced SMAD3 degradation.
Figure 3.

LxLxxP motif in the MH2 domain is indispensable for pVHL-mediated SMAD3 degradation. (A) Schematic illustration of FLAG-SMAD3 variants. (B) The MH2 domain is crucial for pVHL-mediated SMAD3 degradation. The expression of FLAG-SMAD3 variants in pVHL-deficient (KD) cells was quantified by densitometric analysis and compared with that in cells overexpressing pVHL (OE). The original immunoblotting image can be found in Fig. S3 A. (C) Comparison of HIF1α and SMAD3 amino acid sequences highlights the potentially essential lysine (K) in blue and proline (P) in blue. The loss-of-function mutations (namely K-R and LNGP-AAAA) are depicted in red. (D) SMAD3K-R and SMAD3AAAA are resistant to pVHL in vitro. ATP consumption was measured in the in vitro ubiquitination assay using lysis from cells expressing pVHL WT or VHL m98. The FLAG-SMAD3FL, FLAG-SMAD3K-R mutation, or the FLAD-SMAD3AAAA mutation was separately purified and added to initiate the reaction. (E) FLAG-SMAD3K-R and FLAG-SMAD3AAAA are resistant to pVHL in cells. The stability of FLAG-SMAD variants was studied in pVHL OE or pVHL KD cells. The quantified result can be found in Fig. S3 B. (F) The K-R or AAAA mutation dissipates the binding of FLAG-SMAD3 to pVHL. Immunoprecipitation was performed in MG132-treated cells expressing FLAG-SMADFL, FLAG-SMAD3K-R, or FLAG-SMAD3AAAA. FLAG-SMAD3 variants were precipitated, and the binding to pVHL is shown. (G) Detection of hydroxy proline in FLAG-SMAD3 variants. FLAG-SMADs variants were immunoprecipitated, and hydroxyl proline antibody was used to detect the expression of hydroxy proline in the precipitation. For B and D, a dot plot is used, and the fold change compared with the respective treatment or control is depicted. One-way ANOVA and one-sided Student's t test were performed in D (n = 6). ***, P < 0.001; the center line represents the median. One of the original images in B, E, and F can be found in SourceData F3. Source data are available for this figure: SourceData F3.
Figure S3.

The LxLxxP motif in the MH2 domain is indispensable for pVHL-mediated SMAD3 degradation. (A) The influence of pVHL KD or overexpression on FLAG-SMAD3 variants. OE, pVHL WT overexpression; KD, siVHL KD; SMAD3FL, full-length FLAG-SMAD3; SMAD3EPSM, FLAG-SMAD3 carrying four mutations in the linker region; SMAD3LC, FLAG-SMAD3 only with linker (L) and MH2 (C, C terminus); SMAD3C, FLAG-SMAD3 only with MH2; SMAD3NL, FLAG-SMAD3 only with MH1 (N terminus) and linker; SMAD3N, FLAG-SMAD3 only with MH1; SMAD3ΔSSV, FLAG-SMAD3 without SSV at the C terminus for active phosphorylation. (B) Interaction of pVHL with FLAG-SMAD variants. Immunoblotting using pVHL antibody follows immunoprecipitation of FLAG-SMAD variants. (C) Alignment analysis of R-SMADs, common SMADs, and inhibitor SMADs in human, Drosophila, and zebrafish. (D) Densitometric analysis of SMAD3K-R and SMAD3AAAA expression in response to pVHL KD or OE. One-way ANOVA and one-sided Student's t test were performed in D (n = 3). ***, P < 0.001; the center line represents the median. Source data are available for this figure: SourceData FS3.
It is known that pVHL interacts with the hydroxylated proline residues of HIF-1α in the LxxLAP of the C-terminal oxygen degradation domain (CODD) and the LxLLAP motif of the N-terminal oxygen degradation domain (NODD; where A is alanine, L is leucine, P is proline, and X represents any amino acid; Chowdhury et al., 2016). These motifs are present in extended peptide chains to bind to pVHL for ubiquitin transfer (Hon et al., 2002). This ubiquitination requires at least one lysine with a distance of 20–30 amino acids to the proline residue (Leonardi et al., 2009; Min et al., 2002; Semenza, 2004), as shown in Fig. 3 C. We found the LxLNGP sequence in the SMAD3 MH2 domain and the lysine residue (K378) with a distance of 24 amino acids to the proline residue, which is strikingly similar to LxLLAP in the NODD of HIF-1α (Fig. 3 C). Although this position is at the transition region from the central β-sheet domain to the C-terminal α-helix of SMAD3 (Chacko et al., 2004; Qin et al., 2002), it has been reported to contribute to the interaction with SKI (Miyazono et al., 2018). Alignment analysis confirmed that L(I)xLxxP is highly conserved in R-SMADs in human, Drosophila, and zebrafish, but not in common SMAD or inhibitor SMADs (Fig. S3 C), suggesting a common role of pVHL-mediated R-SMADs degradation in the development. We next mutated the LNGP residues of SMAD3 to alanine (SMAD3AAAA) or lysine (K378) to arginine (SMAD3K-R). The result from in vitro ubiquitination assay showed that ATP consumption was significantly higher in the reaction of FLAG-SMAD3FL with pVHL WT than in the mock control, while no effect was observed with FLAG-SMAD3AAAA or FLAG-SMAD3K-R mutants (Fig. 3 D). In the case of mutated pVHL m98, we could not detect increased ATP consumption (Fig. 3 D). pVHL OE or KD did not affect the stability of either FLAG-SMAD3AAAA or FLAG-SMAD3K-R (Figs. 3 E and S3 D). In addition, pVHL failed to interact with SMAD3AAAA or SMAD3K-R mutants in the immunoprecipitation assay (Fig. 3 F). We immunoprecipitated FLAG-SMAD3 variants and detected hydroxyl proline in FLAG-SMADFL, but not in FLAG-SMAD3N lacking the MH2 domain. The mutation of LNGP (FLAG-SMADAAAA) abolished the hydroxylation, which, however, appeared in the case of FLAG-SMAD3K-R variant (Fig. 3 G). These results suggest that the LNGP motif and K378 in the MH2 domain of SMAD3 are important for binding pVHL and subsequent degradation.
pVHL inhibits TGF-β/SMAD signaling induced cell invasion
It is well known that TGF-β stimulates phosphorylation of SMAD2/3 to activate its signaling cascade (Cheng et al., 2012; Prunier et al., 2019). We found that overexpression of the pVHL WT, but not the mutated form (pVHL m98), destabilized total and phospho-SMAD2/3 (Figs. 4 and S4 A), which was rescued by the pVHL chemical inhibitor (Fig. 4 A). In contrast, KD of pVHL (siVHL) increased phospho-SMAD2/3 stability (Fig. 4 A). Next, we employed the well-established SMAD-binding element (CAGA) luciferase reporter to study the influence of pVHL KD or OE on TGF-β signaling (Meyer et al., 2011). We observed that overexpression of FLAG-SMAD3FL increased luciferase activity, which was further improved in cells expressing FLAG-SMAD3AAAA, probably because FLAG-SMAD3AAAA is more stable upon pVHL-mediated degradation than WT SMAD3 (Fig. 4 B). In comparison to WT cells, pVHL KD increased TGF-β–mediated signaling activity, which was inhibited in the presence of a TGF-β receptor inhibitor (SB-431542 [SB4]). Because SMAD4 is required to form an active complex with SMAD2/3 for signal transduction (David and Massagué, 2018; Tang et al., 2020; Zhang et al., 2017), KD of SMAD4 using siRNA (siSMAD4) also abolished pVHL KD–mediated activation of TGF-β signaling (Fig. 4 B). Upon pVHL OE, TGF-β signaling activity was blocked but rescued by expressing SMAD3FL or SMAD3AAAA mutants (Fig. 4 B). These results show that pVHL negatively regulates TGF-β signaling activity by control of available SMAD3–SMAD4 complex.
Figure 4.

pVHL impairs the activity of TGF-β/SMAD3 signaling in cells. (A) pVHL represses the phosphorylation of SMAD2/3 with stimuli of TGF-β. The phosphorylation of SMAD2/3 was compared in cells expressing pVHL WT or pVHL m98, pVHL-deficient cells, or cells treated with pVHL inhibitor. Densitometric analysis is shown in Fig. S4 A. (B) pVHL interferes with TGF-β/SMAD3 signaling, as determined by the TGF-β luciferase reporter. siSMAD4, SMAD4 siRNA. (C) pVHL inhibits ID1 expression, as determined by qRT-PCR. (D) pVHL suppresses TGF-β–mediated cell mobility in a wound-healing assay. (E) pVHL represses TGF-β–mediated migration/invasion signaling. For B–D, dot plots were used, and the fold change compared with the respective control is depicted. One-way ANOVA and one-sided Student’s t test were performed in B (n = 4), C (n = 6), and E (n = 4). *** P < 0.001; the center line represents the median. Scale bar, 40 µm.
Figure S4.

pVHL impairs the activity of TGF-β/SMAD3 signaling in cells. (A) Densitometric immunoblotting result of SMAD2/3 and pSMAD2/3 from Fig. 4 A. (B and C) pVHL repressed ID2 (B) and CTGF expression (C), two putative TGD-β/SMAD3 downstream genes, determined in qRT-PCR. (D) Immunostaining with Hoechst dye after 48 h to visualize invading cells. In A, quantification data are presented as mean ± SEM. One-way ANOVA and one-sided Student’s t test were performed in B (n = 6) and C (n = 6). **, P < 0.01; ***, P < 0.001; the center line represents the median.
Studies have shown that SMAD3–SMAD4 complex binds to the promoter of inhibitors of differentiation (IDs) 1 and 2 and connective tissue growth factor (CTGF) under stimuli of TGF-β and enhances cell motility (Cheng et al., 2012; Di et al., 2007; Liang et al., 2009). In line with results from the luciferase assay, pVHL KD increased the gene expression of ID1, ID2, and CTGF upon the treatment of TGF-β for 1 h, which was significantly reduced in cells lacking SMAD4 or treated with SB4 (Fig. 4 C; and Fig. S4, B and C). In contrast, pVHL OE suppressed the expression of these genes, which was rescued by overexpression of SMAD3FL or variant SMAD3AAAA, which is resistant to pVHL-mediated degradation (Fig. 4 C and Fig. S4, B and C). Consistently, results from a wound-healing assay and cell migration assay confirmed pVHL was negatively correlated with TGF-β–mediated cell mobility. As shown in Fig. 4, D and E and Fig. S4 D, pVHL KD promoted cell migration, which was inhibited either in the presence of TGF-β receptor inhibitor or with KD of SMAD4. In addition, cellular mobility was attenuated in cells overexpressing pVHL, which can be rescued by ectopic expression of SMAD3AAA or SMAD3FL. These results supported our finding that pVHL is an E3 ligase for SMAD2/3 ubiquitination and thus negatively regulates TGF-β/SMAD2/3 signaling–mediated cell migration.
pVHL negatively controls TGF-β/SMAD3 signaling in Drosophila
TGF-β/R-SMAD signaling is involved in the regulation of cell proliferation, tissue growth, and patterning in Drosophila wing development (Hevia and de Celis, 2013; Hevia et al., 2017; Peterson and O’Connor, 2014). To establish the physiological relevance of the characterized role of pVHL in the regulation of the TGF-β/R-SMAD signaling cascade in cell culture experiments, we studied the gain or loss of function of Drosophila VHL (dVHL) in Drosophila during wing development. Previous studies have shown that TGF-β signaling is important for epithelial cell proliferation and controlling tissue size in Drosophila wing (Brummel et al., 1999; Hevia and de Celis, 2013). Therefore, we first assessed the physiological effect of dVHL expression in vivo by examining the size and pattern in the adult wing. Drosophila only have one regulatory SMAD in TGF-β signaling (encoded by Smox), and it is closely related to SMAD2 and SMAD3 in vertebrates (Peterson and O’Connor, 2014). Studies have shown that loss of Smox results in smaller wings with minor vein thickening in the region of the posterior crossing veins (PCVs) and longitudinal veins 4 and 5 (Hevia and de Celis, 2013). We found that expression of full-length dVHL, but not the dVHLYH variant with a conserved Y-H mutation at Drosophila residue 51 (which is equivalent to human residue Y98H; Hsouna et al., 2010), in the wing pouch using Nubbin-Gal4 causes formation of smaller wings as well as ectopic veinlets in distal regions of longitudinal veins 4 and 5 and PCVs (Fig. S5, A–H). These phenotypes were similar to those observed in the loss of function of TGF-β type I receptor (Babo) and R-SMAD (Smox; Fig. S5, A–H). These results indicated that dVHL negatively regulates TGF-β signaling in Drosophila wing development and that the tyrosine residue (Y51) in the β domain of dVHL is also required for the interaction with Smox.
Figure S5.

dVHL negatively regulates TGF-β/dSMAD signaling in Drosophila wing development. (A–F) Effect of dVHL expression and TGF-β/dSMAD loss of function in Drosophila wing. nub>w1118 flies show normal wings (A), while flies expressing WT dVHL (B), Babo RNAi (D), or Smox RNAi (E and F) show smaller wing sizes with ectopic veinlets; this wing development defect effect is not seen in flies expressing the Y-H mismatched dVHL (C). (G) Quantification of the percentage wing size reduction shown in A–F (n ≥ 50). ***, P < 0.001. Quantification data are presented as mean ± SEM. (H) Ectopic veinlets are observed in the PCV region and/or L5 of Drosophila wing upon dVHL expression or TGF-β/Smad3 loss of function. (H’) Quantification of the percentage of flies showing ectopic veinlets in the wing of indicated genotypes. Red stars denote ectopic veinlets formation in adult Drosophila wing. Scale bars, 250 µm (A–F).
We next analyzed the loss of dVHL function in the developing Drosophila wing imaginal discs. We found that KD of dVHL by independent RNAi transgenes (dVHL-RNAiKK and dVHL-RNAiTrip) resulted in an increased number of mitotic cells, as indicated by phospho-histone 3 staining (Fig. 5, A–F). This increased proliferation was also observed in the wing discs upon expression of an active form of Babo (Nubbin-Gal4>BaboAct; Fig. 5, C and F). In addition, Babo activation and dVHL KD induced Drosophila SMAD (dSmad2) protein expression (Fig. 5, G–I). Conversely, dVHL expression reduced dSmad2 expression in the wing discs (Fig. 5 J). Hevia et al. (2017) showed that Smox activation induces CG9008 expression and that KD of Smox caused a reduced level of CG9008 in the wing disc; moreover, CG9008 loss of function mimics the Smox depletion phenotype in Drosophila wing. These data suggest that CG9008 acts as a bona fide Smox transcriptional target to control wing development. We next investigated the expression of Smox/dSmad2 target (CG9008) in the dVHL loss-of-function condition by fluorescence in situ hybridization. We found that the expression of CG9008 was up-regulated in the wing pouch of dVHL-depleted wing disc, which is consistent with Babo activation (Fig. 5, K–N). These results suggest dVHL negatively controls the protein level of Smox, expression of Smox target gene, and Smox-mediated proliferation during Drosophila wing development.
Figure 5.

dVHL negatively regulates TGF-β/dSMAD signaling in Drosophila wing development. (A) Schematic view of the Drosophila third-instar wing imaginal disc. Nubbin-Gal4 driver is specifically expressed in the wing pouch (highlighted by an orange circle). (B–E) Analysis of phospho-histone 3–positive mitotic cells in the wing disc of Nubbin-Gal4>w1118 (B, n = 8), Nubbin-Gal4>UAS-BaboACT (C, n = 3), Nubbin-Gal4>dVHL-RNAiKK (D, n = 6), and Nubbin-Gal4>dVHL-RNAiTrip (E, n = 7) third-instar Drosophila. Nuclei are stained with DAPI in blue, and PH3-positive cells are labeled in green. (F) Quantification of PH3-positive cells in the pouch of wing discs with indicated genotypes. (G–J) Representative images of the imaginal discs of Nubbin-Gal4>w1118 (G), Nubbin-Gal4>UAS-BaboACT (H), Nubbin-Gal4>dVHL-RNAiKK (I), and Nubbin-Gal4>UAS-dVHLWT (J) third-instar Drosophila. Nuclei are marked in blue and dSmad2 antibody staining are shown in red or gray. (K–N) Fluorescence in situ hybridization analysis of expression of the Smox target CG9008 in the wing disc of Nubbin-Gal4>w1118 (K), Nubbin-Gal4>UAS-BaboACT (L), Nubbin-Gal4>dVHL-RNAiKK (M), and Nubbin-Gal4>dVHL-RNAiTrip (N) third-instar Drosophila. Nuclei are marked in blue and CG9008 are marked in red or gray. (O) Effect of dVHL loss of function in Drosophila wing. (P) Schematic view of normal and dVHL loss or TGF-β activation wing epithelia. (Q) Quantification of percentage of flies show bow (downward bending) wings of indicated genotype (n ≥ 25). Scale bars, 30 µm (B–K). In F, quantification data are presented as mean ± SEM (n ≥ 10). One-way ANOVA and one-sided Student’s t test were performed. **, P < 0.01; ***, P < 0.001; the center line represents the median.
In addition, we observed that dVHL RNAi leads to a marked downward bending of the wing blade (Fig. 5, O–Q). This phenotype also appeared in the flies expressing an active form of Babo (BaboACT). The downward bending wing is characteristic of hyperproliferation in the apical wing compartments. We then asked whether TGF-β signaling was associated with wing developmental defect induced by dVHL loss of function. To address this, we coexpressed dVHL RNAi with either Babo-RNAi or Smox RNAi and examined the wing development defect. The abnormal growth wing in VHL-depleted flies was rescued by Smox RNAi, but not by knocking down an unrelated hedgehog signaling component (Smoothened; Fig. 5 Q). In addition, Babo-RNAi partially rescued the dVHL RNAi–induced downward wing blade phenotype (Fig. 5 Q). Meanwhile, Smox RNAi–inhibited BaboACT induced downward “bowing” of the wing blade (Fig. 5 Q). These results suggest dVHL loss of function induces a wing development defect through activation of TGF-β/SMAD signaling.
Discussion
TGF-β/SMAD signaling plays essential and complex roles in development and diseases, including cancer (David and Massagué, 2018). TGF-β/SMAD signaling is highly conserved and controls various fundamental cellular processes, including cell proliferation, survival, migration, and senescence (Moustakas and Heldin, 2009). However, the nature of the molecular mechanisms of context-dependent TGF-β signaling is still largely unknown (Zhang et al., 2017). It is thus interesting to uncover regulatory components for a better understanding of the physiological and developmental regulation of TGF-β signaling. Using a small-molecule approach combined with proteomics analysis and an siRNA screen, we found that pVHL is a SMAD2/3 E3 ligase, which negatively regulates TGF-β signaling.
pVHL contains an α-domain and a β-domain. The α-domain is responsible for the interaction with other E3 ligase complex components, while the β-domain enables recognition and binding of substrates. Earlier studies reported a cluster of mutations (R82P, P86H, N90I, Q96P, Y98N, Y112H, and W117R) in the β-domain of pVHL that are important for substrate recognition in the ubiquitin-dependent proteolysis of HIF-1α (Li et al., 2007). In line with these findings, we demonstrate that the tyrosine Y98 and tryptophan W117 in the β-domain of pVHL are important for the interaction with SMAD2/3 and subsequent ubiquitination. Binding of pVHL to HIF-1α also requires the hydroxylated proline residues in LxLLAP motif of NODD or LxxLAP motif of CODD (Ivan et al., 2001). We found a similar and essential proline in conserved LxLNGP motif of SMAD3 at position 403 (P403). Hydroxylated proline residue–dependent interactions have been generally observed in pVHL substrates, including IKKα and IKKβ (proline residues P191; Cummins et al., 2006) or zinc fingers and homeoboxes 2 (ZHX2, P427, P440, and P464; Zhang et al., 2018). Consistently, we found that pVHL-mediated SMAD3 degradation was significantly suppressed in the presence of chemical proline hydroxylase inhibitor CoCl2, genetic mutation of LNGP to AAAA, or mutation of the corresponding lysine (K378R). P403 of SMAD3 is located at the junction of β-sheet and α-helix. Recently, Miyazono et al. reported the interaction of SKI with SMAD2 at the helix bundle regions, including proline 445, which is equal to P403 of SMAD3 (Miyazono et al., 2018). We found the hydroxylation in SMAD3 variants containing LNGP in MH2 domain. Thus, our results demonstrate that the hydroxylated proline residue within the LNGP motif of SMAD3, as well as lysine K378 and catalytically active pVHL, are indispensable for the degradation. Moreover, alignment analysis showed that the L(I)xLxGP motif is highly conserved in R-SMADs cross human, Drosophila, and zebrafish. K378 is a part of the KGWG motif and conserved among all SMADs, namely TGF-β–related SMAD2/3 and BMP-related SMAD1/5/8, as well as the inhibitory SMADs SMAD6 and SMAD7 (Dupont et al., 2009; Morén et al., 2003). This imposes an interesting hypothesis on if pVHL-mediated ubiquitination of K378 of Smad3 could be extrapolated to SMAD1/5/8, however this requires further investigation.
Previous studies have shown that TGF-β/SMAD signaling activates pro-invasive factors and promotes cell invasion (Dai et al., 2012; Miettinen et al., 1994; Moore et al., 2008). For instance, cultured epithelial cells in response to TGFβ lose their epithelial features and gain mesenchymal properties, a process that is referred to as epithelial-to-mesenchymal transition (EMT; Xu et al., 2009). EMT is often used by cancer cells for invasion and metastasis (Batlle and Massagué, 2019; David and Massagué, 2018). Our results showed that loss of pVHL promotes TGF-β/SMAD-dependent cell migration. In human, deletions or mutations in the VHL gene often lead to VHL disease, a hereditary cancer syndrome that includes clear cell renal cell carcinoma, hemangioblastoma, and pheochromocytoma (Tarade and Ohh, 2018). A recent study reported an inverted correlation of pVHL expression with TGFβ receptor expression (Mallikarjuna et al., 2018). Our results showed that loss of pVHL enhanced Smad2/3 C-terminal phosphorylation and target gene expression, which promoted TGF-β/SMAD–dependent cell migration. Thus, the tumor suppressor activity of pVHL might be at least partially due to its negative modulation of TGF-β/SMAD–mediated biological responses, such as EMT, in cancer models.
Many developmental signaling pathways including TGFβ were originally identified in Drosophila and are evolutionarily conserved in mammals (Funk et al., 2020; Pires-daSilva and Sommer, 2003). The Drosophila wing is an excellent model for investigating gene networks and signal transductions, which have important roles in cell growth, proliferation, and patterning (Wang and Dahmann, 2020). TGF-β signaling is critical for cell proliferation and EMT in the Drosophila wing development (Hevia and de Celis, 2013; Hevia et al., 2017; Peterson and O’Connor, 2013, 2014). Consistent with the wing phenotype in loss of TGF-β signaling, we found that the expression of dVHL displayed a reduced wing size and ectopic vein formation. This phenotype is not seen in the wing of flies expressing an Y-H mutated dVHL variant at amino acid residue 51, which is equivalent to a tyrosine residue mismatch mutation (Y98H) in human VHL gene (Hsouna et al., 2010). The Y98H tyrosine residue exchange in the β-domain of pVHL is involved in the recognition and binding of VHL substrate, and it is also one of the most frequent mutations in VHL-related diseases (Hsouna et al., 2010; Knauth et al., 2006; Li et al., 2007). Hence, these data suggest a conserved, negative role for VHL in the regulation of TGF-β signaling in Drosophila wing development and that dVHL might interact with Smox in the β-binding domain similar to HIF-1α. In support of this, Smox depletion rescues the VHL loss–induced bow wing phenotype. The downward bending or bow wing phenotype caused by overproliferation of apical wing compartments has also been seen in flies expressing a dominant-negative form of Merlin (Gavilan et al., 2014; LaJeunesse et al., 1998). Merlin is known as a tumor suppressor protein that activates the Hippo pathway to repress the Drosophila YAP/TAZ homologue Yorkie (Elbediwy and Thompson, 2018). In mammalian cells, YAP/TAZ forms a transcription complex with SMADs to regulate common targets (Luo, 2017). For instance, the YAP-TEAD4-SMAD3-p300 transcription complex is recruited to the promoter of CTGF to activate its expression. Previous studies have also shown that Yorkie cooperates with Smox to regulate cell proliferation in Drosophila wing (Hevia et al., 2017). Based on these observations, we speculated that dVHL/dSMAD and Merlin/Yorkie converge at the level of transcription regulation of common targets involved in cell proliferation in Drosophila wing.
In addition, we found VHL negatively regulates a Smox target (CG9008) in the wing imaginal discs. CG9008 encodes glucose-6-phosphate 1-epimerase, which is involved in glycolysis. Interestingly, previous studies have shown that KD of several glycolytic enzymes, such as CG9008, CG6058 (aldolase), and CG8893 (glyceraldehyde 3-phosphate dehydrogenase), rescues Smox activation–induced wing phenotypes (Hevia et al., 2017). These observations may imply that TGF-β/R-SMAD–mediated sugar metabolism is required for wing cell proliferation and tissue growth in Drosophila.
Taken together, our results demonstrate that pVHL inhibits TGF-β signaling by ubiquitination and proteasomal degradation of SMAD3, which requires a conserved LxLxxP motif located in the MH2 domain of SMAD3. This degradation was considerably attenuated by mutations of either the LNGP motif to AAAA, including proline (P403) or lysine K378 of SMAD3 (K378R), or the tyrosine (Y98N) and tryptophan (W117R) residues in the β domain of pVHL. Loss of pVHL enhanced TGF-β signaling activity and therefore promoted SMAD3/SMAD4–dependent cell migration. In Drosophila, expression of WT dVHL resulted in smaller wing size and ectopic veinlets, similar to the phenotype induced by loss of TGF-β signaling, while normal wing size was observed in the case of overexpressing a dVHL Y-H mutation. Thus, our finding suggests that pVHL physically interacts with SMAD3 through the LxLxxP motif in the MH2 domain and serves as a bona fide E3 ubiquitin ligase for SMAD3 degradation. Considering the highly conserved MH2 domain of R-SMADs in various species, our findings implicates a general role for pVHL in the regulation of TGF-β/SMAD–related cellular processes in development, immunology, and cancer.
Materials and methods
Chemistry
Reagents
Solvents and reagents obtained from commercial suppliers were at least of reagent grade or were purified according to prevailing methods before use. TLC was performed to monitor the chemical reactions using Alugram SIL G/UV254 sheets (Macherey & Nagel). Silica column chromatography was conducted using silica gel 60 (Macherey & Nagel; 0.040–0.063 mm). The purity of compounds was determined at least more than 96% by HPLC analysis.
Analytical methods
1H (300 Hz) and 13C nuclear magnetic resonance (NMR; 75 Hz) spectra were recorded on a Varian 300 MHz NMR system. Chemical shifts are reported in ppm. DMSO-d6 was used as solvent and defined as δ = 2.50 for 1H and δ = 40.0 for 13C. The following abbreviations are used to explain the multiplicities in NMR spectra: s, singlet; d, doublet; t, triplet; q, quartet; and m, multiplet. High-resolution mass spectra (HR-MS) were recorded on a Bruker ApexQe hybrid 9.4 T FT-ICR (ESI).
Synthesis of biotinylated E738
(Scheme 1).
Synthesis of biotin-E738
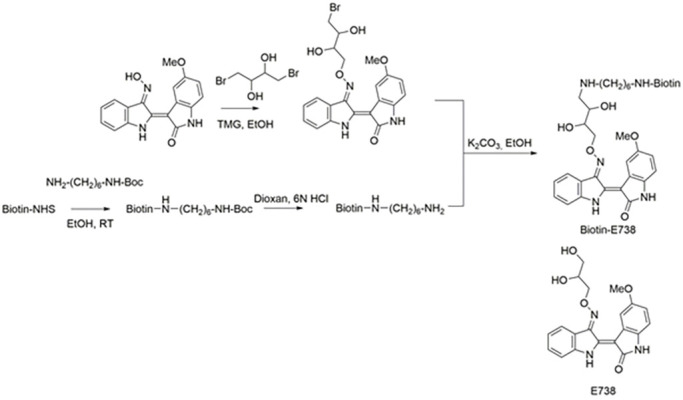
The synthesis of indirubin derivatives was exclusively described in our previous article (Cheng et al., 2017a). Briefly, a mixture of 5-methoxyindirubin-3′-oxime (1 mmol) and 1,4-dibromobutane-2,3-diol (2 mmol) in ethanol (20 ml) was stirred overnight at RT, in which 1,1,3,3-tetramethylguanidine (7 mmol) was added as a base. After adding 200 ml water, the reddish precipitate was filtered off, washed with water, and dried to afford 5-methoxyindirubin-3′-(4-bromo-2,3-dihydroxybutyl)-oxime (95%).
A mixture of biotin-NHS (1 mmol) and tert-butyl (6-aminohexyl)carbamate (1.05 mmol) in ethanol (5 ml) was stirred overnight at RT. After adding 50 ml water, the colorless precipitate was filtered off, washed with water and dried. The raw product was stirred in a mixture of dioxin:6 N HCl (5:1) for 3 h. Sodium carbonate was added for pH neutralization. The solvent was evaporated to afford biotin-1,6-diamine.
Finally, biotin-E738 was achieved in a reaction of 5-methoxyindirubin-3′-(4-bromo-2,3-dihydroxybutyl)-oxime (1 mmol) with biotin-1,6-diamine (2 mmol) in ethanol (5 ml) with sodium carbonate as base. The precipitate appeared after adding 50 ml water and filtered and dried.
5-methoxyindirubin-3′-(4-bromo-2,3-dihydroxybutyl)-oxime
1H-NMR (DMSO-D6): 3.56–3.57 (m, 1H), 3.76–3.79 (m, 5H), 4.12–4.15 (m, 1H), 4.60–4.66 (m, 2H), 5.25 (d, 1H, J = 6), 5.39 (d, 1H, J = 3), 6.72–6.82 (m, 2H), 7.00–7.05 (m, 1H), 7.37–7.46 (m, 2H), 8.19 (d, 1H, J = 4), 8.29 (d, 1H, J = 2), 10.58 (S, 1H), 11.76 (s, 1H).
13C-NMR: 46.5, 56, 69.3, 71.9, 78.6, 101.4, 109.2, 109.8, 112.2, 113.4, 116.8, 121.9, 123.5, 129.1, 133.3, 133.4, 144.4, 145.9, 152.1, 154.7, 171.5.
HR-MS: C21H20BrN3O5: 473.0586 (calculated), 473.0581 [M]+ (found).
Biotin-1,6-diamine
1H-NMR (D2O:DMSO-D6 = 1:1): 1.16–1.46 (m, 12H), 2.01–2.06 (m, 2H), 2.10–2.12 (m, 1H), 2.16–2.19 (m, 1H), 2.25–2.28 (m, 1H), 2.43 (m, 1H), 2.55–2.63 (m, 1H), 2.76–2.82 (m, 1H), 2.94–3.00 (m, 3H), 3.07–3.09 (m, 1H), 4.12–4.16 (m, 1H), 4.31–4.35 (m, 1H).
HR-MS: C16H31N4O2S: 343.2162 (calculated), 343.2123 [M+H]+ (found).
Biotin-E738
1H-NMR (DMSO-D6): 1.17–1.50 (m, 10H), 1.99–2.27 (m, 3H), 2.70–2.85 (m, 1H), 2.99–3.09 (m, 3H), 3.33–3.59 (m, 12H), 3.73–3.79 (m, 5H), 4.28–4.30 (m, 1H) 4.60–4.67 (m, 2H), 5.26–5.52 (m, 1H), 6.35–6.42 (m, 1H), 6.73–6.82 (m, 2H), 7.01–7.06 (m, 1H), 7.39–7.44 (m, 2H), 7.72 (s, 1H), 8.19–8.21 (m, 1H), 8.28–8.31 (m, 1H).
HR-MS: C37H49N7O7S: 735.3414 (calculated), 736.3487 [M+H]+ (found).
Biology
Plasmids and antibodies
HA-VHL-pRc/cytomegalovirus (Addgene; 19999), HA-VHL W117R-pBabe-puro (Addgene; 19239), HA-VHL Y98N-pBabe-puro (Addgene; 19236), CS2 FLAG-Smad3 (Addgene; 14052), CS2 FLAG-Smad3 EPSM (Addgene; 14963), pRK Smad3LC FLAG (Addgene; 14829), pRK Smad3C FLAG (Addgene; 14830), pRK Smad3NL FLAG (Addgene; 14828), pRK Smad3N FLAG (Addgene; 14827), and LPCX Smad3 deltaSSVS (Addgene; 12639) were purchased from Addgene. VHL-GFP plasmid and the mutations of FLAG-SMAD3K-R and FLAG-SAMD3AAAA were synthesized and characterized by Genscript. SMAD3-OFP plasmid was purchased from Sino Biological (Biozol). TGF-β1 CAGA luciferase reporter construct was a gift from Dr. Steven Dooley (University Hospital Heidelberg, Heidelberg, Germany). Antibodies to SMAD2/3 (#8685), FLAG (#8146), HA (#2367), and p-SMAD3 (#9520) were purchased from Cell Signaling Technologies; sheep anti-Drosophila dSmad2 polyclonal antibody was purchased from R&D Systems (AF7948-SP). Ubiquitin (#SC-166552), actin (#SC-47778), and vinculin (#SC-73614) antibodies were obtained from Santa Cruz Biotechnology; pVHL (#140989), ubiquitin (#137031), and hydroxyl proline (#37067) antibodies were purchased from Abcam (Table S1). siRNAs for screen were purchased from Thermo Fisher Scientific (Table S2). siVHL2 was purchased from OriGene (305075). The information of chemical reagents used in this study can be found in Table S3.
siRNA sequences
The following siRNA sequences were used: NCCRP1, sense: 5′-CGAACAACCAGCCACGtt-3′; antisense: 5′-CGUAAUGGCUGGUUGUUCGtc-3′; CUL1, sense: 5′-GGGCCCUACGUUAACAGUGtt-3′; antisense: 5′-CACUGUUAACGUAGGGCCCtt-3′; CUL4A, sense: 5′-GCGAGUACAUCAAGACUUUtt-3′; antisense: 5′-AAAGUCUUGAUGUACUCGCtc-3′; USP5, sense: 5′-GGUGAAGUACACCCAGCGAtt-3′; antisense: 5′-UCGCUGGGUGUACUUCACCtt-3′; UCHL5, sense: 5′-GGCCUGUCAUAGAAAAAAGtt-3′; antisense: 5′-CUUUUUUCUAUGACAGGCCtt-3′;YOD1, sense: 5′-GGCCUUAAACGUGUCAUAUtt-3′; antisense: 5′-AUAUGACACGUUUAAGGCCtc-3′; UBA52, sense: 5′-GGUGGCAUUAUUGAGCCUUtt-3′; antisense: 5′-AAGGCUCAAUAAUGCCACCtc-3′; UBE2S, sense: 5′-CAAGGAGGUGACGACACUGtt-3′; antisense: 5′-CAGUGUCGUCACCUCCUUGta-3′; HERC6, sense: 5′-AAGAAUUGAUGGCCUAGUUtt-3′; antisense: 5′-AACUAGGCCAUCAAUUCUUtc-3′; TRIM25, sense: 5′-GGCACAAACUAACUGUCAUtt-3′; antisense: 5′-AUGACAGUUAGUUUGUGCCtc-3′; TRIM29 sense: 5′-CCCGUUACCUUUGCCGAAAtt-3′; antisense: 5′-UUUCGGCAAAGGUAACGGGtg-3′; HIF1A, sense: 5′-GGCAGCAGAAACCUACUGCtt-3′; antisense: 5′-GCAGUAGGUUUCUGCUGCCtt-3′; Cul2, sense: 5′-GCAACAUGGAAUGACCGUUtt-3′; antisense: 5′-AACGGUCAUUCCAUGUUGCtc-3′; RBX1, sense: 5′-GGAACCACAUUAUGGAUCUtt-3′; antisense: 5′-AGAUCCAUAAUGUGGUUCCtg-3′; MDM2, sense: 5′-GCCAUUGCUUUUGAAGUUATT-3′; antisense: 5′-UAACUUCAAAAGCAAUGGCTT-3′; and VHL, sense: 5′-GGAGCGCAUUGCACAUCAATT-3′; antisense: 5′-UUGAUGUGCAAUGCGCUCCTG-3′. All siRNAs were purchased from Thermo Fisher Scientific. Bases written in lowercase letters are not part of the gene-specific sequnece and added for functionality.
Cell culture and transfection
HeLa and HCT116 cells were cultured in DMEM (Gibco) containing 10% FBS (Gibco), 100 U/ml penicillin and 100 µg/ml streptomycin (Gibco) at 37°C in a humidified atmosphere under 5% CO2. Overexpression and KD were performed as previously described (Dabiri et al., 2019). Lipofectamine 3000 was used for transfection following the manufacturer’s instructions. Briefly, the mixture of p3000 reagent (5 µl) with either 20 nM siRNA for KD or 2,500 ng DNA for overexpression in 100 µl Opti-medium (Gibco) was added into 100 µl Opti-medium containing 5 µl Lipofectamine 3000 and incubated at RT for 5 min. The mixture was added into cells with ∼60–70% of confluency in a 6-well plate. The medium was changed once after 24-h incubation, and the experiment was performed after 48 h incubation.
VHL-knockout cell line using CRISPR-Cas9
pVHL-knockout cell lines were generated using AVO plasmid containing Cas9 and tdTomato sequences. Gene-specific guide RNAs are inserted through a directional BsmBI cloning site. For cloning, the plasmid was digested with BsmBI, and the following sgRNA sequences to target the VHL gene were inserted: sgRNA1, 5′-CGCGCGTCGTGCTGCCCGTA-3′; sgRNA2, 5′-GCCGTCGAAGTTGAGCCATA-3′; sgRNA3, 5′-GTGCCATCTCTCAATGTTGA-3′; and sgRNA4, 5′-CAGGTCGCTCTACGAAGATC-3′. For KD, HeLa cells were cotransfected with two or four plasmids containing sgRNAs using polyethyleneimine (Sigma-Aldrich). After 2 d, cells were collected and reseeded in 6-well plates at a density of 500 cells/well. Transfection of cells was monitored by tdTomato expression. Seven monoclonal cell lines were expanded and tested for VHL knockout using Western blot. HeLa clones that showed successful knockout of pVHL were used for further experiments.
Electrophoresis and immunoblotting
Electrophoresis was performed as described previously. Briefly, cells were lysed in 6 M urea–lysis buffer (1 mM EDTA, 0.5% Triton X-100, 5 mM NaF, and 6 M urea) with protease and phosphatase inhibitors (1 mM Na3VO4, 10 µg/ml Pepstatin, 100 µM PMSF, and 3 µg/ml Aprotinin in PBS). Total protein was resolved on 10% or 8% SDS-PAGE gels. Resolved proteins on SDS-PAGE were transferred onto a polyvinylidene fluoride membrane (GE Healthcare). The membrane was blocked with 5% milk and incubated with primary antibody (1:1,000) overnight at 4°C. β-Actin (Santa Cruz Biotechnology; 1:1,000) was used as loading control. Detailed information regarding the primary antibodies used in this study is included in Table S1. To reduce background, clean-Blot IP detection reagent was used for samples collected from immunoprecipitation. SuperSignal West Pico Plus Chemiluminescent Substrate (Thermo Fisher Scientific) and the Fujifilm LAS-3000 imaging system were used to image the membrane. Aida image analysis software was used to quantify the intensity of signals.
Proteome-wide analysis
Cells were treated with biotinylated E738 (5 µM) overnight or transfected with siVHL for 48 h. Cells were lysed with 6 M urea buffer. Proteins were separated on 10% SDS-PAGE. Proteomic analysis was performed by the Core Facility for Mass Spectrometry and Proteomics at the Zentrum für Molekulare Biologie der Universität Heidelberg. As previously reported, Enrichment analysis of protein-coding genes was performed (Cheng et al., 2020). Both original and analyzed data are provided.
Immunohistochemistry on patient samples
Sample collection and section preparation
Human liver tissues were resected from patients with hepatocellular carcinoma (HCC; diagnoses were established by conventional clinical and histological criteria according to the World Health Organization, and all clinical investigation was conducted according to the principles expressed in the Declaration of Helsinki), and cancerous and noncancerous areas were taken during surgery (the study was approved by the ethics committee of the Medical Faculty Heidelberg of Heidelberg University Ethikkommission I Heidelberg [Studienzeichen: S-202/2012]). Resected tissues were transferred (on ice) to the laboratory within 40 min of resection and kept in 4% PFA at 4°C overnight. OCT block prepared from both cancerous and noncancerous area from same patient in one block. OCT blocks were cut into 4 µm slices and mounted on poly-l-lysine-coated slides. Table 1 lists patient information.
Table 1. Patient information.
| Patient number | Patient age, sex | Diagnosis | Tissue preparation |
|---|---|---|---|
| 4 | 72 yr, male | HCC | |
| 5 | 62 yr, male | Metastasis, pancreas to liver | RT-PCR, OCT, paraffin |
| 7 | 60 yr, female | Metastasis, liver and thyroid | RT-PCR, OCT, paraffin |
| 8 | 62 yr, male | CCC | RT-PCR, OCT, paraffin |
| 9 | 62 yr, male | HCC | RT-PCR, OCT, paraffin |
| 10 | 53 yr, female | Cancerous area, pancreas cancer | OCT, paraffin |
| 14 | 62 yr, male | HCC | RT-PCR, OCT, paraffin |
| 17 | Unknown | Colorectal, metastasis to the liver | RT-PCR, OCT, paraffin |
| 18 | 44, female | Colorectal, metastasis to liver | RT-PCR, OCT, paraffin |
| 19 | 53 yr | Liver, metastasis from pancreas | RT-PCR, OCT, paraffin |
| 20 | Unknown | CCC | RT-PCR, paraffin |
| 22 | 37, male | Metastasis, colon to liver | RT-PCR, OCT, paraffin |
| 24 | 76 yr, male | HCC | RT-PCR, OCT, Paraffin |
| 25 | Female | Colorectal, metastasis from colon to the liver | OCT, paraffin |
| 28 | 68 yr, female | Duodenum, metastasis to liver | RT-PCR, OCT, paraffin |
| 29 | 54 yr, female | HCC | RT-PCR, OCT, paraffin |
| 31 | 67 yr, male | HCC | RT-PCR, OCT, paraffin |
CCC, cholangiocellular carcinoma.
Immunofluorescence
Immunofluorescence staining was done as previously reported (Ghafoory et al., 2018) using the antibodies listed in Table S1. After staining, slides were mounted with Mowiol medium and covered with coverslips. Images were taken on a Keyence BIOREVO microscope (BZ9000), a camera-based integrated fluorescence microscope. Collection of images was done at RT using 4×, 20×, and 40× magnifications using the Nikon objectives plan apochromat (Plan-Apo) ×4 (NA 0.20 and WD 20.00 mm), Plan-Apo ×20 (NA 0.75 and WD 1.00 mm), and Plan-Apo ×40 (NA 0.95 and WD 0.14 mm).
CoCl2 treatment
HeLa cells were transfected with siVHL (20 nM) and FLAG-SMAD3 for 48 h and treated with increasing concentrations of CoCl2 (12.5, 25, 50, 100, and 200 mM) for 8 h. The expression of pVHL and FLAG-SMAD3 was determined in immunoblotting.
Coexpression of SMAD-OFP and pVHL-GFP
HeLa cells were transfected with SMAD3-OFP and pVHL-GFP for 48 h in the presence or absence of MG132 (1 µM) overnight. The fluorescence intensity was measured in a plate reader using different filter setups, including pVHL-GFP (Em/Ex, 488/510), SMAD3-OFP (Em/Ex, 548/573), or FRET (Em/Ex, 488/573). Cells were fixed and images were taken using a Keyence BIOREVO fluorescence microscope (BZ9000) at RT using 4×, 20×, and 40× magnifications using the Nikon objectives Plan-Apo ×4 (NA 0.20 and WD 20.00 mm), Plan-Apo ×20 (NA 0.75 and WD 1.00 mm), and Plan-Apo ×40 (NA 0.95 and WD 0.14 mm).
Immunoprecipitation
A FLAG immunoprecipitation kit or the Pierce HA TAG IP/Co-IP kit was used to immunoprecipitate FLAG or HA tagging proteins, respectively. Cells were lysed with immunoprecipitation buffer (20 mM Tris-HCl, pH 7.5, 150 mM NaCl, 1 mM Na2 EDTA, 1 mM EGTA, 1% Triton, 2.5 mM sodium pyrophosphate, 1 mM β-glycerophosphate, 1 mM Na3VO4, 1 µg/ml leupeptin, and 1 mM PMSF) and purified according to the manufacturer’s instructions.
In vitro ubiquitination assay
As described before (Gama-Brambila et al., 2021a, 2021b) pVHL KD cells were transfected with FLAG-SMAD3 variants and freshly lysed with immunoprecipitation buffer before use. The HA-pVHL variants were individually expressed in HeLa cells and freshly isolated using FLAG immunoprecipitation kit according to the manufacturer's instructions. The assay was initiated with adding pVHL into cell lysis. The ATP consumption was determined in ENLITEN ATP Assay (Promega; FF2000). For immunoblotting, cell lysis was diluted in 5× loading dye (10% SDS, 500 mM DTT, 50% glycerol, 250 mM Tris-HCL, and 0.5% bromophenol blue dye, pH 6.8).
Wound-healing assay
The wound-healing assay was performed as previously reported HeLa cells were transiently transfected as indicated for 24 h (Cheng et al., 2014). Cells were trypsinized, resuspended, and plated at a high density of 200,000 cells/well into a 24-well plate and grown for 24 h to confluence (generally). In the middle of each well, the scratch was made by a sterile P-200 micropipette. Cells were washed three times with medium and treated as designed for 24–48 h before photographs were taken.
Cell migration assay
A cell migration assay (Abcam; 235673) was used to evaluate the cellular mobility under diverse conditions. Briefly, HeLa cells were transiently transfected as indicated for 18 h and starved in medium with 1% FCS for 6 h. Cells were trypsinized, resuspended, and replated at a density of 50,000 cells/well on the top chamber. Cells were stimulated with TGF-β1 in the presence or absence of chemical inhibitor (SB4) for 48 h. Hoechst dye was added to stain the migrated cells on the bottom chamber. The signal intensity was read by a plate reader.
TGF-β1 CAGA luciferase assay
The TGF-β1 CAGA luciferase reporter assay was performed as previously reported (Dabiri et al., 2019; Meyer et al., 2011). Briefly, HeLa cells were transfected with CAGA luciferase construct and treated as described in the main text. Cells were lysed with luciferase lysis buffer (25 mM Tris phosphate buffer, pH 7.8, containing 4 mM EGTA, 1% Triton X-100, 10% glycerol, and 2 mM fresh DTT, filtered through 0.45-µm sterile filter) at 37°C for 15 min. The protein concentration was measured by Bradford reagent (Sigma-Aldrich). A mixture of luciferin and ATP (100 µl) was added to 20 µl cell lysis in a white plate (Gibco), incubated for 5 min, and measured by Tecan Ultra plate reader. Activity was determined as the percentage luminescence intensity of treated versus control cells from at least five independent experiments.
Quantitative real-time PCR (qRT-PCR)
HeLa cells were transfected with various plasmids as designed for 48 h. Serum starvation was performed for 4 h and treated with TGFβ for 1 h with or without inhibitor. Total RNA was isolated with QIAzol (Qiagen). The same amount of RNA was synthesized to cDNA using ProtoScript First Strand cDNA Synthesis Kit (NEB). qRT-PCR was performed in a Light Cycler 96 (Roche) following the manufacturer’s protocol. SYBR Green PCR master mix (Nippon Genetics; qPCRBIO SyGreen Mix Lo-Rox) and the primer pairs of ID1, ID2, and CTGF listed below were reported previously (Cheng et al., 2012). Actin was used as an endogenous control. Data were normalized to the value of untreated cells showing the mean ± SD of quadruplicates and are representative of at least three independent experiments.
Primer sequences
The following primer sequences were used: ID1:forward, 5′-CATGAACGGCTGTTACTCAC-3′; reverse, 5′-GTTCCAACTTCGGATTCCGAG-3′; ID2: forward, 5′-GACTGCTACTCCAAGCTCAAG-3′;reverse, 5′-GTGATGCAGGCTGACAATAGTG-3′; CTGF:forward, 5′-CCAGACCCAACTATGATTAGAGC-3′;reverse, 5′-GAGGCGTTGTCATTGGTAAC-3′; and actin: forward, 5′-CTGACTACCTCATGAAGATCCTC-3′;reverse, 5′-CATTGCCAATGGTGATGACCTG-3′.
Statistics and reproducibility
Data were analyzed with GraphPad Prism software (v7.01). One-way ANOVA was performed. One-sided Student’s t tests were performed for all figures. All experiments (except for proteomics) were independently repeated at least three times, from which similar results were obtained. Data distribution was assumed to be normal, but this was not formally tested.
In vivo experiments
Drosophila stocks and husbandry
Animals were reared at either 18°C or 25°C with a 12-h light cycle with 60% humidity. 1 liter standard fly medium contains 44 g sugar syrup, 80 g malt, 80 g corn flour premium G750, 10 g soy flour, 18 g yeast, 2.4 g methly-4-hydroxybenzoate, 6.6 ml propionic acid, 0.66 ml phosphoric acid, and 8g agar, as previously described (Zhou and Boutros, 2020). dVHL overexpression was induced by crossing the transgenes UAS-VHLWT (WT) or UAS-VHLYH (Y-H mismatch mutation) with nubbin-Gal4. To obtain TGF-β gain- or loss-of-function wing phenotypes; Smox RNAi, Babo RNAi, UAS-BaboACT, Smo RNAi, and w1118 (control) were also made by crossing nubbin-Gal4. For the genetic interaction analysis, Smox RNAi or Smo RNAi were combined with dVHL RNAi to obtain the transgene combinants and then crossed with nubbin-Gal4. F1 progeny was maintain at 25°C for 10 d before wing mounting and entire Drosophila imaging. Animals in control or experimental groups are transferred to fresh food every 2 d to prevent fungal infection. The following fly strains were used: UAS-dVHLWT, UAS-dVHLYH (gift from Valeria Cavaliere, University of Bologna, Bologna, Italy) and Nubbin-Gal4 (BLN86108); w1118 (BLN3605); UAS-Babo-RNAiTrip (BLN40866); UAS-Smox-RNAiTrip (BLN33661); UAS-dVHL-RNAiTrip (BLN50727); UAS-Smo-RNAiTrip (BLN27037); UAS-BaboQ302D (BLN64293) from the Bloomington Drosophila Stock Center; and UAS-dVHL-RNAiKK (v108920); UAS-Smox-RNAiKK (v105687) from the Vienna Drosophila Resource Center.
Histology
The wing imaginal discs from Drosophila third-instar larvae were dissected in Schneider’s medium and fixed in 4% PFA for 20 min. Tissues were washed in 1X PBST (1X PBS containing 0.1% Triton X-100) four times and blocked with 1X PBST containing 1% BSA. The wing imaginal discs were then incubated with dSmad2 (1:100 dilution) or phospho-histone 3 antisera (1:500 dilution) in 1% BSA 1X PBT overnight at 4°C and washed four times with 1X PBST. Secondary antibodies were diluted to 1:3,000 in 1X PBST, and the tissues were incubated for 2 h at RT (20–22°C) on a shaker. The wing imaginal discs were later mounted in Vectashield mounting medium containing DAPI (Vector Labs).
FISH
RNA FISH in the wing imaginal discs was performed as described previously (Cheng et al., 2017b Preprint), with small modifications. Briefly, DNA oligonucleotides complementing the coding region of the target gene (CG9008) were designed and synthesized by PixelBiotch (https://www.pixelbiotech.com) and coupled with CAL Fluor Red 568 (an Alexa Fluor 568 replacement). For RNA in situ hybridization, the tissue was first dissected and fixed in 4% PFA for 20 min and then washed with 1X PBS and Triton X-100 (0.1%) three times (15 min each). The samples were further permeabilized in 70% ethanol overnight at 4°C. The probes were diluted with HuluHyb solution (2× SSC, 2M urea, 10% dextran sulfate, and 5× Denhardt’s solution) at 1:100. Tissue was washed with HuluWash (2× SSC and 2 M urea) two times for 10 min each time at RT. Then, tissue was incubated with probes at 30°C for at least 4 h. Tissue was washed four times (for 10 min each time) at RT. Thereafter, tissue was mounted in Vectashield mounting medium containing DAPI (Cheng et al., 2017b Preprint).
Image acquisition and processing
Drosophila samples were imaged using a light microscope camera system (Zeiss; SPOT Insight, Visitron Systems). Images for the capture of the mounted wing or entire Drosophila were taken with a 5× objective with zoom factors of 4× and 1.6×, respectively, using the SPOT Basic program. Images for the mounted wing imaginal discs were taken using a Leica SP8 confocal microscope. The images with 30 mm scale bars were taken on a 40× objective with zoom in factor of 1× using the LASx program. The brightness of images was adjusted using Adobe Photoshop. Image size and orientation were adjusted in Adobe Illustrator, and figures were assembled also using Adobe Illustrator.
Quantification and statistical analysis
For all quantifications, n equals the number of flies or wings used in the experiments. The results are presented as mean ± SEM. Comparisons between groups were made using an unpaired two-tailed Student’s t test. The significance of differences between groups is expressed as follows: *, P < 0.05; **, P < 0.01; ***, P < 0.001; and ns, no significant difference.
Quantification of wing size and phenotype penetrance
Each genotype was analyzed with at least eight wings, which allowed us to measure the average size of wings (Fig. 5 N; and Fig. S5, G and H’). Images were taken with a light microscope camera system (Nikon or Zeiss; SPOT Insight, Visitron Systems) with same zoom factor (4×). Later, wing size was measured and calculated manually using the ROI tool from Fiji.
Online supplemental material
Fig. S1 shows that pVHL regulates SMAD3 stability in HeLa cells and human patient tissues. Fig. S2 shows that pVHL directly interacts with SMAD3 for ubiquitination. Fig. S3 shows that the LxLxxP motif in the MH2 domain is indispensable for pVHL-mediated SMAD3 degradation. Fig. S4 shows that pVHL impairs the activity of TGF-β/SMAD3 signaling in cells. Fig. S5 shows that dVHL negatively regulates TGF-β/dSMAD signaling in Drosophila wing development. Table S1 lists the antibodies used in this study. Table S2 lists the siRNAs reagents used in this study. Table S3 lists the chemical reagents used in this study. Data S1 provides information about the proteomics data generated in this study.
Supplementary Material
lists antibodies used in this study.
lists siRNAs reagents used in this study.
lists chemical reagents used in this study.
provides information about the proteomics data generated in this study.
contains original blots for Fig. 1.
contains original blots for Fig. 2.
contains original blots for Fig. 3.
contains original blots for Fig. S1.
contains original blots for Fig. S2.
contains original blots for Fig. S3.
Acknowledgments
We are grateful to Siamak Redhai (Deutsches Krebsforschungszentrum [DKFZ], Heidelberg) for comments on the manuscript. We would like to thank T. Hsu (National Central University, Taoyuan City, Taiwan/China), V. Cavaliere (Università di Bologna, Bologna, Italy), the Bloomington Drosophila Stock Center, the Kyoto Stock Center, and the Vienna Drosophila RNAi Center for fly stocks. We thank Cheng laboratory members for helpful discussions and experimental support. We would also like to thank the Microscopy Core at the DKFZ for support.
This study was funded by the German Research Foundation (CH 1690/2-1 and 1690/2-3), the German Federal Ministry of Education and Research (PROXIDRUGS, IGlues, 03ZU1109EA), the LOEWE Center Frankfurt Cancer Institute/Hessen State Ministry for Higher Education, Research and the Arts (III L 5-519/03/03.001-0015).
The authors declare no competing financial interests.
Author contributions: J. Zhou designed and performed in vivo experiments, analyzed data, and wrote the manuscript. Y. Dabiri helped design and perform initial experiments. R.A. Gama-Brambila performed some cellular experiments. M. Altinbay performed IP/WB for hydroxyl proline. A. Seidel and S. Ghafoory performed experiments with patient samples. B. Blagojevic established VHL-knockout cell lines. A. Mehrabi and M. Golriz collected patient samples. K. Han helped to design and support the in situ hybridization experiments. I. Dikic helped design experiments. S. Wölfl performed alignment analysis for the revision and helped design cell culture experiments and write the manuscript. X. Cheng designed and performed cell culture experiments, analyzed data, and wrote the manuscript. All authors read the manuscript.
Data availability
The proteomics data generated in this study are available in Data S1.
References
- Batlle, E., and Massagué J.. 2019. Transforming growth factor-β signaling in immunity and cancer. Immunity. 50:924–940. 10.1016/j.immuni.2019.03.024 [DOI] [PMC free article] [PubMed] [Google Scholar]
- Brummel, T., Abdollah S., Haerry T.E., Shimell M.J., Merriam J., Raftery L., Wrana J.L., and O’Connor M.B.. 1999. The Drosophila activin receptor baboon signals through dSmad2 and controls cell proliferation but not patterning during larval development. Genes Dev. 13:98–111. 10.1101/gad.13.1.98 [DOI] [PMC free article] [PubMed] [Google Scholar]
- Cardote, T.A.F., Gadd M.S., and Ciulli A.. 2017. Crystal Structure of the Cul2-Rbx1-EloBC-VHL Ubiquitin Ligase Complex. Structure. 25:901–911.e3. 10.1016/j.str.2017.04.009 [DOI] [PMC free article] [PubMed] [Google Scholar]
- Chacko, B.M., Qin B.Y., Tiwari A., Shi G., Lam S., Hayward L.J., De Caestecker M., and Lin K.. 2004. Structural basis of heteromeric smad protein assembly in TGF-beta signaling. Mol. Cell. 15:813–823. 10.1016/j.molcel.2004.07.016 [DOI] [PubMed] [Google Scholar]
- Cheng, X., Alborzinia H., Merz K.-H., Steinbeisser H., Mrowka R., Scholl C., Kitanovic I., Eisenbrand G., and Wölfl S.. 2012. Indirubin derivatives modulate TGFβ/BMP signaling at different levels and trigger ubiquitin-mediated depletion of nonactivated R-Smads. Chem. Biol. 19:1423–1436. 10.1016/j.chembiol.2012.09.008 [DOI] [PubMed] [Google Scholar]
- Cheng, X., Holenya P., Can S., Alborzinia H., Rubbiani R., Ott I., and Wölfl S.. 2014. A TrxR inhibiting gold(I) NHC complex induces apoptosis through ASK1-p38-MAPK signaling in pancreatic cancer cells. Mol. Cancer. 13:221. 10.1186/1476-4598-13-221 [DOI] [PMC free article] [PubMed] [Google Scholar]
- Cheng, X., Merz K.-H., Vatter S., Zeller J., Muehlbeyer S., Thommet A., Christ J., Wölfl S., and Eisenbrand G.. 2017a. Identification of a water-soluble indirubin derivative as potent inhibitor of insulin-like growth factor 1 receptor through structural modification of the parent natural molecule. J. Med. Chem. 60:4949–4962. 10.1021/acs.jmedchem.7b00324 [DOI] [PubMed] [Google Scholar]
- Cheng, Y.-S., Zhuo Y., Hartmann K., Zou P., Bekki G., Alter H., and Liu H.-K.. (2017b). Autonomous combinatorial color barcoding for multiplexing single molecule RNA visualization. bioRxiv doi:10.1101/127373 (Preprint posted April 17, 2017). 10.1101/127373 [DOI]
- Cheng, X., Haeberle S., Shytaj I.L., Gama-Brambila R.A., Theobald J., Ghafoory S., Wölker J., Basu U., Schmidt C., Timm A., et al. 2020. NHC-gold compounds mediate immune suppression through induction of AHR-TGFβ1 signalling in vitro and in scurfy mice. Commun. Biol. 3:10. 10.1038/s42003-019-0716-8 [DOI] [PMC free article] [PubMed] [Google Scholar]
- Chowdhury, R., Leung I.K.H., Tian Y.-M., Abboud M.I., Ge W., Domene C., Cantrelle F.-X., Landrieu I., Hardy A.P., Pugh C.W., et al. 2016. Structural basis for oxygen degradation domain selectivity of the HIF prolyl hydroxylases. Nat. Commun. 7:12673. 10.1038/ncomms12673 [DOI] [PMC free article] [PubMed] [Google Scholar]
- Colak, S., and Ten Dijke P.. 2017. Targeting TGF-β signaling in cancer. Trends Cancer. 3:56–71. 10.1016/j.trecan.2016.11.008 [DOI] [PubMed] [Google Scholar]
- Cummins, E.P., Berra E., Comerford K.M., Ginouves A., Fitzgerald K.T., Seeballuck F., Godson C., Nielsen J.E., Moynagh P., Pouyssegur J., and Taylor C.T.. 2006. Prolyl hydroxylase-1 negatively regulates IkappaB kinase-beta, giving insight into hypoxia-induced NFkappaB activity. Proc. Natl. Acad. Sci. USA. 103:18154–18159. 10.1073/pnas.0602235103 [DOI] [PMC free article] [PubMed] [Google Scholar]
- Dabiri, Y., Gama-Brambila R.A., Taškova K., Herold K., Reuter S., Adjaye J., Utikal J., Mrowka R., Wang J., Andrade-Navarro M.A., and Cheng X.. 2019. Imidazopyridines as Potent KDM5 Demethylase Inhibitors Promoting Reprogramming Efficiency of Human iPSCs. iScience. 12:168–181. 10.1016/j.isci.2019.01.012 [DOI] [PMC free article] [PubMed] [Google Scholar]
- Dai, M., Al-Odaini A.A., Arakelian A., Rabbani S.A., Ali S., and Lebrun J.-J.. 2012. A novel function for p21Cip1 and acetyltransferase p/CAF as critical transcriptional regulators of TGFβ-mediated breast cancer cell migration and invasion. Breast Cancer Res. 14:R127. 10.1186/bcr3322 [DOI] [PMC free article] [PubMed] [Google Scholar]
- David, C.J., and Massagué J.. 2018. Contextual determinants of TGFβ action in development, immunity and cancer. Nat. Rev. Mol. Cell Biol. 19:419–435. 10.1038/s41580-018-0007-0 [DOI] [PMC free article] [PubMed] [Google Scholar]
- Di, K., Wong Y.C., and Wang X.. 2007. Id-1 promotes TGF-beta1-induced cell motility through HSP27 activation and disassembly of adherens junction in prostate epithelial cells. Exp. Cell Res. 313:3983–3999. 10.1016/j.yexcr.2007.08.023 [DOI] [PubMed] [Google Scholar]
- Dupont, S., Mamidi A., Cordenonsi M., Montagner M., Zacchigna L., Adorno M., Martello G., Stinchfield M.J., Soligo S., Morsut L., et al. 2009. FAM/USP9x, a deubiquitinating enzyme essential for TGFbeta signaling, controls Smad4 monoubiquitination. Cell. 136:123–135. 10.1016/j.cell.2008.10.051 [DOI] [PubMed] [Google Scholar]
- Elbediwy, A., and Thompson B.J.. 2018. Evolution of mechanotransduction via YAP/TAZ in animal epithelia. Curr. Opin. Cell Biol. 51:117–123. 10.1016/j.ceb.2018.02.003 [DOI] [PubMed] [Google Scholar]
- Falanga, V., Qian S.W., Danielpour D., Katz M.H., Roberts A.B., and Sporn M.B.. 1991. Hypoxia upregulates the synthesis of TGF-β 1 by human dermal fibroblasts. J. Invest. Dermatol. 97:634–637. 10.1111/1523-1747.ep12483126 [DOI] [PubMed] [Google Scholar]
- Fong, G.-H., and Takeda K.. 2008. Role and regulation of prolyl hydroxylase domain proteins. Cell Death Differ. 15:635–641. 10.1038/cdd.2008.10 [DOI] [PubMed] [Google Scholar]
- Funk, M.C., Zhou J., and Boutros M.. 2020. Ageing, metabolism and the intestine. EMBO Rep. 21:e50047. 10.15252/embr.202050047 [DOI] [PMC free article] [PubMed] [Google Scholar]
- Gama-Brambila, R.A., Chen J., Dabiri Y., Tascher G., Němec V., Münch C., Song G., Knapp S., and Cheng X.. 2021a. A Chemical Toolbox for Labeling and Degrading Engineered Cas Proteins. JCS Au. 1:777–785. [DOI] [PMC free article] [PubMed] [Google Scholar]
- Gama-Brambila, R.A., Chen J., Zhou J., Tascher G., Münch C., and Cheng X.. 2021b. A PROTAC targets splicing factor 3B1. Cell Chem. Biol. 10.1016/j.chembiol.2021.04.018 [DOI] [PubMed] [Google Scholar]
- Gao, S., Alarcón C., Sapkota G., Rahman S., Chen P.-Y., Goerner N., Macias M.J., Erdjument-Bromage H., Tempst P., and Massagué J.. 2009. Ubiquitin ligase Nedd4L targets activated Smad2/3 to limit TGF-beta signaling. Mol. Cell. 36:457–468. 10.1016/j.molcel.2009.09.043 [DOI] [PMC free article] [PubMed] [Google Scholar]
- Gavilan, H.S., Kulikauskas R.M., Gutmann D.H., and Fehon R.G.. 2014. In vivo functional analysis of the human NF2 tumor suppressor gene in Drosophila. PLoS One. 9:e90853. 10.1371/journal.pone.0090853 [DOI] [PMC free article] [PubMed] [Google Scholar]
- Ghafoory, S., Varshney R., Robison T., Kouzbari K., Woolington S., Murphy B., Xia L., and Ahamed J.. 2018. Platelet TGF-β1 deficiency decreases liver fibrosis in a mouse model of liver injury. Blood Adv. 2:470–480. 10.1182/bloodadvances.2017010868 [DOI] [PMC free article] [PubMed] [Google Scholar]
- Hevia, C.F., and de Celis J.F.. 2013. Activation and function of TGFβ signalling during Drosophila wing development and its interactions with the BMP pathway. Dev. Biol. 377:138–153. 10.1016/j.ydbio.2013.02.004 [DOI] [PubMed] [Google Scholar]
- Hevia, C.F., López-Varea A., Esteban N., and de Celis J.F.. 2017. A Search for Genes Mediating the Growth-Promoting Function of TGFβ in the Drosophila melanogaster Wing Disc. Genetics. 206:231–249. 10.1534/genetics.116.197228 [DOI] [PMC free article] [PubMed] [Google Scholar]
- Hon, W.-C., Wilson M.I., Harlos K., Claridge T.D.W., Schofield C.J., Pugh C.W., Maxwell P.H., Ratcliffe P.J., Stuart D.I., and Jones E.Y.. 2002. Structural basis for the recognition of hydroxyproline in HIF-1 alpha by pVHL. Nature. 417:975–978. 10.1038/nature00767 [DOI] [PubMed] [Google Scholar]
- Hsouna, A., Nallamothu G., Kose N., Guinea M., Dammai V., and Hsu T.. 2010. Drosophila von Hippel-Lindau tumor suppressor gene function in epithelial tubule morphogenesis. Mol. Cell. Biol. 30:3779–3794. 10.1128/MCB.01578-09 [DOI] [PMC free article] [PubMed] [Google Scholar]
- Hua, W., Ten Dijke P., Kostidis S., Giera M., and Hornsveld M.. 2020. TGFβ-induced metabolic reprogramming during epithelial-to-mesenchymal transition in cancer. Cell. Mol. Life Sci. 77:2103–2123. 10.1007/s00018-019-03398-6 [DOI] [PMC free article] [PubMed] [Google Scholar]
- Ivan, M., Kondo K., Yang H., Kim W., Valiando J., Ohh M., Salic A., Asara J.M., Lane W.S., and Kaelin W.G. Jr. 2001. HIFalpha targeted for VHL-mediated destruction by proline hydroxylation: implications for O2 sensing. Science. 292:464–468. 10.1126/science.1059817 [DOI] [PubMed] [Google Scholar]
- Kim, S.Y., Miller E.J., Frydman J., and Moerner W.E.. 2010. Action of the chaperonin GroEL/ES on a non-native substrate observed with single-molecule FRET. J. Mol. Biol. 401:553–563. 10.1016/j.jmb.2010.06.050 [DOI] [PMC free article] [PubMed] [Google Scholar]
- Knauth, K., Bex C., Jemth P., and Buchberger A.. 2006. Renal cell carcinoma risk in type 2 von Hippel-Lindau disease correlates with defects in pVHL stability and HIF-1α interactions. Oncogene. 25:370–377. 10.1038/sj.onc.1209062 [DOI] [PubMed] [Google Scholar]
- Kurban, G., Hudon V., Duplan E., Ohh M., and Pause A.. 2006. Characterization of a von Hippel Lindau pathway involved in extracellular matrix remodeling, cell invasion, and angiogenesis. Cancer Res. 66:1313–1319. 10.1158/0008-5472.CAN-05-2560 [DOI] [PubMed] [Google Scholar]
- LaJeunesse, D.R., McCartney B.M., and Fehon R.G.. 1998. Structural analysis of Drosophila merlin reveals functional domains important for growth control and subcellular localization. J. Cell Biol. 141:1589–1599. 10.1083/jcb.141.7.1589 [DOI] [PMC free article] [PubMed] [Google Scholar]
- Leonardi, E., Murgia A., and Tosatto S.C.E.. 2009. Adding structural information to the von Hippel-Lindau (VHL) tumor suppressor interaction network. FEBS Lett. 583:3704–3710. 10.1016/j.febslet.2009.10.070 [DOI] [PubMed] [Google Scholar]
- Li, L., Zhang L., Zhang X., Yan Q., Minamishima Y.A., Olumi A.F., Mao M., Bartz S., and Kaelin W.G. Jr. 2007. Hypoxia-inducible factor linked to differential kidney cancer risk seen with type 2A and type 2B VHL mutations. Mol. Cell. Biol. 27:5381–5392. 10.1128/MCB.00282-07 [DOI] [PMC free article] [PubMed] [Google Scholar]
- Liang, Y.-Y., Brunicardi F.C., and Lin X.. 2009. Smad3 mediates immediate early induction of Id1 by TGF-beta. Cell Res. 19:140–148. 10.1038/cr.2008.321 [DOI] [PubMed] [Google Scholar]
- Luo, K. 2017. Signaling Cross Talk between TGF-β/Smad and Other Signaling Pathways. Cold Spring Harb. Perspect. Biol. 9:a022137. 10.1101/cshperspect.a022137 [DOI] [PMC free article] [PubMed] [Google Scholar]
- Mallikarjuna, P., Sitaram R.T., Landström M., and Ljungberg B.. 2018. VHL status regulates transforming growth factor-β signaling pathways in renal cell carcinoma. Oncotarget. 9:16297–16310. 10.18632/oncotarget.24631 [DOI] [PMC free article] [PubMed] [Google Scholar]
- Meyer, C., Godoy P., Bachmann A., Liu Y., Barzan D., Ilkavets I., Maier P., Herskind C., Hengstler J.G., and Dooley S.. 2011. Distinct role of endocytosis for Smad and non-Smad TGF-β signaling regulation in hepatocytes. J. Hepatol. 55:369–378. 10.1016/j.jhep.2010.11.027 [DOI] [PubMed] [Google Scholar]
- Miettinen, P.J., Ebner R., Lopez A.R., and Derynck R.. 1994. TGF-beta induced transdifferentiation of mammary epithelial cells to mesenchymal cells: involvement of type I receptors. J. Cell Biol. 127:2021–2036. 10.1083/jcb.127.6.2021 [DOI] [PMC free article] [PubMed] [Google Scholar]
- Min, J.-H., Yang H., Ivan M., Gertler F., Kaelin W.G. Jr., and Pavletich N.P.. 2002. Structure of an HIF-1α -pVHL complex: hydroxyproline recognition in signaling. Science. 296:1886–1889. 10.1126/science.1073440 [DOI] [PubMed] [Google Scholar]
- Miyazono, K.-I., Moriwaki S., Ito T., Kurisaki A., Asashima M., and Tanokura M.. 2018. Hydrophobic patches on SMAD2 and SMAD3 determine selective binding to cofactors. Sci. Signal. 11:eaao7227. 10.1126/scisignal.aao7227 [DOI] [PubMed] [Google Scholar]
- Moore, L.D., Isayeva T., Siegal G.P., and Ponnazhagan S.. 2008. Silencing of transforming growth factor-beta1 in situ by RNA interference for breast cancer: implications for proliferation and migration in vitro and metastasis in vivo. Clin. Cancer Res. 14:4961–4970. 10.1158/1078-0432.CCR-07-4604 [DOI] [PubMed] [Google Scholar]
- Morén, A., Hellman U., Inada Y., Imamura T., Heldin C.-H., and Moustakas A.. 2003. Differential ubiquitination defines the functional status of the tumor suppressor Smad4. J. Biol. Chem. 278:33571–33582. 10.1074/jbc.M300159200 [DOI] [PubMed] [Google Scholar]
- Moustakas, A., and Heldin C.-H.. 2009. The regulation of TGFbeta signal transduction. Development. 136:3699–3714. 10.1242/dev.030338 [DOI] [PubMed] [Google Scholar]
- Peterson, A.J., and O’Connor M.B.. 2013. Activin receptor inhibition by Smad2 regulates Drosophila wing disc patterning through BMP-response elements. Development. 140:649–659. 10.1242/dev.085605 [DOI] [PMC free article] [PubMed] [Google Scholar]
- Peterson, A.J., and O’Connor M.B.. 2014. Strategies for exploring TGF-β signaling in Drosophila. Methods. 68:183–193. 10.1016/j.ymeth.2014.03.016 [DOI] [PMC free article] [PubMed] [Google Scholar]
- Peth, A., Nathan J.A., and Goldberg A.L.. 2013. The ATP costs and time required to degrade ubiquitinated proteins by the 26 S proteasome. J. Biol. Chem. 288:29215–29222. 10.1074/jbc.M113.482570 [DOI] [PMC free article] [PubMed] [Google Scholar]
- Pires-daSilva, A., and Sommer R.J.. 2003. The evolution of signalling pathways in animal development. Nat. Rev. Genet. 4:39–49. 10.1038/nrg977 [DOI] [PubMed] [Google Scholar]
- Prunier, C., Baker D., Ten Dijke P., and Ritsma L.. 2019. TGF-β Family Signaling Pathways in Cellular Dormancy. Trends Cancer. 5:66–78. 10.1016/j.trecan.2018.10.010 [DOI] [PubMed] [Google Scholar]
- Qin, B.Y., Lam S.S., Correia J.J., and Lin K.. 2002. Smad3 allostery links TGF-beta receptor kinase activation to transcriptional control. Genes Dev. 16:1950–1963. 10.1101/gad.1002002 [DOI] [PMC free article] [PubMed] [Google Scholar]
- Semenza, G.L. 2004. Hydroxylation of HIF-1: oxygen sensing at the molecular level. Physiology (Bethesda). 19:176–182. 10.1152/physiol.00001.2004 [DOI] [PubMed] [Google Scholar]
- Shi, Y. 2006. Structural Insights into Smad Function and Specificity. In Smad Signal Transduction: Smads in Proliferation, Differentiation and Disease. ten Dijke P. and Heldin C.-H., editors. Springer Netherlands, Dordrecht. 215–233. 10.1007/1-4020-4709-6_11 [DOI] [Google Scholar]
- Tang, X., Li G., Su F., Cai Y., Shi L., Meng Y., Liu Z., Sun J., Wang M., Qian M., et al. 2020. HDAC8 cooperates with SMAD3/4 complex to suppress SIRT7 and promote cell survival and migration. Nucleic Acids Res. 48:2912–2923. 10.1093/nar/gkaa039 [DOI] [PMC free article] [PubMed] [Google Scholar]
- Tarade, D., and Ohh M.. 2018. The HIF and other quandaries in VHL disease. Oncogene. 37:139–147. 10.1038/onc.2017.338 [DOI] [PubMed] [Google Scholar]
- Wang, J., and Dahmann C.. 2020. Establishing compartment boundaries in Drosophila wing imaginal discs: An interplay between selector genes, signaling pathways and cell mechanics. Semin. Cell Dev. Biol. 107:161–169. 10.1016/j.semcdb.2020.07.008 [DOI] [PubMed] [Google Scholar]
- Xu, J., Lamouille S., and Derynck R.. 2009. TGF-β-induced epithelial to mesenchymal transition. Cell Res. 19:156–172. 10.1038/cr.2009.5 [DOI] [PMC free article] [PubMed] [Google Scholar]
- Yu, Y., and Feng X.-H.. 2019. TGF-β signaling in cell fate control and cancer. Curr. Opin. Cell Biol. 61:56–63. 10.1016/j.ceb.2019.07.007 [DOI] [PubMed] [Google Scholar]
- Zhang, Y., Chang C., Gehling D.J., Hemmati-Brivanlou A., and Derynck R.. 2001. Regulation of Smad degradation and activity by Smurf2, an E3 ubiquitin ligase. Proc. Natl. Acad. Sci. USA. 98:974–979. 10.1073/pnas.98.3.974 [DOI] [PMC free article] [PubMed] [Google Scholar]
- Zhang, Y., Alexander P.B., and Wang X.-F.. 2017. TGF-β Family Signaling in the Control of Cell Proliferation and Survival. Cold Spring Harb. Perspect. Biol. 9:a022145. 10.1101/cshperspect.a022145 [DOI] [PMC free article] [PubMed] [Google Scholar]
- Zhang, J., Wu T., Simon J., Takada M., Saito R., Fan C., Liu X.-D., Jonasch E., Xie L., Chen X., et al. 2018. VHL substrate transcription factor ZHX2 as an oncogenic driver in clear cell renal cell carcinoma. Science. 361:290–295. 10.1126/science.aap8411 [DOI] [PMC free article] [PubMed] [Google Scholar]
- Zheng, N., and Shabek N.. 2017. Ubiquitin Ligases: Structure, Function, and Regulation. Annu. Rev. Biochem. 86:129–157. 10.1146/annurev-biochem-060815-014922 [DOI] [PubMed] [Google Scholar]
- Zhou, J., and Boutros M.. 2020. JNK-dependent intestinal barrier failure disrupts host-microbe homeostasis during tumorigenesis. Proc. Natl. Acad. Sci. USA. 117:9401–9412. 10.1073/pnas.1913976117 [DOI] [PMC free article] [PubMed] [Google Scholar]
Associated Data
This section collects any data citations, data availability statements, or supplementary materials included in this article.
Supplementary Materials
lists antibodies used in this study.
lists siRNAs reagents used in this study.
lists chemical reagents used in this study.
provides information about the proteomics data generated in this study.
contains original blots for Fig. 1.
contains original blots for Fig. 2.
contains original blots for Fig. 3.
contains original blots for Fig. S1.
contains original blots for Fig. S2.
contains original blots for Fig. S3.
Data Availability Statement
The proteomics data generated in this study are available in Data S1.