Abstract
Objective:
To describe a newly developed three-dimensional (3D) digital superimposition method for quantitative evaluation of tooth wear that occurs during orthodontic treatment.
Materials and Methods:
The sample consisted of dental casts obtained from 56 patients (23 male patients and 33 female patients; mean ± standard deviation age = 21.8 ± 5.1 years) who received orthodontic treatment with extraction of four premolars. The maxillary and mandibular dental casts taken before (T1) and after (T2) orthodontic treatments were scanned, and 3D images of the canines were constructed. The canines at T1 were superimposed with those at T2 with the best-fit method using the middle third of the labial and lingual surface as the reference area. To measure the volume of the canines, four boundary planes were constructed, and the differences in volume before and after orthodontic treatment were calculated.
Results:
The mean volume of tooth wear of the 224 canines was 2.0 mm3 after 35.5 months of orthodontic treatment. The volume of canine tooth wear was 2.3 ± 1.5 mm3 in male subjects and 1.9 ± 1.2 mm3 in female subjects. The mean wear of the upper right canines (2.4 ± 2.0 mm3) was significantly greater than that of the lower right canines (1.9 ± 2.6 mm3).
Conclusions:
Regional registration of teeth in 3D digital models is useful for quantitative evaluation of tooth wear in orthodontic patients. This method may also be used to assess treatment results in restorative dentistry.
Keywords: Tooth wear, Volume, Three-dimensional, Superimposition, Orthodontic treatment
INTRODUCTION
Tooth wear is defined as noncarious loss of tooth substance as a result of attrition, abrasion, and erosion.1 With regard to the prevalence and etiologic factors of tooth wear, many authors have studied its associations with age,2–4 gender,2,5–9 bite force,10 bruxism,4,9 craniofacial morphology,10,11 mouth breathing,12 and malocclusion.3,8,9,13 Tooth wear may occur during orthodontic treatment due to the change in occlusion, abrasion by orthodontic appliances, and other factors. A few studies have investigated the tooth wear occurring during the posttreatment period.4,14 So far, there has been no quantitative report on the tooth wear that occurs during orthodontic treatment.
This lack of research is due to methodologic difficulties in quantifying the volumetric change of the tooth material. Many researchers have used various tooth wear indexes (TWIs) on plaster models to assess tooth wear.5,6,9,15–18 TWIs could evaluate the prevalence of tooth wear, but they have limitations in standardization, reliability, and quantification.19,20 In addition, TWIs are unable to identify the progression of minor wear during orthodontic treatment. In 1997, Pintado et al.21 measured volume loss and mean depth loss in tooth wear using a point contact stylus and computer software. In 2010, Al-Omiri et al.19 used laser-scanned images to detect incisal tooth wear. But there is no doubt that these techniques can only be used for research purposes. In conclusion, no study has tried to measure the amount of tooth wear in clinical orthodontics.
Three-dimensional (3D) reverse-engineering techniques are widely used in dentistry as CAD-CAM (computer-aided design/compter-aided manufacturing) technology. Digital data have a number of advantages in terms of storage, retrieval, and diagnostic versatility. In orthodontics, 3D digital facial models and 3D dental models are now clinically used for making a diagnosis, planning treatment, and evaluating treatment results.22,23 Various systems for fabricating customized orthodontic appliances using 3D techniques, such as Invisalign, Orthocaps, and SureSmile, are now commercially used.24 Cha et al.25 and Park et al.26 suggested the possibility of measuring the volumetric amount of tooth wear in orthodontic patients by superimposing 3D digital models. The purpose of this preliminary report is to describe a newly developed 3D digital superimposing method for quantitatively evaluating tooth wear that occurred during orthodontic treatment.
MATERIALS AND METHODS
The sample consisted of dental casts obtained from 56 patients (23 male patients and 33 female patients; mean ± standard deviation age = 21.8 ± 5.1 years) who received orthodontic treatment with extraction of four premolars at the Department of Orthodontics of Gangneung-Wonju National University Dental Hospital. The inclusion criteria were complete permanent dentition, ANB angle between 0° and 4°, normal vertical pattern, absence of anterior crossbite, no restorations on the anterior teeth, and no occlusal adjustments during orthodontic treatment (Table 1). The protocol for this study was approved by the Ethics Committee of the institute (IRB 2010-1-6).
Table 1.
Descriptive Statistics (Mean ± Standard Deviation) for Age, Treatment Duration, and Cephalometric Characteristics
The maxillary and mandibular dental casts, which were taken before (T1) and after (T2) orthodontic treatment with alginate (Aroma Fine Plus, GC Co, Tokyo, Japan) and hard stone (New Plastone II White, GC Co, Tokyo, Japan) were scanned using a laser surface scanning system (KOD300, accuracy 50 µm, Orapix Co, Ltd, Seoul, Korea) with a point spacing of 0.15 mm. The 3D virtual models were reconstructed and imported to 3D reverse-modeling software (Rapidform XOR3, INUS Technology, Seoul, Korea). In total, 224 pairs of canines (T1 and T2) were extracted from the digital models of 56 patients (Figure 1).
Figure 1.
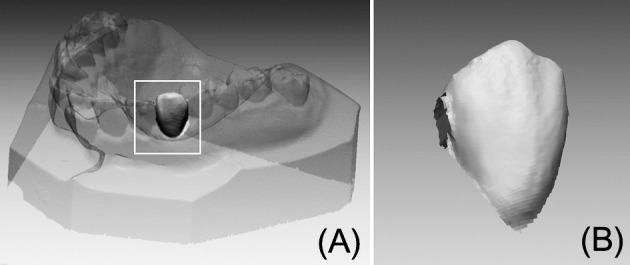
Process of constructing a single-tooth three-dimensional (3D) digital model. (A) Reconstructed 3D digital maxillary model. (B) Extracted 3D digital maxillary canine.
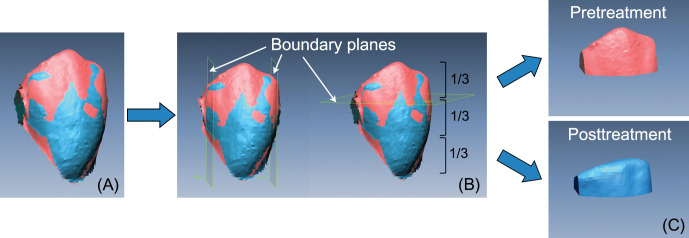
To evaluate tooth wear, the 3D images of the canines at T1 and T2 were superimposed using the best-fit method. The middle thirds of the labial and lingual surfaces of each canine, considered to be rarely affected by attritional wear and gingival condition, were used as reference areas for superimposition (Figure 2). To calculate the volume, the 3D canine model should not be a hollow shell image but a solid model. Therefore, the following four boundary planes were constructed on the T1 canine (using the boundary planes and superimposition method) (Figure 3). The mesial and distal planes were created parallel to the long axis of the canine and 1.5 mm from the mesial and distal contact points. The lingual plane was constructed perpendicular to the mesial and distal planes with the same vector as used for the long axis of the canine. The gingival plane was perpendicular to the mesial, distal, and lingual planes and cut off the incisal third of the canine. The volumetric differences of T1 and T2 canines were calculated.
Figure 2.
Superimposition process of pretreatment (red) and posttreatment (blue) model. (A) Pretreatment canine model. (B) Posttreatment canine model. (C) Superimposition with the best-fit method using the middle third of the labial and lingual surfaces as reference areas.
Figure 3.
Process for quantifying the volume of tooth wear. (A) Superimposed pretreatment (red) and posttreatment (blue) canine model. (B) Mesial, distal, and gingival boundary planes for creating a solid model. (C) A solid three-dimensional geometry surrounded by the boundary planes. Volume of tooth wear was calculated from the difference between the pretreatment and posttreatment models.
To evaluate the method error, 10 canines were randomly selected, and superimposition and volume calculations were repeated at one-week intervals by the same investigator. Testing for the method error was performed with Dahlberg's formula (method error =  , where d is the difference between two measurements of a pair, and n is the number of subjects). The method error of the measurements was found to be 0.2 mm3.
Statistical Analysis
Because the data were not normally distributed, nonparametric analysis was used. A Mann-Whitney U-test was performed to test the differences between male and female patients. Wilcoxon signed rank test was used to test for differences between upper and lower canines and right and left canines. Spearman correlation analysis was used to assess the correlation between the variables.
RESULTS
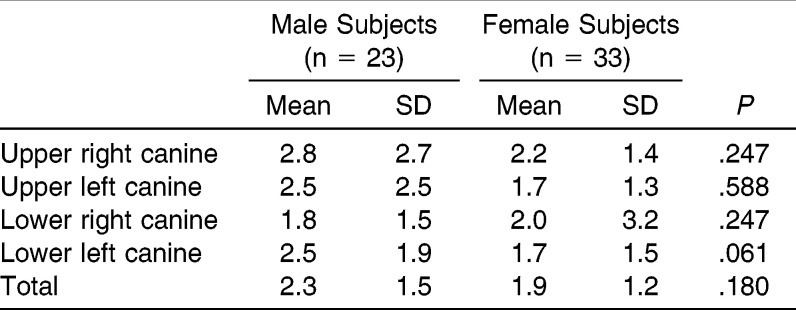
The mean duration of orthodontic treatment, that is, the interval between the impressions taken at T1 and T2, was 35.5 months. The mean (± standard deviation) volumetric difference between T1 and T2 canines was 2.0 ± 1.3 mm3. Three of 224 canines increased in volume after orthodontic treatment, although the differences were negligible. Tooth wear was 2.3 ± 1.5 mm3 in male subjects and 1.9 ± 1.2 mm3 in female subjects. However, those differences did not reach statistical significance (Table 2).
Table 2.
Mann-Whitney U-Test for Comparing Tooth Wear (mm3) Between Male and Female Subjects
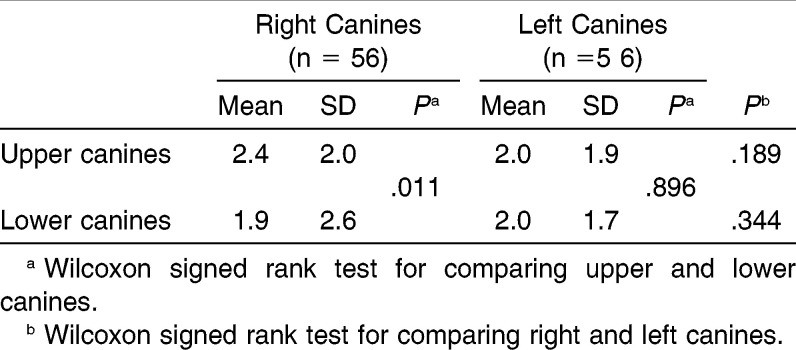
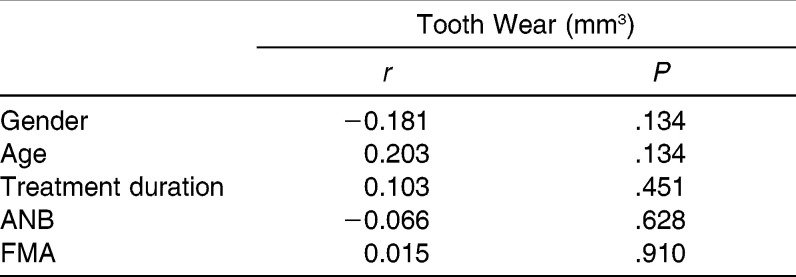
The average tooth wear of the four canines was as follows: 2.4 ± 2.0 mm3 at the upper right canine, 2.0 ± 1.9 mm3 at the upper left canine, 1.9 ± 2.6 mm3 at the lower right canine, and 2.0 ± 1.7 mm3 at the lower left canine. According to Wilcoxon signed rank test, the upper right canine showed greater tooth wear than the lower right canine (Table 3). The Spearman correlation analyses revealed no significant correlations between tooth wear and gender, age, treatment duration, or craniofacial morphology (Table 4).
Table 3.
Wilcoxon Signed Rank Test for Comparing Tooth Wear (mm3) Between Upper and Lower Canines and Between Right and Left Canines
Table 4.
Spearman Correlation Analysis for Assessing the Correlation Between the Variables
DISCUSSION
Many of the TWIs that have been developed to assess tooth wear5,6,9,15–18 are simple to use but cause a variety of problems with respect to the standardization and reliability of the quantification.19,20 In fact, most TWIs are not capable of measuring minor losses of enamel. Therefore, despite their applicability for the some epidemiologic studies, TWIs are not suitable for measuring a tiny amount of tooth wear during orthodontic treatment or short-term follow-up. Actually, quantitative measurement of tooth wear is difficult and even impossible until now. There have been some trials to measure wear of composite filling using a 3D optical scanner27 or to detect wear progression using a toolmaker microscope.19 However, such methods need to be critically reviewed from the viewpoint of clinical applicability.
In orthodontics, 3D digital models, the SureSmile system, iBraces, Invisalign, and similar systems use digital 3D data acquisition. However, these techniques have not yet been used for measuring tooth size longitudinally. Our previous publications described the 3D digital model superimposition method using the palatal surface as a reference area for assessing orthodontic tooth movement.22,28,29 As feasibility studies for the quantification of the tooth wear, Cha et al.25 and Park et al.26 proposed a novel method superimposing in 3D using the middle third of the labial and lingual surface as a reference area. Such a trial methodology was derived from the idea that the amount of tooth wear might be calculated after regional registration (best-fit method) of the two individual teeth at a distinct distance of the time, for example, before and after treatment, with the possible stable reference area of the individual tooth.
As the method error in the present study (0.2 mm3) shows, this happens to be a sufficiently reliable and reproducible technique. Generally, the accuracy of regional registration improves with higher scanning resolutions. In this preliminary study, the canines were scanned with a point spacing of 0.15 mm. In future studies, the scanning accuracy should be further changed, according to required accuracy of the different teeth (premolar or molar).
Our experience showed that using both labial and lingual surfaces as reference areas yields a more accurate superimposition than using only one side. The molars commonly have restorations or sealants, and the lower incisors have no cusps or sufficient shape characteristics for registration. Therefore, in this preliminary study, we evaluated only upper and lower canines, as these teeth have a characteristic morphology and are known to show more severe tooth wear than the other teeth.30 However, further studies into the effect of modifications in the superimposition method may need to be investigated for different shapes of teeth, such as molars and incisors.
Actually, three of 224 canines increased in volume during orthodontic treatment, although the differences were negligible. Such false results might be explained by the limited accuracy of the alginate impression material and white stone used in this retrospective study. Alginate shrinkage or variable setting expansion of dental stone are likely explanations for the differences. Another possible cause of this false result is remnants of resin after removal of the fixed appliances or unintentional removal of enamel. In the study by Ryf et al.,31 the mean volume of the resin remnant was 2.48 mm3 and mean enamel loss after polishing was 0.05 mm3. In a future prospective study, such possible bias deserves careful attention. To evaluate the accuracy and validity of the method, the whole process, including impressions, plaster casts, 3D scanning, regional registration, and volume calculation, should be repeated in an ex vivo study and compared with the loss measured, for example, with micro-computed tomography. In this preliminary and retrospective study, however, we could not repeat the whole process, such as impression taking for the pre- or posttreatment record, and this is a drawback of this study. However, as the systematic errors are likely same at T1 and T2, the differences found between the two are valuable information.
The number of teeth with occlusal wear increases with age,2,3 and tooth wear in adulthood is related to that of childhood.4 In addition, there are high correlations between tooth wear, maximal bite force,10 sexual difference,2,5,7–9 and craniofacial morphology, characterized by ANB angle, ramal height, and gonial angle.10,11 In the present study, only adult subjects with skeletal Class I and normal vertical pattern were included. Therefore, it came as no surprise that ANB and FMA had no significant impact.
The mean amount of tooth wear in the canines was 2.0 ± 1.3 mm3 during orthodontic treatment for 35.5 ± 8.3 months. It is very difficult to compare our results with those of other studies because no other investigation has measured the volume of tooth wear during orthodontic treatment. Pintado et al.21 investigated the enamel loss in 18 young adults (dental students between 22 and 30 years old) for two years using a profiling system on epoxy replicas of the teeth. Their results showed that the mean volume loss for canine was 0.173 mm3 for two years. Therefore, our results may suggest that the mean canine wear in orthodontic patients is larger than that in subjects not undergoing orthodontic treatment. But as this preliminary study lacks a control group, this remains to be proven in further studies by including control subjects who do not receive orthodontic treatment in a well-controlled randomized clinical trial or a prospective case/control study.
In general, males show stronger masseter muscles and have greater bite forces than females. Many previous studies have reported that males had significantly greater attrition than females.2,5,7–9 In the present study, however, there was no statistically significant difference, although the mean tooth wear of male subjects (2.3 ± 1.5 mm3) was greater than that of female subjects (1.9 ± 1.2 mm3) (Table 2). There were no statistically significant differences between the right and left canines (Table 3). This is in accordance with the findings of Silness et al.,18 who reported that wear of identical teeth on the right and left side tended to be bilaterally symmetrical in both jaws. It appears reasonable to assume that the functional displacement of the mandible that is usually observed during active orthodontic treatment does not play an important role in the development of asymmetrical tooth wear. According to Janson et al.,13 the wear score between the upper canines and lower canines in a group with clinically normal occlusion did not show differences. However, the present study showed greater wear on the upper canine compared with lower canine on the right side, but no difference on the left side. This asymmetrical wear pattern in the four quadrants could not be interpreted in this limited study.
To our knowledge, this is the first study performed to calculate tooth wear volumetrically using 3D reverse-engineering technology. But in this preliminary study, we have focused on the introduction of the new technical procedure to measure tooth wear using 3D tooth superimposition methods. The laboratory procedure that involved the protocols providing the validity of this method remain to be investigated. In future prospective research, more refined samples may be needed to clarify the association between tooth wear and skeletal pattern, treatment duration, gender, age, and location of the tooth.
The methodology presented in this study may also be used in restorative dentistry. It is possible that in the near future volumetric changes can be measured quantitatively using this 3D registration technology and an intraoral scanner. For these clinical applications, additional automatic 3D landmark extraction algorithms need to be developed.
CONCLUSIONS
This study investigated the possibility of regional registration of the teeth in 3D digital models for the quantitative evaluation of tooth wear in orthodontic patients. The general overview on this technique using the boundary planes and superimposition method was presented.
On average, the canines had lost 2.0 mm3 during 35.5 months of orthodontic treatment. The mean wear of the upper right canine (2.4 mm3) was significantly greater than that of the lower right canine (1.9 mm3).
The methodology described in the present study may also be used for the evaluation of tooth wear in restorative dentistry.
ACKNOWLEDGMENTS
The boundary planes and superimposition method for evaluating tooth wear is preceding Korean patent (10-2011-0049262).
REFERENCES
- 1.Eccles JD. Tooth surface loss from abrasion, attrition and erosion. Dent Update. 1982;9:373–374, 376–378, 380–371. [PubMed] [Google Scholar]
- 2.Hugoson A, Bergendal T, Ekfeldt A, Helkimo M. Prevalence and severity of incisal and occlusal tooth wear in an adult Swedish population. Acta Odontol Scand. 1988;46:255–265. doi: 10.3109/00016358809004775. [DOI] [PubMed] [Google Scholar]
- 3.Silness J, Johannessen G, Roynstrand T. Longitudinal relationship between incisal occlusion and incisal tooth wear. Acta Odontol Scand. 1993;51:15–21. doi: 10.3109/00016359309041143. [DOI] [PubMed] [Google Scholar]
- 4.Knight DJ, Leroux BG, Zhu C, Almond J, Ramsay DS. A longitudinal study of tooth wear in orthodontically treated patients. Am J Orthod Dentofacial Orthop. 1997;112:194–202. doi: 10.1016/s0889-5406(97)70246-4. [DOI] [PubMed] [Google Scholar]
- 5.Fares J, Shirodaria S, Chiu K, Ahmad N, Sherriff M, Bartlett D. A new index of tooth wear. Reproducibility and application to a sample of 18- to 30-year-old university students. Caries Res. 2009;43:119–125. doi: 10.1159/000209344. [DOI] [PubMed] [Google Scholar]
- 6.Hugoson A, Ekfeldt A, Koch G, Hallonsten AL. Incisal and occlusal tooth wear in children and adolescents in a Swedish population. Acta Odontol Scand. 1996;54:263–270. doi: 10.3109/00016359609003535. [DOI] [PubMed] [Google Scholar]
- 7.Mwangi CW, Richmond S, Hunter ML. Relationship between malocclusion, orthodontic treatment, and tooth wear. Am J Orthod Dentofacial Orthop. 2009;136:529–535. doi: 10.1016/j.ajodo.2007.11.030. [DOI] [PubMed] [Google Scholar]
- 8.Seligman DA, Pullinger AG, Solberg WK. The prevalence of dental attrition and its association with factors of age, gender, occlusion, and TMJ symptomatology. J Dent Res. 1988;67:1323–1333. doi: 10.1177/00220345880670101601. [DOI] [PubMed] [Google Scholar]
- 9.Bernhardt O, Gesch D, Splieth C, et al. Risk factors for high occlusal wear scores in a population-based sample: results of the Study of Health in Pomerania (SHIP) Int J Prosthodont. 2004;17:333–339. [PubMed] [Google Scholar]
- 10.Kiliaridis S, Johansson A, Haraldson T, Omar R, Carlsson GE. Craniofacial morphology, occlusal traits, and bite force in persons with advanced occlusal tooth wear. Am J Orthod Dentofacial Orthop. 1995;107:286–292. doi: 10.1016/s0889-5406(95)70144-3. [DOI] [PubMed] [Google Scholar]
- 11.Almond JR, Leroux BG, Knight DJ, Ramsay DS. Craniofacial morphology and tooth wear: a longitudinal study of orthodontic patients. Angle Orthod. 1999;69:7–13. doi: 10.1043/0003-3219(1999)069<0007:C>2.3.CO;2. [DOI] [PubMed] [Google Scholar]
- 12.Marinelli A, Alarashi M, Defraia E, Antonini A, Tollaro I. Tooth wear in the mixed dentition: a comparative study between children born in the 1950s and the 1990s. Angle Orthod. 2005;75:340–343. doi: 10.1043/0003-3219(2005)75[340:TWITMD]2.0.CO;2. [DOI] [PubMed] [Google Scholar]
- 13.Janson G, Oltramari-Navarro PV, de Oliveira RB, Quaglio CL, Sales-Peres SH, Tompson B. Tooth-wear patterns in subjects with Class II Division 1 malocclusion and normal occlusion. Am J Orthod Dentofacial Orthop. 2010;137:14. e1–e7; discussion 14–15. doi: 10.1016/j.ajodo.2009.08.022. [DOI] [PubMed] [Google Scholar]
- 14.Kuijpers MA, Kiliaridis S, Renkema A, Bronkhorst EM, Kuijpers-Jagtman AM. Anterior tooth wear and retention type until 5 years after orthodontic treatment. Acta Odontol Scand. 2009;67:176–181. doi: 10.1080/00016350902773390. [DOI] [PubMed] [Google Scholar]
- 15.Bartlett D. A proposed system for screening tooth wear. Br Dent J. 2010;208:207–209. doi: 10.1038/sj.bdj.2010.205. [DOI] [PubMed] [Google Scholar]
- 16.Donachie MA, Walls AW. The tooth wear index: a flawed epidemiological tool in an ageing population group. Community Dent Oral Epidemiol. 1996;24:152–158. doi: 10.1111/j.1600-0528.1996.tb00833.x. [DOI] [PubMed] [Google Scholar]
- 17.Smith BG, Knight JK. An index for measuring the wear of teeth. Br Dent J. 1984;156:435–438. doi: 10.1038/sj.bdj.4805394. [DOI] [PubMed] [Google Scholar]
- 18.Silness J, Berge M, Johannessen G. Prevalence, pattern, and severity of incisal wear in dental students. Acta Odontol Scand. 1994;52:178–181. doi: 10.3109/00016359409027593. [DOI] [PubMed] [Google Scholar]
- 19.Al-Omiri MK, Harb R, Abu Hammad OA, Lamey PJ, Lynch E, Clifford TJ. Quantification of tooth wear: conventional vs new method using toolmakers microscope and a three-dimensional measuring technique. J Dent. 2010;38:560–568. doi: 10.1016/j.jdent.2010.03.016. [DOI] [PubMed] [Google Scholar]
- 20.Lobbezoo F, Naeije M. A reliability study of clinical tooth wear measurements. J Prosthet Dent. 2001;86:597–602. doi: 10.1067/mpr.2001.118892. [DOI] [PubMed] [Google Scholar]
- 21.Pintado MR, Anderson GC, DeLong R, Douglas WH. Variation in tooth wear in young adults over a two-year period. J Prosthet Dent. 1997;77:313–320. doi: 10.1016/s0022-3913(97)70189-6. [DOI] [PubMed] [Google Scholar]
- 22.Cha BK, Lee JY, Jost-Brinkmann PG, Yoshida N. Analysis of tooth movement in extraction cases using three-dimensional reverse engineering technology. Eur J Orthod. 2007;29:325–331. doi: 10.1093/ejo/cjm019. [DOI] [PubMed] [Google Scholar]
- 23.Choi JI, Cha BK, Jost-Brinkmann PG, Choi DS, Jang IS. Validity of palatal superimposition of 3-dimensional digital models in cases treated with rapid maxillary expansion and maxillary protraction headgear. Korean J Orthod. 2012;42:235–241. doi: 10.4041/kjod.2012.42.5.235. [DOI] [PMC free article] [PubMed] [Google Scholar]
- 24.Muller-Hartwich R, Prager TM, Jost-Brinkmann PG. SureSmile-CAD/CAM system for orthodontic treatment planning, simulation and fabrication of customized archwires. Int J Comput Dent. 2007;10:53–62. [PubMed] [Google Scholar]
- 25.Cha BK, Choi JI, Jost-Brinkmann PG, Jeong YM. Applications of three-dimensionally scanned models in orthodontics. Int J Comput Dent. 2007;10:41–52. [PubMed] [Google Scholar]
- 26.Park J, An KY, Kwak YY, Jang I, Cha BK. 87th Congress of the European Orthodontic Society 19–23 June 2011 IstanbulTurkey Abstract Book. London, UK: European Orthodontic Society; 2011. A novel method for volumetric assessment of tooth wear using three-dimensional reverse engineering technology. [Google Scholar]
- 27.Mehl A, Gloger W, Kunzelmann KH, Hickel R. A new optical 3-D device for the detection of wear. J Dent Res. 1997;76:1799–1807. doi: 10.1177/00220345970760111201. [DOI] [PubMed] [Google Scholar]
- 28.Choi DS, Jeong YM, Jang I, Jost-Brinkmann PG, Cha BK. Accuracy and reliability of palatal superimposition of three-dimensional digital models. Angle Orthod. 2010;80:497–503. doi: 10.2319/101309-569.1. [DOI] [PMC free article] [PubMed] [Google Scholar]
- 29.Jang I, Tanaka M, Koga Y, et al. A novel method for the assessment of three-dimensional tooth movement during orthodontic treatment. Angle Orthod. 2009;79:447–453. doi: 10.2319/042308-225.1. [DOI] [PubMed] [Google Scholar]
- 30.Fareed K, Johansson A, Omar R. Prevalence and severity of occlusal tooth wear in a young Saudi population. Acta Odontol Scand. 1990;48:279–285. doi: 10.3109/00016359009005886. [DOI] [PubMed] [Google Scholar]
- 31.Ryf S, Flury S, Palaniappan S, Lussi A, van Meerbeek B, Zimmerli B. Enamel loss and adhesive remnants following bracket removal and various clean-up procedures in vitro. Eur J Orthod. 2012;34:25–32. doi: 10.1093/ejo/cjq128. [DOI] [PubMed] [Google Scholar]


