Abstract
Cell surface membrane proteins perform diverse and critical functions and are spatially and temporally regulated by membrane trafficking pathways. Although perturbations in these pathways underlie many pathologies, our understanding of these pathways at a mechanistic level remains incomplete. Using yeast as a model, we have developed an assay that reports on the surface activity of the uracil permease Fur4 in uracil auxotroph strains grown in the presence of limited uracil. This assay was used to screen a library of haploid deletion strains and identified mutants with both diminished and enhanced comparative growth in restricted uracil media. Factors identified, including various multisubunit complexes, were enriched for membrane trafficking and transcriptional functions, in addition to various uncharacterized genes. Bioinformatic analysis of expression profiles from many strains lacking transcription factors required for efficient uracil‐scavenging validated particular hits from the screen, in addition to implicating essential genes not tested in the screen. Finally, we performed a secondary mating factor secretion screen to functionally categorize factors implicated in uracil‐scavenging.
Keywords: cell surface membrane proteins, endosomes, membrane trafficking, secretory pathway, yeast genetics
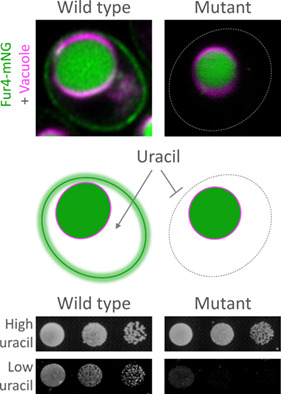
The uracil permease Fur4 localises to the yeast plasma membrane to uptake uracil from the extracellular environment (upper). Mutants with reduced surface levels of Fur4 have diminished capacity to uptake uracil (middle), and consequently exhibit growth defects specifically in low uracil media (lower). This uracil‐dependent growth phenotype was used to screen a library of haploid deletion mutants to reveal a large cohort of factors directly and indirectly associated with membrane trafficking.
1. INTRODUCTION
Cell surface membrane proteins are regulated by a variety of overlapping and often co‐regulated membrane trafficking pathways. Surface cargoes are co‐translationally imported into the endoplasmic reticulum (ER) 1 before transiting the secretory pathway to the plasma membrane (PM). 2 Surface proteins are internalized via clathrin‐mediated endocytosis, followed by recycling back to the PM or entering the lysosomal degradation pathway. 3 These pathways allow surface localization and activity of myriad proteins to be precisely controlled to meet cellular demands, for example, during the cell cycle or in response to reduced nutrient availability. However, these pathways remain incompletely characterized. The budding yeast system has been useful to discover and define membrane trafficking mechanisms. Yeast cells uptake nutrients from their external environment by various transporters that localize to the PM, such as transporters for sugars, metal ions and vitamins. 4 , 5 , 6 Amino acids and nucleobases are also actively transported into yeast cells via permeases, for example, Gap1 broadly uptakes amino acids, 7 Mup1 uptakes methionine 8 and Fur4 uptakes uracil. 9 Permease activity can be controlled by changes in transporter expression, the rate of turnover by ubiquitin‐mediated vacuolar degradation, in addition to spatiotemporal control between eisosomes and other regions of the PM. 10 , 11 , 12 , 13 , 14 To develop an assay that reports on nutrient uptake via surface transporters, we focussed on the uracil permease Fur4, 9 which is controlled by all the above‐described trafficking pathways and regulatory mechanisms. For example, the presence of uracil downregulates expression of FUR4 15 , 16 while also triggering endocytosis and Rsp5‐mediated ubiquitination and degradation of Fur4. 17 , 18 Furthermore, Fur4 activity is regulated in response to metabolic stress via storage in eisosomes. 19 , 20 , 21 Beyond this, Fur4‐mediated uptake of uracil might be considered particularly important for many lab strains that cannot synthesize uracil biosynthetically, because of disruption of the orotidine‐5′‐phosphate decarboxylase URA3 gene (eg, ura3‐52 or ura3∆), which causes the useful selection characteristics of auxotrophy and resistance to 5‐fluroorotic acid. 22 Indeed, many genome‐wide libraries 23 , 24 , 25 , 26 , 27 , 28 , 29 have been created from parental ura3∆ strains. 30 We therefore chose Fur4‐mediated uptake to develop a simple and cost‐effective growth assay that indirectly reports on the surface‐mediated uptake of uracil by the Fur4 transporter, which we used to screen a haploid library of deletion mutants for factors that regulate Fur4 trafficking.
2. RESULTS AND DISCUSSION
2.1. A Fur4‐activity‐based growth assay
The uracil permease Fur4 is dispensable for growth in rich media but is critically required when uracil‐auxotroph cells are grown in synthetic defined media containing replete (4 mg/L) uracil (Figure 1A–C). Importantly, the robust Fur4‐dependent growth of BY4742 cells, which harbour a ura3∆ mutation, 30 herein referred to as wild type, corresponds to the concentration of available uracil. There is a significantly reduced rate growth when wild‐type cells are grown in media containing 0.1 mg/L uracil, but Fur4‐dependent uracil‐scavenging supports growth (Figure 1B,C). Fur4 localization has been previously shown to respond to extracellular uracil, 16 and we confirm steady state surface localization of Fur4 tagged with mNeonGreen (mNG) is redistributed to FM4‐64 stained vacuoles following 1‐hour of uracil addition to the media (Figure 1D). Collectively these results show that the activity of the uracil‐sensitive permease Fur4 correlates with cellular growth in limited uracil conditions.
FIGURE 1.
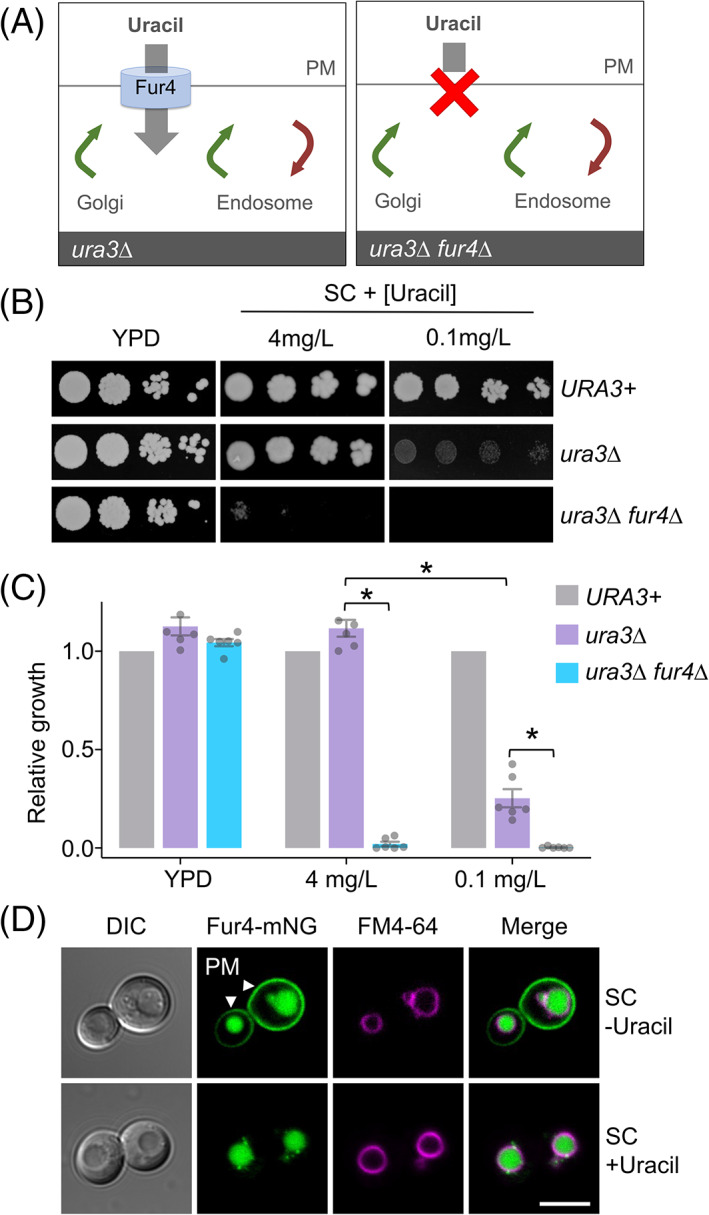
Low‐uracil growth relies on the Fur4 transporter. (A) Schematic illustration showing uracil‐auxotroph cells (ura3∆) with (left) and without (right) the uracil permease Fur4. (B) Indicated yeast strains were grown to mid‐log phase before plating on rich (YPD) and synthetic complete (SC) media containing either 4 or 0.1 mg/L uracil. (C) Quantification of yeast growth from (B), asterisks (*) indicate Student t test comparisons P = <.001. (D) Wild‐type cells expressing Fur4‐mNeonGreen (Fur4‐mNG) from its endogenous promoter were labelled with FM4‐64 for 1‐hour, grown to mid‐log phase in SC‐Ura media (upper) or in the presence of 40 μg/mL uracil for 1 hour (lower) prior to confocal microscopy. Arrows indicated plasma membrane (PM), scale bar = 5 μm
To test if low‐uracil‐specific growth could be used to screen for membrane trafficking factors that influence Fur4 surface levels, we next compared Fur4‐mNG localization in wild‐type cells and mutants that mislocalize Fur4 (Figure 2A). As expected, a temperature‐sensitive sec7‐1 allele, which disrupts activity of the Sec7 Arf‐exchange factor required for transit through the Golgi, 31 , 32 inhibits trafficking of Fur4 through the secretory pathway, with Fur4‐mNG accumulating in intracellular puncta instead of the PM. Fur4‐mNG localization is also affected in did4∆ (vps2∆) ESCRT mutants, 33 that do not permit vacuolar sorting and Fur4‐mNG instead accumulates in endosomes. However, uracil‐scavenging is likely efficient in did4∆ cells as significant Fur4‐mNG recycling back to the PM is observed, unlike Mup1‐GFP that is trapped by Snf7‐oligomers. 34 In contrast, surface levels of Fur4‐mNG was greatly reduced in both rcy1∆ or nhx1∆ mutants (Figure 2A), which lack factors required for endosomal recycling. 35 , 36 , 37 Therefore, we compared growth of rcy1∆ or nhx1∆ mutants with wild‐type cells on plates of varying uracil concentrations. There was no statistically significant difference in growth between wild‐type and trafficking mutant cells in the range of 1 to 32 mg/L uracil, but at lower uracil concentrations the rcy1∆ and nhx1∆ mutants, which have reduced surface Fur4, exhibit a low‐uracil‐specific growth defect (Figures 2B,C and S1a, Supporting Information). Although significant defects were observed at 0.5 and 0.25 mg/L uracil, we selected 0.1 and 0.05 mg/L uracil for scavenging conditions, as wild‐type cells grow efficiently but rcy1∆ or nhx1∆ both show dramatically reduced growth. Low‐uracil‐specific growth defects were not observed in did4∆ cells, demonstrating the PM levels observed by microscopy are sufficient to scavenge uracil, or sec7‐1 cells at permissive temperature, but lethality at 37°C was confirmed (Figure S1b). We tested this concept with another surface‐localized nutrient transporter, the methionine transporter Mup1 grown in methionine auxotroph (met15∆) cells but no methionine concentration that supports growth could distinguish trafficking mutants (Figure S2). We assume differences in steady state surface levels, substrate affinity and uptake pathways 8 account for this.
FIGURE 2.
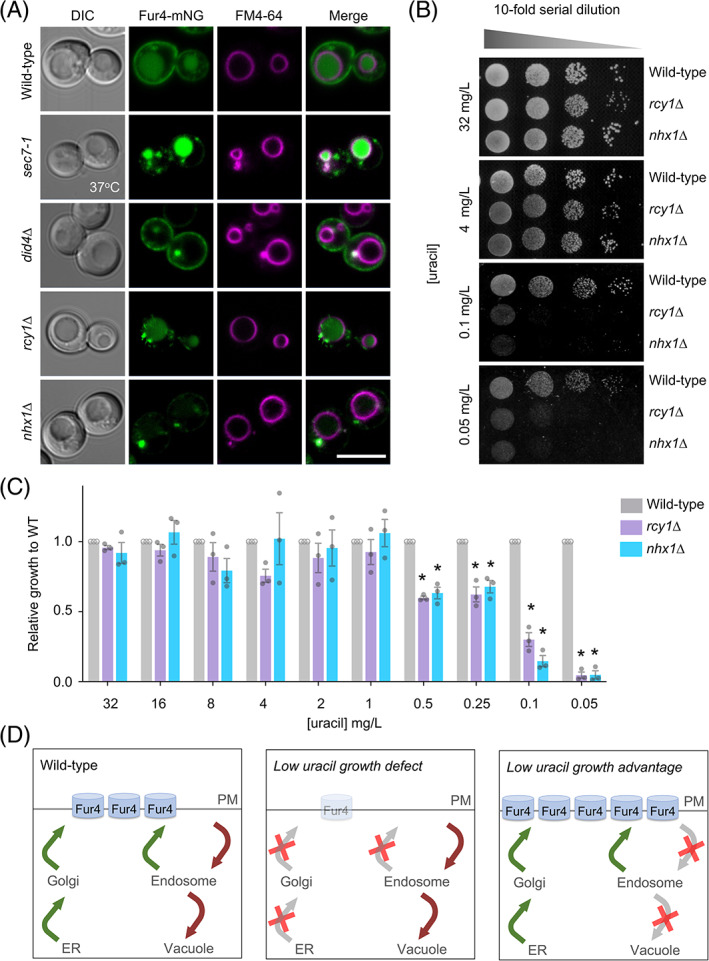
Surface localization of Fur4 is required for growth in low uracil. (A) Vacuoles from indicated strains expressing Fur4‐mNeonGreen (mNG) were labelled with FM4‐64 prior to confocal imaging. (B) Wild‐type, rcy1∆ and nhx1∆ cells grown to mid‐log phase were then spotted in a 1 in 10 serial dilution onto plates titrated with indicated concentrations of uracil and grown at 30°C for 3 days. (C) Growth of strains from (B) were quantified, asterisks (*) indicate Student t test comparisons of mutants with wild‐type cells, P = <.005. (D) Schematic diagrams showing the predicted effects on Fur4 following different trafficking pathway perturbations. Scale bar = 5 μm
2.2. A genome‐wide screen for uracil‐scavenging mutants
We hypothesized that mutants with growth similar to wild‐type cells in replete uracil but differences specifically at low uracil could be used to identify mutants from a nonessential haploid deletion library 28 with perturbed surface levels of Fur4 (Figure 2D). Cultured yeast strains representing 5132 different mutants were diluted and spotted out (16 replicates of each) on to solid agar media containing replete (4 mg/L) and limited (0.1 and 0.05 mg/L) uracil concentrations (Figure 3A). As expected, mutants with growth differences in uracil‐replete media were observed, but the screen was specifically focused on differences in growth between high and low uracil concentrations. This is exemplified by the mutants used to calibrate the assay, rcy1∆ and nhx1∆, which both exhibit growth defects specifically in low uracil when compared with neighbouring mutants (Figure 3B). A low stringency scoring system was used to identify 208 null mutants for follow‐up analysis. Candidates were grown to mid‐log phase then serially diluted and spotted on 4, 0.1 and 0.05 mg/L uracil media. Growth was quantified for the 208 mutant strains compared to a wild‐type control from the same plate, and then values were used to compare growth across uracil concentrations (Table S1). Statistical comparisons of mutants from these optimized growth assays revealed 58 mutants, such as cla4∆ (Figure 3C), that did not show a significant difference in growth compared to wild type. However, 126 mutants with significant growth defects specifically in uracil‐scavenging conditions were identified (Figure 3D), ranging from relatively subtle defects (eg, vps74∆ at 0.1 mg/L = 0.78 ± 0.04) to extreme (eg, vps3∆ at 0.1 mg/L = 0.004 ± 0.003). Furthermore, although the assay was calibrated for mutants with defective growth in low uracil, the screen identified 24 mutants with enhanced growth compared to wild type. We note many of these strains exhibit growth defects in uracil replete media, such as ipk1∆ (Figure 3C), allowing for benefits to be observed at low uracil (Table S1).
FIGURE 3.
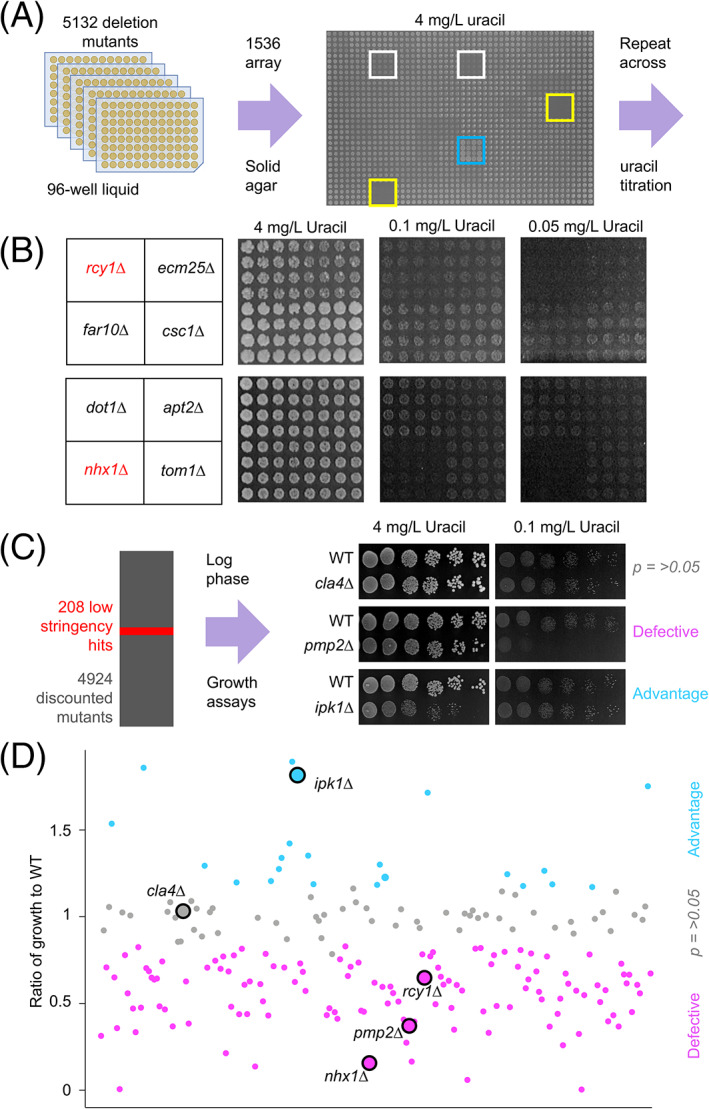
A genetic screen for mutants that affect uracil‐scavenging. (A) Yeast strains grown overnight in 96‐well plates were diluted 20‐fold in water then replicated 16 times onto solid agar plates containing varying uracil concentrations. An example 4 mg/L uracil plate shows identifier wells (yellow), alongside strains with defective (white) and accelerated (blue) growth. (B) Example of screen data showing indicated mutants grown on media containing 4, 0.1 and 0.05 mg/L uracil, including known Fur4 trafficking mutants (red). (C) The screen identified 208 candidates that were subsequently grown to mid‐log phase and spotted out over a 6‐step, 10‐fold serial dilution onto high (4 mg/L) and lower (0.1 and 0.05 mg/L) uracil containing media. Uracil‐related cellular growth relative to wild‐type was quantified and categorized as defective (eg, pmp2∆), advantageous (eg, ipk1∆) or not significantly altered (eg, cla4∆). (D) Ratio of relative growth between 4 and 0.1 mg/L uracil from (C) was plotted for all candidates
2.3. Screen enriched for molecular complexes
A comparative orthologue search 38 of uracil‐scavenging mutants identified 94 highly conserved genes, corresponding to 267 human orthologues associated with 87 distinct diseases (Table S2). Gene Ontology (GO) Slim terms were obtained 39 and revealed a number of cellular component enrichments of molecular complexes (Figure S3), including the GET complex and the prefoldin complex (Figure 4A). The identification of multiple complex members suggests the screen was stringent and robust. For example, deletion of GET1, GET2, or GET3 results in low‐uracil growth defects (Figure 4B). As the GET complex is required for sorting of tail‐anchored single‐pass membrane proteins, 40 many of which are essential factors in secretory pathway trafficking, such as SNARE proteins, 41 we presume the role of the GET complex in efficient surface trafficking of Fur4 is via an indirect membrane trafficking mechanism. Various prefoldin complex members were also identified as having defective growth specifically on low uracil (Figure 4C), implicating it as a potential regulator of Fur4 trafficking. This could be explained by prefoldin‐mediated assembly of cytoskeleton proteins. 42 , 43 Indeed, actin filament structures observed in wild‐type cells are absent in prefoldin mutant cells pfd1∆ and pac10∆ (Figure 4D), indicating impaired cytoskeletal function that could adversely affect correct trafficking of Fur4 to the surface. However, the prefoldin complex is also involved in transcriptional elongation, 44 so its role in uracil‐scavenging could be less direct.
FIGURE 4.
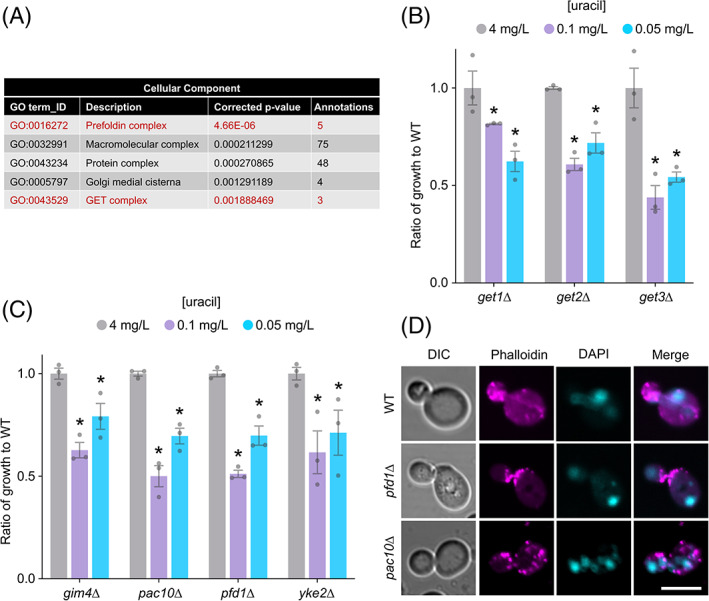
Low‐uracil screen identifies multi‐subunit complexes. (A) Gene ontology enrichment analysis for cellular component of the 150 factors identified from the screen. (B) Ratio of growth compared to wild‐type cells at 4, 0.1 and 0.05 mg/L uracil for GET complex mutants: get1∆, get2∆ and get3∆. Asterisks (*) indicate Student t test comparisons P = <.001. (C) Ratio of growth compared to wild‐type cells at 4, 0.1 and 0.05 mg/L uracil for indicated prefoldin complex mutants: gim4∆, pac10∆, pfd1∆ and yke2∆. Asterisks (*) indicate Student t test comparisons P = <.01. (D) Confocal microscopy of wild‐type (WT) and prefoldin mutants: pfd1∆ and pac10∆ stained with actin dye Phalloidin‐594 and nuclear dye DAPI and fixed with 4% paraformaldehyde. Scale bar = 5 μm
2.4. Screen enriched for trafficking and transcriptional machinery
GO enrichments for biological process revealed almost a third (44/150) of annotations were for machinery associated with membrane trafficking and signalling (Figure 5A and Table S3), including the blind identification of rcy1∆ and nhx1∆ mutants that were used to calibrate the assay (Figure 2). The other biological process significantly enriched was transcription, including three prefoldin subunit annotations (Figure 5A and Table S3). Physically interacting transcription factors were identified (Figure S3), such as members of the Complex Proteins Associated with Set1 (COMPASS) complex, Swd1, Swd3 and Sdc1 45 alongside the Swi3/Snf5 pair 46 among others that gave significant defects in low uracil (Figure 5B). We reasoned transcriptional regulators could be indirectly involved in Fur4 membrane trafficking, controlling gene expression of either essential genes not tested in the primary screen or mutants identified from the screen itself. To explore transcription factors (TFs) implicated in uracil‐scavenging, we assembled genome‐wide expression datasets for wild‐type cells vs 28 TF‐null mutants from a large‐scale microarray analyses. 47 A matrix of all mutants showed high correlation of associated factors, such as known complex members (Figure S4). Cross‐referencing expression data for 1183 genes that are essential for viability (Table S4), followed by hierarchical clustering was used to generate a heat map of related gene expression changes (Figure 5C). Strains, such as ies2∆, bre1∆ and elf1∆ created distinct expression signatures, but others were similar, such as each of the COMPASS complex mutants swd1∆, swd3∆ and sdc1∆. Particularly modulated clusters of genes were identified from this analysis (Table S5), including genes associated with membrane trafficking that we chose for experimental testing (Pma1, Gpi8, Mrs6, Gpi12 and Sec62). To achieve this, we performed uracil‐scavenging assays with strains containing Decreased Abundance by mRNA Perturbation (DAmP) cassettes at the 3′ UTR of each candidate. 48 This analysis revealed sec62‐DAmP cells, which have very low protein levels of Sec62, 49 have specific growth defects in low uracil (Figure 5D). SEC62 expression was greatly reduced upon deletion of several TFs from the screen, for example, uba4∆ and met18∆ mutants (Figure 5E). The uracil‐scavenging defects in sec62‐DAmP cells can be explained in the context of reduced Fur4 trafficking to the surface, as shown by localization defects of Fur4‐mNG, and an unrelated transporter Mup1‐GFP (Figure 5F). Collectively, this example suggests that Uba4 and Met18 regulate expression of sufficient levels of Sec62, which are all required for proper trafficking of cargoes to the PM (Figure 5G).
FIGURE 5.
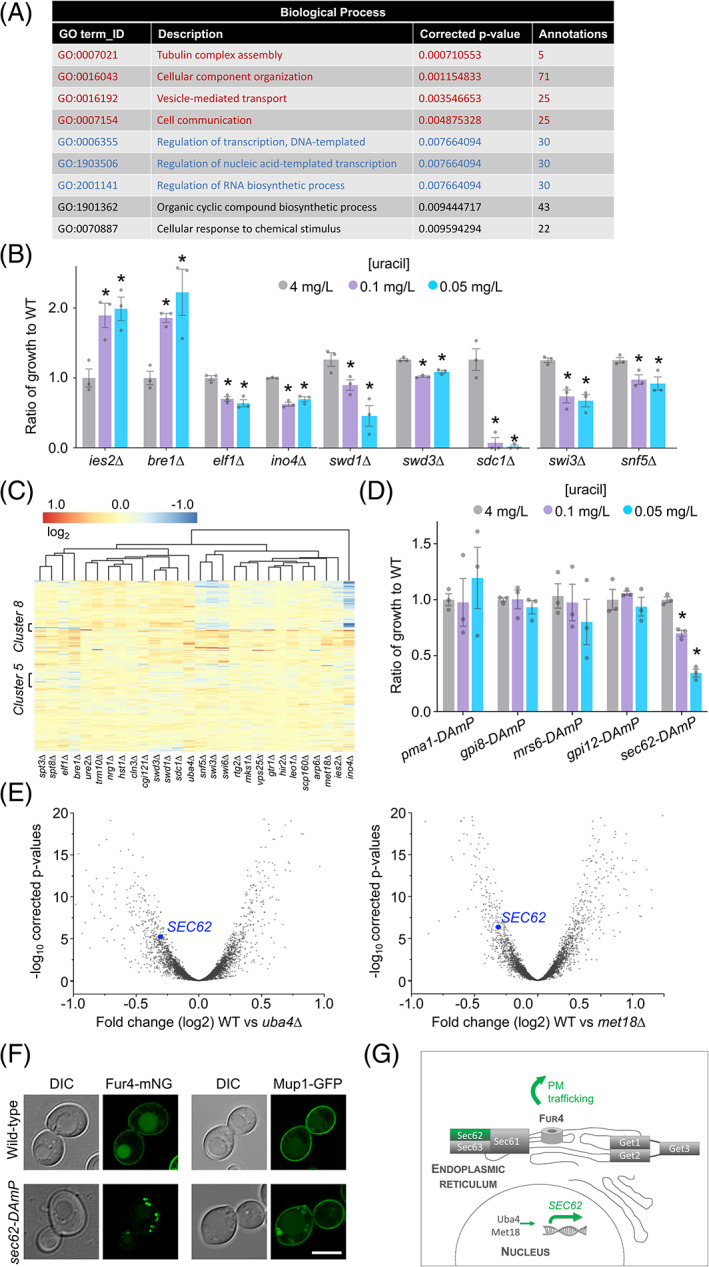
Trafficking screen enriched for transcriptional regulation. (A) Details of enriched annotations for gene ontology terms related to for biological processes for the 150 candidates identified in the screen. (B) Ratio of growth for selected transcription factor mutants identified in the screen compared to wild‐type cells at 4, 0.1 and 0.05 mg/L uracil. Asterisks (*) indicate Student t test comparisons P = <.05. (C) Hierarchical clustering and heat map of essential gene expression profiles in 28 different transcription factor null cells, coloured based on fold change. (D) Ratio of growth for indicated mutant strains compared to wild‐type (WT) cells grown on media containing 4, 0.1 and 0.05 mg/L uracil. Asterisks (*) indicate Student t test comparisons P = <.0001. (E) Volcano plots were constructed for log2 fold changes and their corresponding—log10 corrected P‐values for genes in microarray analyses comparing wild‐type cells to indicated mutants, with SEC62 labelled (blue). (F) Airyscan microscopy of Fur4‐mNG and Mup1‐GFP expressed from their respective endogenous promoters in wild‐type and sec62‐DAmP cells. Scale bar = 5 μm. (G) Schematic diagram highlighting transcriptional and ER‐associated factors identified from the screen that contribute to efficient trafficking of Fur4 to the surface
2.5. Uncharacterized factors are controlled at the transcriptional level
The uracil‐scavenging screen identified 10 uncharacterized candidates (Figure 6A). In an effort to understand whether these were also regulated by the TFs from the screen, we used a similar approach to cross‐reference gene expression profiles of the TF‐deletion strains against the 150 genes identified in the screen. Again, hierarchical clustering revealed many gene profiles share signatures across different TF deletion experiments (Figure 6B). We were particularly intrigued by ydr222w∆ mutants defective in growth from the screen (Figure 6A) as YDR222W was greatly downregulated in many of the transcription factor null mutants, including the swi3Δ, spt3∆ and COMPASS complex mutants, but upregulated in other mutants not associated with low‐uracil growth (Figures 6C and S5). We find ydr222w∆ mutants are defective in general surface protein trafficking, as the distinct Mup1‐GFP cargo exhibits mislocalization phenotypes at mid‐log phase and upon increased endocytosis via Sna3 50 and Cos proteins 51 , 52 at late‐log phase (Figure 6D). This approach helps prioritize factors, like the uncharacterized protein Ydr222w, for follow‐up testing and can be used for essentially any genetic screen, even retrospectively, that identifies transcriptional regulators. In an effort to help functionally categorize all the 150 mutants from the screen, and to begin unravelling where uncharacterized factors like Ydr222w might function, a secondary screen was performed based on the trafficking of Alpha factor through the secretory pathway to induce cell cycle arrest on a lawn of Mat A yeast, which are sensitized to arrest by virtue of a mutation in the gene that encodes the Bar1 mating factor protease (bar1‐1). Alpha factor is synthesized and subjected to post‐translational modifications through the secretory pathway before being secreted. 53 We hypothesized that mutants with defects in the secretory pathway leading to reduced alpha factor secretion would result in a reduction in the growth arrest response seen when Matα cells are spotted onto a lawn of MatA cells (Figure 6E). Conversely, mutants with no halo phenotype could act downstream of the PM, or indirectly, to explain uracil‐scavenging phenotypes. We observed mutants to have a reduction in halo size (eg, bud16∆) or a halo comparable to WT cells (eg, adk1∆). Mutants of proteins well characterized to act in the early stages of the secretory pathway such as GET‐complex nulls (discussed above) and apl2∆ 40 , 54 were seen to display a significantly reduced halo phenotype. While mutants of factors acting downstream of the secretory pathway in the endosomal system such as rcy1∆ and nhx1∆ 35 , 37 were seen to display a halo phenotype not significantly different from WT (Figure 6F). Interestingly, uncharacterized mutant ydr222w∆ gave a halo type not significantly different to WT cells. It might be the role of Ydr222w, which shares homology to the Svf1 protein implicated in survival pathways, 55 functions at endosomes to regulate nutrient transporters in response to changes in extracellular nutrients.
FIGURE 6.
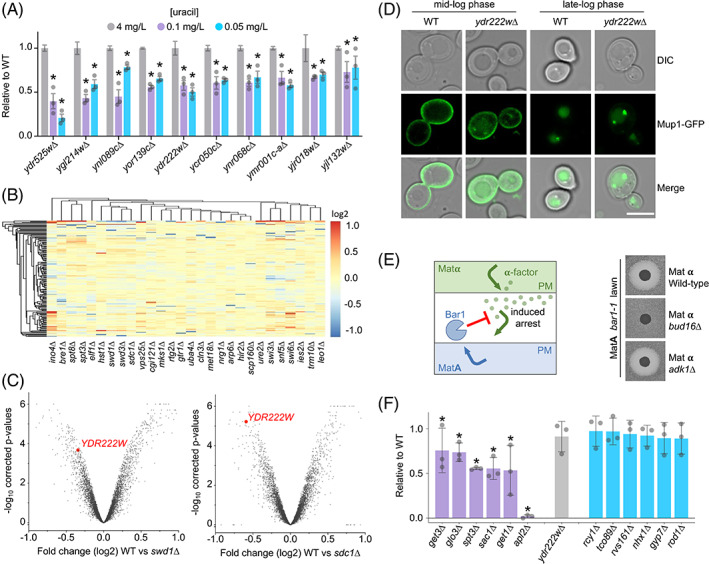
Previously uncharacterized proteins implicated in membrane trafficking. (A) Ratio of growth compared to wild‐type cells at 4, 0.1 and 0.05 mg/L uracil for indicated uncharacterized mutants identified in the screen. Asterisks (*) indicate Student t test comparisons P = <.001. (B) Hierarchical clustering of genes identified from the screen, plotting expression profiles as a heat map based on fold changes following deletion of 28 different transcriptional regulators. (C) Volcano plots constructed for log2 fold changes and their corresponding P‐values for genes in microarray analyses comparing wild‐type cells to swd1∆ cells (left) and sdc1∆ cells (right). Value for YDR222W is shown in each plot (red). (D) WT and ydr222w∆ cells expressing Mup1‐GFP were imaged at mid‐log (OD600 = 1.0) and late‐log phase (OD600 > 2). Scale bar = 5 μm. (E) Schematic showing basis of α‐factor induced inhibition of growth of mutants from the primary screen on a lawn of bar1‐1 MatA mutants (left), with representative examples shown (right). (F) Quantification of growth inhibition surrounding spots of Matα cells from screen described in (C), shown relative to wild‐type controls from same plate (n = 3). Asterisks (*) indicate Student t test comparisons P = <.1
2.6. Inducible tools to study surface proteins
In addition to fluorescently labelled Fur4‐mNG, and other surface cargoes affected by mutants from the screen, like Mup1‐GFP and the G‐protein coupled receptor Ste3 tagged with mCherry (Figure S6), for localization experiments to validate trafficking mutants, we created GFP tagged versions of both full length Fur4, or a mutant lacking its N‐terminal 60 residues under copper inducible CUP1 promoter, to allow temporal control of trafficking (Figure 7A–D). We reasoned Fur4∆N‐GFP would be a suitable reporter for secretory pathway mutants, as it cannot be endocytosed, 18 however localization in get1∆, get2∆ and get3∆ was indistinguishable from wild‐type cells (Figure 7E). This might suggest the GET complex exhibits a distinct function in uracil‐uptake. However, given the GET complex is known to be involved in secretory trafficking 40 and in addition to all three members being identified from a blind screen for uracil‐scavenging, get1∆ get2∆ and get3∆ cells were also all defective in secretion of mating factor (0.53 ± 0.28, 0.80 ± 0.15 and 0.76 ± 0.24, respectively). Therefore, we favour the explanation that the uracil‐scavenging assay is sensitive enough to reveal a phenotype that is not apparent from steady state localization experiments. We did observe small amounts of signal at the ER of the truncated Fur4∆N‐GFP. To confirm that the peripheral Fur4∆N‐GFP signal was indeed the PM, and not the cortical ER, we imaged the ER marker Sec63‐RFP and GFP labelled versions of nicotinic acid permease Tna1, which traffics through the secretory pathway when tagged at the N‐terminus (Figure S7) but is retained in the ER when tagged at the C‐terminus. 26 Unlike these ER proteins, Fur4∆N‐GFP signal is contiguous at the surface and localizes to eisosomes (Figure 7F), as previously documented. 21 Furthermore, perinuclear signal of Fur4∆N‐GFP is very weak compared to the peripheral signal, unlike the ER localised proteins that exhibit the opposite phenotype with an intense signal at the perinuclear ER compared with the cortical ER (Figure 7G). Finally, we show clear distinction between Fur4∆N‐GFP at the PM and ER‐PM contact sites 56 indicated by Sec63‐RFP (Figure 7H,I).
FIGURE 7.
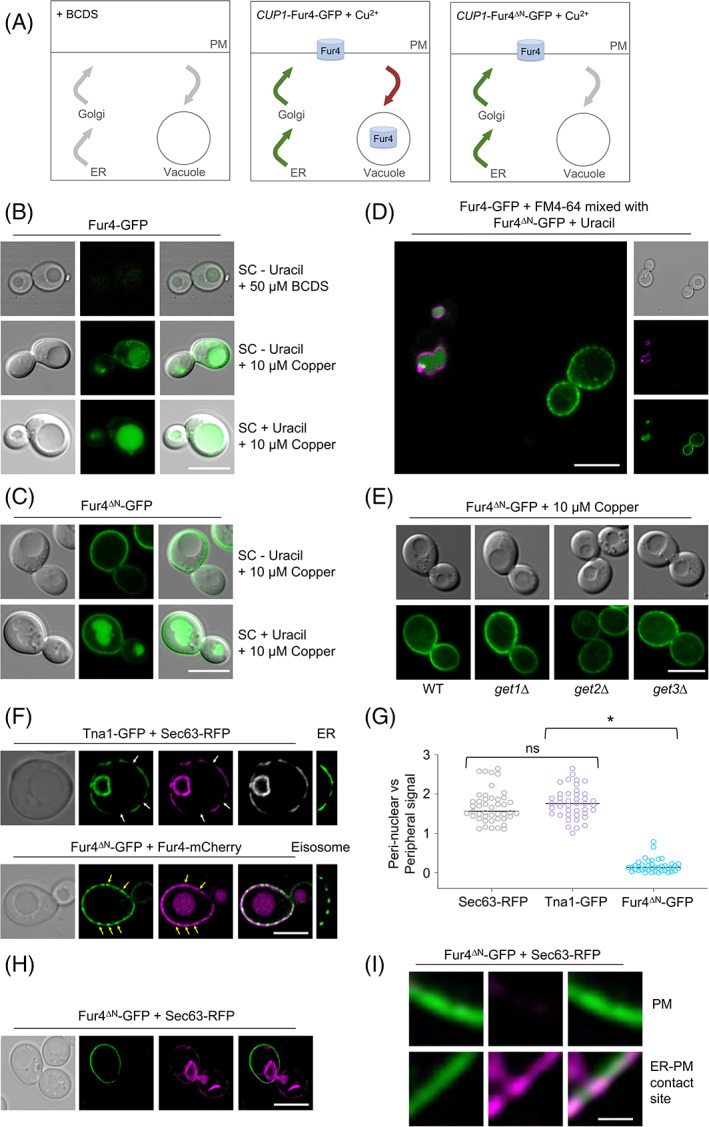
Inducible tools to study surface proteins. (A) Schematic diagram showing repression of the CUP1 promoter in the presence of bathocuproine disculfonic acid (BCDS) (left), and the copper induced expression of Fur4‐GFP, which localizes to the PM and vacuole (middle) and Fur4∆N‐GFP that localizes exclusively to the surface. (B–D) Wild‐type cells transformed with CUP1‐Fur4‐GFP (B) and CUP1‐Fur4∆N‐GFP plasmids were grown under indicated conditions prior to fluorescence microscopy. A mixture of these cells, with vacuoles of Fur4‐GFP expressing cells first labelled with FM4‐64, were also imaged simultaneously (D). (E) Indicated cells expressing Fur4∆N‐GFP were grown to log‐phase followed by confocal microscopy. (F) Cells co‐expressing Tna1‐GFP and Sec63‐RFP (upper) or Fur4∆N‐GFP and Fur4‐mCherry (lower) were imaged by Airyscan microscopy. An example of Tna1‐GFP localized to the cortical ER (upper) and Fur4∆N‐GFP localized to eisosomes is included on right panels. White arrows indicate regions of the cortical ER that are not closely associated with the PM, yellow arrows indicate eisosomes. (G) The fluorescence signal of perinuclear ER was compared with peripheral signal (either cortical ER or PM) for Sec63‐RFP, Tna1‐GFP and Fur4∆N‐GFP. (H) Wild‐type cells expressing Fur4∆N‐GFP + Sec63‐RFP were grown to mid‐log phase and then imaged by Airyscan microcopy. (I) A zoomed in region of the periphery from (H) indicating Fur4∆N‐GFP localizing exclusively to the PM (upper) and membrane contact sites with the ER (lower)
3. SUMMARY
In conclusion, we report a simple growth assay that indirectly reports on surface protein trafficking via nutrient transporter activity of uracil auxotroph yeast strains. The assay relies on comparison of growth efficiency of yeast cells on relatively high and low uracil media to infer the capacity of the Fur4 transporter to scavenge uracil required for growth. It is therefore cheap, simple and easy to perform at high throughput, as demonstrated by testing a haploid deletion library of over 5000 yeast strains. This genetic screen identified many novel candidates as potential Fur4 regulators and was particularly enriched for membrane trafficking and transcriptional machinery. By cross‐referencing essential genes and factors identified from the screen, with genome‐wide expression patterns in most of these transcriptional regulators, we were able to identify connections between TFs and the genes they regulate, both of which relate to uracil‐scavenging. As an example, our bioinformatics identified the essential gene SEC62 and the uncharacterized gene YDR222W, as repressed in many of the TFs mutants identified from the screen. As proof of principle, we show experimentally that decreased expression of SEC62 does, as expected, result in defects in surface protein trafficking. Similarly, we confirm a role for Ydr222w in surface protein trafficking, highlighting the discovery benefits in following transcriptional regulators identified for a given genetic screen. Indeed, we have recently identified an unexpected trafficking role for the Mig1 transcriptional regulator in endocytosis 20 and endosomal recycling, 57 suggesting the >20 candidates implicated in this study could also be explored functionally in the context of either global or cargo specific cargo trafficking mechanisms. Although we cannot exclude the possibility that mutants have indirect effects on uracil scavenging, for example via the biosynthetic or metabolic processes. However, as most genes were either enriched for membrane trafficking or can be functionally explained in the context of membrane trafficking, this suggests the bulk of mutants reported likely affect trafficking pathways used by Fur4. Furthermore, both factors prioritized by bioinformatics, Sec62 and Ydr222w, are shown to be required for proper sorting of fluorescently labelled cargoes. Our data support the idea that mutants with even subtle decreases in Fur4 at the PM can reveal a uracil‐scavenging phenotype. Therefore, we propose this uracil‐scavenging assay, used in combination with fluorescently tagged cargoes, the mating factor secretion assay and bioinformatic approaches all documented herein serve as useful tools to study surface protein trafficking, in addition to the mutants identified and characterized, many of which are novel and evolutionarily conserved, that can inform future studies.
4. METHODS
4.1. Cell culture
Yeast cells were grown in rich yeast extract peptone dextrose (YPD) media (1% (wt/vol) yeast extract, 2% (wt/vol) peptone, 2% (wt/vol) d‐glucose) or synthetic complete (SC) minimal media (0.675% (wt/vol) yeast nitrogen base without amino acids, 2% (wt/vol) d‐glucose, plus the appropriate amino acid or base dropouts for selection; (Formedium Norfolk, UK). Standard SC media contained 4 mg/L uracil and lower concentrations used, typically 0.1 and 0.05 mg/L for uracil stress conditions listed throughout. Cells were routinely cultured overnight to early/mid‐log phase (OD600 < 1.0) prior to experimental procedures. Yeast strains used in this study are listed in Table S7 and plasmids used are itemized in Table S8.
4.2. Yeast growth assays
For the primary screen, 10 μL culture of each mutant strain was grown in the well of a 96‐well plate containing 150 μL of YPD media with 250 μg/mL G418 overnight at 30°C in a humidified incubator. The bulk of YPD was then removed, followed by resuspension in water, and transfer of 10 μL to a fresh 96‐well plate containing 200 μL sterile water. Dilutions were then mixed with a 96‐pin replicator and pinned onto solid agar in 1536 format using a ROTOR‐HDA (Singer Instruments). Each mutant was pinned 16 times on solid media containing varying concentrations of uracil (4 or 0.1 or 0.05 mg/L) incubated at 30°C until sufficient growth was observed, followed by Phenobooth image capture (Singer Instruments) to record yeast growth. For follow‐up growth assays, the principle was the same, but cells were cultured in 5 mL serial dilutions to capture mid‐log phase cells, which were then harvested with equivalent volumes to other strains, including a wild‐type control, to be plated together. Six‐step serial dilutions (10‐fold) of each strain was generated in sterile water, followed by plating on SC plates containing of 4, 0.1 and 0.05 mg/L uracil. Plates were then incubated at 30°C for 3 days. Plates were imaged and the signal intensity of each spot was measured (ImageJ; NIH). Signal intensity of dilutions 3 to 5 were normalized to background and averaged and then values relative to WT were calculated.
4.3. Confocal microscopy
Yeast cells expressing GFP and/or mCherry tagged proteins were grown to mid‐log phase and then viewed in kill‐buffer (50 mM Tris pH 8.0, 10 mM NaN3, 10 mM NaF) or water (dH2O) at room temperature on Zeiss laser scanning confocal instruments (LSM710 or LSM880 equipped with Airyscan) with a Plan‐Apochromat 63×/1.4 Differential Interference Contrast (DIC) objective lens. Images were captured using Zen Black Imaging software and modified using Image J (NIH). Yeast vacuoles were labelled with 1.6 μM FM4‐64 (ThermoFisher) in YPD media, followed by 3× washes with SC media and further growth in SC media for 1‐hour prior to imaging. Where stated cells were fixed for imaging by spinning down mid‐log cultures and washing with 100 mM potassium phosphate buffer (pH 8) at 7000 rpm. Cells were resuspended and incubated for 10 min at room temperature in 4% paraformaldehyde (950 μL K‐Phos, 50 μL PFA) before spinning at 7000 rpm and resuspending in 1× PBS. Fixed cells were stained with Rhodamine‐phalloidin (Phalloidin‐594) and DAPI.
4.4. α‐factor‐induced arrest “halo” assay
Wild‐type and mutant Matα cells were grown to saturation overnight and then diluted back and grown for 4 to 6 hours in YPD media. Equivalent volumes of cells were harvested and spun down and brought up in 50 μL sterile water before spotting on low density lawns of MatA bar1‐1 cells created from mid‐log phase cells on YPD plates. Plates were incubated at 30° overnight. Halos of growth inhibition for mutants relative to wild type were determined using ImageJ (NIH).
4.5. Gene ontology analyses
All GO enrichments were acquired using the GO Term Finder v0.86, 39 using the default settings. The default background was used for all analyses except those for clusters derived from essential gene expression analysis, which instead used a background of essential genes listed in Table S4.
4.6. Hierarchical clustering and gene expression analyses
Microarray data documenting changes in gene expression in mutant strains lacking transcriptional regulators compared to wild type were assembled, representing 6123 genes. The data were read into R (v4.0.4; R Core Team, 2021) then processed using the dplyr v1.0.4 58 and janitor v2.0.1 59 packages to include only 28 strains lacking transcription factors identified in the uracil‐scavenging genetic screen. For downstream bioinformatic analyses, two gene reference subsets were generated: the first included all 147 verified candidates from the screen, and the second included 1183 genes denoted as essential for viability. For all analyses, hierarchical clustering was performed using the pheatmap package v1.0.12 60 using complete linkage. Elbow and silhouette analyses were performed using the factoextra package v1.0.7 61 to determine the optimal number of clusters to guide further GO enrichment analyses. The Pearson correlation matrix of the whole genome expression data was produced with base R and visualized with the pheatmap package.
4.7. String analysis
Interactome analysis of physical interactions was carried out using STRING software. 62
4.8. Statistical analysis
Statistical significance for experimental conditions was calculated using a Student t test/Bonferroni‐Dunn method in GraphPad prism v8. Asterisks were used to denote significance on scatterplot histograms with P values documented in Tables S1 and S9.
CONFLICT OF INTEREST
The authors declare no potential conflict of interest.
5.
PEER REVIEW
The peer review history for this article is available at https://publons.com/publon/10.1111/tra.12815.
Supporting information
Table S1 Uracil growth screen results and statistics
Table S2 Orthologues of screen candidates and associated human diseases
Table S3 GO enrichment annotations for biological processes
Table S4 Genes essential for viability used in bioinformatics
Table S5 Cluster analysis of essential genes regulated by screen TFs
Table S6 Mating factor induced growth arrest screen results and statistics
Table S7 Yeast strains used in this study
Table S8 Plasmids used in this study
Table S9 Statistical tests
Appendix S1: Supporting Information
ACKNOWLEDGMENTS
We would like to thank Luke Mackinder, Jared Cartwright and the Protein Production Laboratory at the York Bioscience Technology Facility (BTF) for access and assistance with the Rotor HDA robotics, and the Imaging and Cytometry Core of the York BTF for technical support with microscopy. Thanks to Daphne Ezer for assistance with bioinformatics, and to Maya Schuldiner (Weizmann Institute of Science, Israel) for providing DAmP‐cassette integration yeast strains. We are grateful to Kamilla Laidlaw and other members of the lab for useful comments and assistance with the project. This research was supported by a Sir Henry Dale Research Fellowship from the Wellcome Trust and the Royal Society 204636/Z/16/Z (CM) and a University of York Biology Department PhD studentship (KP).
Paine KM, Ecclestone GB, MacDonald C. Fur4‐mediated uracil‐scavenging to screen for surface protein regulators. Traffic. 2021;22(11):397-408. doi: 10.1111/tra.12815
Funding information Wellcome Trust & Royal Society, Grant/Award Number: 204636/Z/16/Z
REFERENCES
- 1. Deshaies RJ, Sanders SL, Feldheim DA, Schekman R. Assembly of yeast Sec proteins involved in translocation into the endoplasmic reticulum into a membrane‐bound multisubunit complex. Nature. 1991;349:806‐808. [DOI] [PubMed] [Google Scholar]
- 2. Stalder D, Gershlick DC. Direct trafficking pathways from the Golgi apparatus to the plasma membrane. Seminars in Cell & Developmental Biology. 2020;107:112‐125. 10.1016/j.semcdb.2020.04.001 [DOI] [PMC free article] [PubMed] [Google Scholar]
- 3. Laidlaw KME, MacDonald C. Endosomal trafficking of yeast membrane proteins. Biochem Soc Trans. 2018;46:1551‐1558. [DOI] [PMC free article] [PubMed] [Google Scholar]
- 4. Lagunas R. Sugar transport in Saccharomyces cerevisiae . FEMS Microbiol Lett. 1993;104:229‐242. [DOI] [PubMed] [Google Scholar]
- 5. Nelson N. Metal ion transporters and homeostasis. EMBO J. 1999;18:4361‐4371. [DOI] [PMC free article] [PubMed] [Google Scholar]
- 6. Perli T, Wronska AK, Ortiz‐Merino RA, Pronk JT, Daran JM. Vitamin requirements and biosynthesis in Saccharomyces cerevisiae . Yeast. 2020;37:283‐304. [DOI] [PMC free article] [PubMed] [Google Scholar]
- 7. Grenson M, Hou C, Crabeel M. Multiplicity of the amino acid permeases in Saccharomyces cerevisiae. IV evidence for a general amino acid permease. J Bacteriol. 1970;103:770‐777. [DOI] [PMC free article] [PubMed] [Google Scholar]
- 8. Isnard AD, Thomas D, Surdin‐Kerjan Y. The study of methionine uptake in Saccharomyces cerevisiae reveals a new family of amino acid permeases. J Mol Biol. 1996;262:473‐484. [DOI] [PubMed] [Google Scholar]
- 9. Jund R, Lacroute F. Genetic and physiological aspects of resistance to 5‐fluoropyrimidines in Saccharomyces cerevisiae . J Bacteriol. 1970;102:607‐615. [DOI] [PMC free article] [PubMed] [Google Scholar]
- 10. Babst M. Eisosomes at the intersection of TORC1 and TORC2 regulation. Traffic. 2019;20:543‐551. [DOI] [PMC free article] [PubMed] [Google Scholar]
- 11. Bianchi F, van't Klooster JS, Ruiz SJ, Poolman B. Regulation of amino acid transport in Saccharomyces cerevisiae . Microbiol Mol Biol Rev. 2019;83:e00024‐19. [DOI] [PMC free article] [PubMed] [Google Scholar]
- 12. Ljungdahl PO, Daignan‐Fornier B. Regulation of amino acid, nucleotide, and phosphate metabolism in Saccharomyces cerevisiae . Genetics. 2012;190:885‐929. [DOI] [PMC free article] [PubMed] [Google Scholar]
- 13. MacDonald C, Shields S, Williams C, Winistorfer S, Piper R. A cycle of ubiquitination regulates adaptor function of the Nedd4‐family ubiquitin ligase Rsp5. Curr. Biol. 2020;30:465‐479.e5. [DOI] [PMC free article] [PubMed] [Google Scholar]
- 14. Sardana R, Emr SD. Membrane protein quality control mechanisms in the endo‐lysosome system. Trends Cell Biol. 2021;31:269‐283. [DOI] [PubMed] [Google Scholar]
- 15. Blondel M‐O, Morvan J, Dupré S, Le Urban‐Grimal D, Haguenauer‐Tsapis R, Volland C. Direct sorting of the yeast uracil permease to the endosomal system is controlled by uracil binding and Rsp5p‐dependent ubiquitylation. Mol Biol Cell. 2004;15:883‐895. [DOI] [PMC free article] [PubMed] [Google Scholar]
- 16. Séron K, Blondel MO, Haguenauer‐Tsapis R, Volland C. Uracil‐induced down‐regulation of the yeast uracil permease. J Bacteriol. 1999;181:1793‐1800. [DOI] [PMC free article] [PubMed] [Google Scholar]
- 17. Hein C, Springael J‐Y, Volland C, Haguenauer‐Tsapis R, André B. NPI1, an essential yeast gene involved in induced degradation of Gap1 and Fur4 permeases, encodes the Rsp5 ubiquitin–protein ligase. Mol Microbiol. 1995;18:77‐87. [DOI] [PubMed] [Google Scholar]
- 18. Keener JM, Babst M. Quality control and substrate‐dependent downregulation of the nutrient transporter Fur4. Traffic. 2013;14:412‐427. [DOI] [PMC free article] [PubMed] [Google Scholar]
- 19. Appadurai D, Gay L, Moharir A, et al. Plasma membrane tension regulates eisosome structure and function. Molecular Biology of the Cell. 2020;31(4):287‐303. 10.1091/mbc.e19-04-0218 [DOI] [PMC free article] [PubMed] [Google Scholar]
- 20. Laidlaw KME, Bisinski DD, Shashkova S, et al. A glucose‐starvation response governs endocytic trafficking and eisosomal retention of surface cargoes in budding yeast. Journal of Cell Science. 2021;134(2). 10.1242/jcs.257733 [DOI] [PMC free article] [PubMed] [Google Scholar]
- 21. Moharir A, Gay L, Appadurai D, Keener J, Babst M. Eisosomes are metabolically regulated storage compartments for APC‐type nutrient transporters. Mol Biol Cell. 2018;29:2113‐2127. [DOI] [PMC free article] [PubMed] [Google Scholar]
- 22. Boeke JD, La Croute F, Fink GR. A positive selection for mutants lacking orotidine‐5′‐phosphate decarboxylase activity in yeast: 5‐fluoro‐orotic acid resistance. Molecular and General Genetics MGG. 1984;197:345‐346. 10.1007/bf00330984 [DOI] [PubMed] [Google Scholar]
- 23. Arita Y, Kim G, Li Z, Friesen H, et al. A genome‐scale yeast library with inducible expression of individual genes. Mol Syst Biol. 2021;17:e10207. [DOI] [PMC free article] [PubMed] [Google Scholar]
- 24. Ghaemmaghami S, Huh WK, Bower K, et al. Global analysis of protein expression in yeast. Nature. 2003;425:737‐741. [DOI] [PubMed] [Google Scholar]
- 25. Giaever G, Chu AM, Ni L, et al. Functional profiling of the Saccharomyces cerevisiae genome. Nature. 2002;418:387‐391. [DOI] [PubMed] [Google Scholar]
- 26. Huh WK, Falvo JV, Gerke LC, et al. Global analysis of protein localization in budding yeast. Nature. 2003;425:686‐691. [DOI] [PubMed] [Google Scholar]
- 27. Weill U, Yofe I, Sass E, et al. Genome‐wide SWAp‐Tag yeast libraries for proteome exploration. Nat Methods. 2018;15:617‐622. [DOI] [PMC free article] [PubMed] [Google Scholar]
- 28. Winzeler EA, Shoemaker DD, Astromoff A, et al. Functional characterization of the S. cerevisiae genome by gene deletion and parallel analysis. Science. 1999;285:901‐906. [DOI] [PubMed] [Google Scholar]
- 29. Yofe I, Weill U, Meurer M, et al. One library to make them all: streamlining the creation of yeast libraries via a SWAp‐Tag strategy. Nat Methods. 2016;13:371‐378. [DOI] [PMC free article] [PubMed] [Google Scholar]
- 30. Brachmann CB, Davies A, Cost GJ, et al. Designer deletion strains derived from Saccharomyces Cerevisiae S288C: A useful set of strains and plasmids for PCR‐mediated gene disruption and other applications. Yeast (Chichester, England). 1998;14:115‐132. [DOI] [PubMed] [Google Scholar]
- 31. Franzusoff A, Redding K, Crosby J, Fuller RS, Schekman R. Localization of components involved in protein transport and processing through the yeast Golgi apparatus. J Cell Biol. 1991;112:27‐37. [DOI] [PMC free article] [PubMed] [Google Scholar]
- 32. Novick P, Field C, Schekman R. Identification of 23 complementation groups required for post‐translational events in the yeast secretory pathway. Cell. 1980;21:205‐215. [DOI] [PubMed] [Google Scholar]
- 33. Babst M, Katzmann DJ, Estepa‐Sabal EJ, Meerloo T, Emr SD. ESCRT‐III: an endosome‐associated heterooligomeric protein complex required for MVB sorting. Dev Cell. 2002;3:271‐282. [DOI] [PubMed] [Google Scholar]
- 34. Teis D, Saksena S, Emr SD. Ordered assembly of the ESCRT‐III complex on endosomes is required to sequester cargo during MVB formation. Dev Cell. 2008;15:578‐589. [DOI] [PubMed] [Google Scholar]
- 35. Brett CL, Tukaye DN, Mukherjee S, Rao R. The yeast endosomal Na(K)/H exchanger Nhx1 regulates cellular pH to control vesicle trafficking. Molecular Biology of the Cell. 2005;16(3):1396‐1405. 10.1091/mbc.e04-11-0999 [DOI] [PMC free article] [PubMed] [Google Scholar]
- 36. MacDonald C, Piper RC. Genetic dissection of early endosomal recycling highlights a TORC1‐independent role for Rag GTPases. J Cell Biol. 2017;216:3275‐3290. [DOI] [PMC free article] [PubMed] [Google Scholar]
- 37. Wiederkehr A, Avaro S, Prescianotto‐Baschong C, Haguenauer‐Tsapis R, Riezman H. The F‐box protein Rcy1p is involved in endocytic membrane traffic and recycling out of an early endosome in Saccharomyces cerevisiae . J Cell Biol. 2000;149:397‐410. [DOI] [PMC free article] [PubMed] [Google Scholar]
- 38. Balakrishnan R, Park J, Karra K, et al. YeastMine—an integrated data warehouse for Saccharomyces cerevisiae data as a multipurpose tool‐kit database. Database (Oxford). 2012;2012:bar062. [DOI] [PMC free article] [PubMed] [Google Scholar]
- 39. Cherry JM, Hong EL, Amundsen C, et al. Saccharomyces genome database: the genomics resource of budding yeast. Nucleic Acids Res. 2012;40:D700‐D705. [DOI] [PMC free article] [PubMed] [Google Scholar]
- 40. Schuldiner M, Metz J, Schmid V, et al. The GET complex mediates insertion of tail‐anchored proteins into the ER membrane. Cell. 2008;134:634‐645. [DOI] [PMC free article] [PubMed] [Google Scholar]
- 41. Bulbarelli A, Sprocati T, Barberi M, Pedrazzini E, Borgese N. Trafficking of tail‐anchored proteins: transport from the endoplasmic reticulum to the plasma membrane and sorting between surface domains in polarised epithelial cells. J Cell Sci. 2002;115:1689‐1702. [DOI] [PubMed] [Google Scholar]
- 42. Geissler S, Siegers K, Schiebel E. A novel protein complex promoting formation of functional alpha‐ and gamma‐tubulin. EMBO J. 1998;17:952‐966. [DOI] [PMC free article] [PubMed] [Google Scholar]
- 43. Vainberg IE, Lewis SA, Rommelaere H, et al. Prefoldin, a chaperone that delivers unfolded proteins to cytosolic chaperonin. Cell. 1998;93:863‐873. [DOI] [PubMed] [Google Scholar]
- 44. Millán‐Zambrano G, Rodríguez‐Gil A, Peñate X, et al. The prefoldin complex regulates chromatin dynamics during transcription elongation. PLoS Genet. 2013;9:e1003776. [DOI] [PMC free article] [PubMed] [Google Scholar]
- 45. Gerber M, Shilatifard A. Transcriptional elongation by RNA polymerase II and histone methylation. J Biol Chem. 2003;278:26303‐26306. [DOI] [PubMed] [Google Scholar]
- 46. Zhou H, Chen G, Dong C, et al. Snf5 and Swi3 subcomplex formation is required for SWI/SNF complex function in yeast. Biochem Biophys Res Commun. 2020;526:934‐940. [DOI] [PubMed] [Google Scholar]
- 47. Kemmeren P, Sameith K, Van De Pasch LAL, et al. Large‐scale genetic perturbations reveal regulatory networks and an abundance of gene‐specific repressors. Cell. 2014;157:740‐752. [DOI] [PubMed] [Google Scholar]
- 48. Breslow DK, Cameron DM, Collins SR, et al. A comprehensive strategy enabling high‐resolution functional analysis of the yeast genome. Nat Methods. 2008;5:711‐718. [DOI] [PMC free article] [PubMed] [Google Scholar]
- 49. Schuldiner M, Collins SR, Thompson NJ, et al. Exploration of the function and organization of the yeast early secretory pathway through an epistatic miniarray profile. Cell. 2005;123:507‐519. [DOI] [PubMed] [Google Scholar]
- 50. Macdonald C, Stringer DK, Piper RC. Sna3 is an Rsp5 adaptor protein that relies on ubiquitination for its MVB sorting. Traffic. 2012;13:586‐598. [DOI] [PMC free article] [PubMed] [Google Scholar]
- 51. MacDonald C, Payne JA, Aboian M, Smith W, Katzmann DJ, Piper RC. A family of tetraspans organizes cargo for sorting into multivesicular bodies. Developmental Cell. 2015;33(3):328‐342. 10.1016/j.devcel.2015.03.007 [DOI] [PMC free article] [PubMed] [Google Scholar]
- 52. MacDonald C, Stamnes MA, Katzmann DJ, Piper RC. Tetraspan cargo adaptors usher GPI‐anchored proteins into multivesicular bodies. Cell Cycle. 2015;14(23):3673‐3678. 10.1080/15384101.2015.1100773 [DOI] [PMC free article] [PubMed] [Google Scholar]
- 53. Waters M, Evans E, Blobel G. Prepro‐alpha‐factor has a cleavable signal sequence ‐ PubMed. J Biol Chem. 1988;263:6209‐6214. [PubMed] [Google Scholar]
- 54. Rad MR, Phan HL, Kirchrath L, et al. Saccharomyces cerevisiae Apl2p, a homologue of the mammalian clathrin AP β subunit, plays a role in clathrin‐dependent Golgi functions. J Cell Sci. 1995;108:1605‐1615. [DOI] [PubMed] [Google Scholar]
- 55. Vander Heiden M, Choy J, VanderWeele D, et al. Bcl‐x(L) complements Saccharomyces cerevisiae genes that facilitate the switch from glycolytic to oxidative metabolism. J Biol Chem. 2002;277:44870‐44876. [DOI] [PubMed] [Google Scholar]
- 56. Zaman MF, Nenadic A, Radojičić A, Rosado A, Beh CT. Sticking with it: ER‐PM membrane contact sites as a coordinating nexus for regulating lipids and proteins at the cell cortex. Front Cell Dev Biol. 2020;8:675. [DOI] [PMC free article] [PubMed] [Google Scholar]
- 57. Laidlaw, K.M. , Paine, K.M. , Bisinski, D.D. , Calder, G. , MacDonald, C. & Contribution, E. (2021a). Endosomal recycling to the surface mediated by Gpa1 and PI3‐kinase is inhibited by glucose starvation. BioRxiv 2021.04.02.438183.
- 58. Wickham, H. , François, R. , Henry, L. & Müller, K. (2020). A grammar of data manipulation (R package dplyr version 1.0.0).
- 59. Firke, S. (2021). Simple tools for examining and cleaning dirty data (R package janitor version 2.1.0).
- 60. Kolde, R. (2019). CRAN package pheatmap.
- 61. Alboukadel, K and Fabian, M. (2019). Factoextra: extract and visualize the results of multivariate data analyses. R package.
- 62. Szklarczyk D, Gable AL, Lyon D, et al. STRING v11: protein‐protein association networks with increased coverage, supporting functional discovery in genome‐wide experimental datasets. Nucleic Acids Res. 2019;47:D607‐D613. [DOI] [PMC free article] [PubMed] [Google Scholar]
Associated Data
This section collects any data citations, data availability statements, or supplementary materials included in this article.
Supplementary Materials
Table S1 Uracil growth screen results and statistics
Table S2 Orthologues of screen candidates and associated human diseases
Table S3 GO enrichment annotations for biological processes
Table S4 Genes essential for viability used in bioinformatics
Table S5 Cluster analysis of essential genes regulated by screen TFs
Table S6 Mating factor induced growth arrest screen results and statistics
Table S7 Yeast strains used in this study
Table S8 Plasmids used in this study
Table S9 Statistical tests
Appendix S1: Supporting Information


