

Abstract
Decades of research on protein folding have primarily focused on a subset of small proteins that can reversibly refold from a denatured state. However, these studies have generally not been representative of the complexity of natural proteomes, which consist of many proteins with complex architectures and domain organizations. Here, we introduce an experimental approach to probe protein refolding kinetics for whole proteomes using mass spectrometry-based proteomics. Our study covers the majority of the soluble E. coli proteome expressed during log-phase growth, and among this group, we find that one third of the E. coli proteome is not intrinsically refoldable on physiological timescales, a cohort that is enriched with certain fold-types, domain organizations, and other biophysical features. We also identify several properties and fold-types that correlate with slow refolding on the minute timescale. Hence, these results illuminate when exogenous factors and processes, such as chaperones or co-translational folding, might be required for efficient protein folding.
Graphical Abstract
INTRODUCTION
Many experiments of protein folding – conducted on purified, small, single-domain, soluble proteins – follow the proportion of protein molecules that are folded as a function of time, temperature, denaturant concentration, or sequence,1-3 and have yielded immense insight into the molecular determinants that underpin stable globular folds.4,5 These studies are typically interpreted through the ground truth of Anfinsen’s dogma, which states that proteins can intrinsically refold to their native states from unfolded forms because the native states represent global thermodynamic minima.6-10 On the other hand, there are several possible reasons why a protein might not be able to refold to its native form. In the unusual case of alpha lytic protease, it is because the unfolded state is more stable than the native state.11,12 In other situations, it may be because the native state is challenging to access, or is metastable relative to other folded (but non-native) conformations. In any case, whether non-refoldability is common for more complex ‘non-model’ proteins is not generally known. In this study, we introduce an experimental approach to probe protein refolding kinetics for whole proteomes. We accomplish this by first unfolding and refolding E. coli lysates under conditions without precipitation, and then interrogating the resulting protein structures using a permissive protease that preferentially cleaves at flexible regions. Using mass spectrometry, we analyze the digestion patterns to globally assess structural differences between native proteins and their ‘refolded’ forms. These experiments have greater structural resolution than classic spectroscopic measures (such as circular dichroism, fluorescence, or FRET) employed in many protein folding studies, and reveal that following denaturation, many proteins are incapable of fully returning to their native structures on physiological timescales under a standard set of in vitro refolding conditions.
The cellular environment has a number of features that could assist protein folding that are not present during in vitro refolding. These differences include (but are not limited to): (i) the concentrated idiosyncratic environment of the cytosol (or periplasm or membrane); (ii) the effect of molecular chaperones; and (iii) co-translational folding. Whilst the in vitro refolding assays we present in the following cannot distinguish between these scenarios definitively, several trends we discover and discuss are consistent with the notion that co-translational folding plays an essential role in helping cells fold some of their more ‘challenging’ proteins. Hence, this study enables us to propose hypotheses about when exogenous factors/processes might be necessary for efficient protein folding and to explore which biophysical properties support intrinsic refoldability.
APPROACH
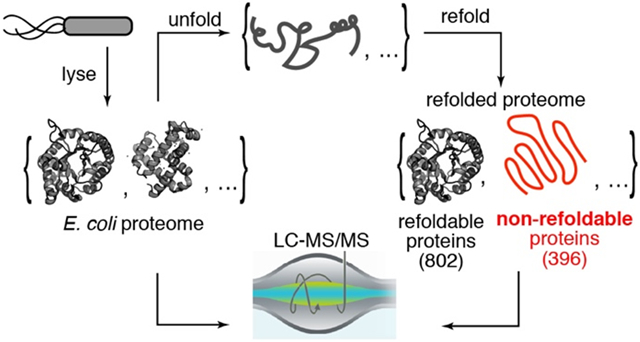
In our experimental design (Fig. 1), E. coli cells (type strain K-12) are grown in a defined media to the end of log phase (OD 0.8), resuspended in a lysis buffer, frozen by immersion into liquid nitrogen, and lysed by cryogenic pulverization (see Materials and Methods). We chose to lyse cells in this way because it retains the vast majority of proteins in their native state – including weakly bound structures13 and even polysome-nascent chain complexes.14 Clarified extracts are then divided so that one portion is retained in its native state, and a separate portion is first unfolded by addition of high concentrations of chemical denaturants (6 M guanidinium chloride (GdmCl)) and then refolded by lowering the denaturant concentration (by dilution or by dialysis). Following a period of time, the structures of the proteins in these complex mixtures are probed by subjecting them to pulse proteolysis with proteinase K (PK). A low level of protease, active for a brief period of time (1 min), ensures that PK cleaves only at exposed or unstructured sites of target proteins, thereby encoding structural information of the protein’s conformation into cleavage sites.15 After quenching PK, proteins are then fully trypsinized, and prepared for analysis by liquid chromatography/tandem mass spectrometry (LC-MS/MS). Half-tryptic peptides (HTPs), in which one cut-site is deemed to arise from trypsin (which only cuts after Arg and Lys) and the other cut-site from PK (which can cut between any two residues), reveal a location where PK cleaved. By quantifying the relative abundance of HTPs arising from the refolded sample compared to those from the native sample, one can assess sites in a protein where the local conformation is different in the refolded form. This method, called limited proteolysis mass spectrometry (LiP-MS) has been instrumental in exploring conformational change,16 thermostability,17 and allosteric binding18 on the proteome-scale, and here we have adapted it to probe protein refolding.
Fig. 1. Limited Proteolysis Mass Spectrometry (LiP-MS) to Interrogate Refolding of the Proteome.

Lysates from E. coli are prepared under native conditions, globally unfolded and refolded. The structures of the refolded proteins are probed by pulse proteolysis with proteinase K (PK) and compared to that of their native forms. Label free quantification (LFQ) of half-tryptic peptides reveals sites across the proteome where local conformation differs between a protein’s native and refolded forms.
RESULTS
Control Studies on Known Refolding Proteins.
A reversibly-refolding protein will have no ‘memory’ of being unfolded, and hence following refolding, the protein will equilibrate to the same ensemble of conformations that it natively populated. Therefore, the profile (and quantity) of HTPs will be identical in the native and refolded samples. On the other hand, we expect aggregated proteins to be more resistant to PK cleavage, whilst soluble misfolded proteins (with less compacted hydrophobic cores) to be more susceptible to PK cleavage (cf. Fig. 1). To critically test these hypotheses, we first performed our LiP-MS method on two purified model proteins that are known refolders: Staphylococcal nuclease (SNase) and Ribonuclease H from Thermus thermophilus (TtRNase H; fig. S1A). SNase refolded by dilution out of 8 M urea has a CD spectrum that superimposes on that of the native protein recombinantly expressed from E. coli (Fig. 2A). Likewise, when refolded and native SNase are probed with LiP-MS, they generate a set of 147 distinct tryptic and half-tryptic peptides (Fig. 2B) that are all present in equal abundances within our cut-offs for significance (abundance ratio greater than 2-fold, P-value by Welch’s t-test < 0.01). Importantly, when the same analysis is conducted on SNase spiked into E. coli lysate (Fig. 2C), the conformations of native and refolded protein are again indistinguishable. We repeated these studies on TtRNase H, and found that its native and refolded forms generated overlapping CD spectra (Fig. 2D), and found no significant differences in their PK cleavage patterns – both in isolation (Fig. 2E; over 176 peptides) and when spiked into E. coli lysate (Fig. 2F; over 147 peptides). These studies show that LiP-MS provides a consistent picture with CD for refolding proteins, although does so with much greater structural resolution (providing independent quantifications at many distinct sites across the protein), and that complete refolding can be observed in a complex mixture. Moreover, when these same experiments are conducted on SNase and TtRNase refolded via slow dialysis from denaturant (rather than rapid dilution), we again found that the native and refolded forms were indistinguishable (fig. S1B, C).
Fig. 2. Refolding of Small Model Proteins.

(A, D) Circular Dichroism (CD) spectrum of (A), Staphylococcal nuclease (SNase) or (D), Ribonuclease H from Thermus thermophilus (TtRNase H), natively expressed from E. coli (green), and following unfolding in 8 M urea and 50-fold dilution (red). Bar chart shows no significant difference in MRE at 222 nm (SNase) or 210 nm (RNase H) (n = 3). (B) Volcano plot comparing peptide abundances from native and refolded SNase (n = 3). Effect sizes reported as ratio of averages, and P-values are based on Welch’s t-test. Red regions designate significance (effect-size > 2, P-value < 0.01). Inset shows large number of points clustered near the origin. The data suggest no significant difference in the structure of native SNase and the conformation produced when it is diluted out of urea. (C) As in B, except SNase was spiked into E. coli lysate, providing a complex background. (E) As in B, except for the purified protein, TtRnaseH. (F) As in C, except for TtRnaseH spiked into E. coli lysate.
Refolding Whole Lysates without Precipitation.
We next planned to carry out a similar experiment in which total soluble cellular extracts are unfolded, refolded, and then compared to a native lysate. However, a limitation that we considered is that many proteins may precipitate during refolding in such a complex medium.19 Proteins that precipitate could hypothetically interfere with the refolding of other proteins in the mixture that would in principle refold were they by themselves. To address this possibility, we sought to identify a set of conditions to perform our refolding assays that could minimize aggregation.
We started with a standard refolding buffer that consists of 20 mM Tris-HCl (pH 8.2), 100 mM NaCl, 2 mM MgCl2, 1 mM DTT, and 0.23 mg mL−1 final protein concentration. Slightly alkaline conditions, moderate ionic strength, reducing equivalents, and low protein concentration are commonly employed in refolding reactions because they decrease aggregation by disfavoring nonspecific associations.20 We confirmed that the elevated pH lowered precipitation levels compared to refolding buffers at neutral pH, and that thermal denaturation followed by slow cooling generated high levels of precipitation compared to denaturation via chaotropes followed by dilution (fig. S2A, B).
Nevertheless, pelleting assays showed that in these complex mixtures, still ~11.5% of the total protein content precipitates after refolding reactions (fig. S2B). We reasoned that ribosomal proteins and RNA, which are highly abundant and charged, might potentially be the most prone to aggregate, and seed aggregation of other proteins.21 Strikingly, when ribosomes are first depleted by ultracentrifugation prior to global unfolding, precipitation levels following unfolding and refolding in the post-ribosomal supernatant decreased to ~2.5% (P < 0.0001 by Tukey’s multiple comparison test following ANOVA), a level that is not significantly different from the background levels of precipitation found from native extracts that were never subject to unfolding (fig. S2B). To deplete ribosomes, we performed ultracentrifugation on clarified lysates at 33,300 rpm (105,000 g) for 90 min in a SW55 Ti rotor (see Methods), a condition that selectively pellets ribosomal particles, but not other larger macromolecules in the E. coli cytoplasm.13 With an additional two-fold dilution of the refolding reactions, precipitation dropped to an undetectable level (−0.1 ± 0.1 %, fig. S2B). Collectively, these studies suggest that the intrinsic refoldability of the proteins in the E. coli proteome could be interrogated without the confounding effect of precipitation under the conditions devised.
Intrinsic Refoldability of the Proteome.
We performed proteome-wide studies (Fig. 1), by unfolding E. coli lysates via incubation in 6 M GdmCl overnight, initiating refolding by rapid 50-fold dilution, and recording refolding kinetics over time by pulsing samples with PK after discrete time increments in biological triplicate. To ascertain structural differences across the refolded proteome, thee refolding reactions from three separate biological replicates were compared to three native lysates (also from separate biological replicates) that were never unfolded but contained the exact same components as the refolded samples in the exact same concentrations (including all cofactors and 0.12 M GdmCl; see Materials and Methods). Hence in our experiments, the native and refolded samples are compositionally identical and differ only in their history. In these studies, we analyzed samples both with and without PK treatment. Comparison of the native and refolded samples without PK treatment enable the determination of overall changes in protein abundance (due to, for example, precipitation during refolding) and are used as normalization factors, so that peptide abundance differences can be attributed solely to changes in susceptibility to PK, and not to protein abundance differences (fig. S2C, D). Consistent with our pelleting studies showing low levels of aggregation, these normalization factors are almost all unity (fig. S2E). Because our conclusions rely heavily on missing data (a non-refolding protein will generate signature peptide fragments that are absent in its native form), we developed a filtering algorithm for label free quantification that can reproducibly quantify peptide abundance over nine orders of magnitude (fig. S3, Text S1).
We focused on a data set in which the proteome was allowed to refold for 2 h because it maximized the overall refolding levels; we speculate that overnight incubations led to increased level of sample degradation (fig. S4C, F, I; see also fig. S10A-B). Inspection of this dataset (qualitatively similar to the other time-points interrogated, fig. S4) reveals that the distribution of abundance ratios for the 28,217 peptides quantified (Fig. 3A, B) follows a trimodal distribution. Half (51.2%) of the peptides were present at similar abundances in the native and refolded samples (∣log2 (Refolded / Native)∣ < 1), whilst 20.7% were more abundant in the refolded samples (log2 (Refolded / Native) > 1) and 28.1% were more abundant in the native samples ((log2 (Refolded / Native) < −1)). Remarkably, a sizable number of peptides (8.0%) were only detected in the three native sample replicates (the cluster of points with log2 (Refolded / Native) centered at ca. −10), and another portion of peptides (4.0%) were only detected in the three refolded sample replicates (the cluster of points with log2 (Refolded / Native) centered at ca. 10). This distribution implies that many regions of E. coli proteins failed to refold, generating signature fragments that are completely absent in the native sample. HTPs (signifying PK-susceptible sites, blue dots) are highly asymmetrically distributed and are 3.2 times more likely to be more abundant in the refolded sample (Fig. 3B; P = 0 by chi-square test). This finding is consistent with the notion that most proteins that fail to refold under our conditions form soluble, partially-disordered entities rather than precipitate, because solid aggregates would be expected to be less susceptible to PK cleavage (see Fig. 1). The median coefficient of variation for the peptide ion abundances across three independent refolding reaction products is 23% (Fig. 3C), demonstrating reproducible refolding outcomes even in these complex protein mixtures.
Fig. 3. Refoldability of the E. coli Proteome.

(A) Volcano plot comparing peptide abundances from 3 native and 3 refolded E. coli lysates normalized for protein abundance after 2 h of refolding. Effect sizes reported as ratio of averages, and P-values are based on Welch’s t-test. Replicates are from separate bacterial cultures. “All or nothing” peptides form the two lobes centered at ±10 of the abscissa, and to be counted were detected in all 3 replicates of one sample-type (refolded or native) and zero out of 3 of the other. (B) Histogram of abundance ratios for half-tryptic and full-tryptic peptides. Half-tryptic peptides (denoting sites that are susceptible to Proteinase K) are enriched in the refolded lysate. (C) Histogram of coefficients of variation for peptide abundances detected in 3 independent proteome-wide refolding reactions, after 2 h of refolding. (D) Overall number of refolding proteins out of 1198 E. coli proteins after 2 h of refolding. 281 proteins only furnished one peptide and hence too little data to make an assessment.
We define a protein as ‘non-refoldable’ if we can map two or more peptides to it with significantly different abundances in the refolded sample, though our primary findings are not sensitive to this cut-off (see Data S1). Proteins with only one peptide mapped to it are considered to have too little data to make an assessment. It is important to point out that by this definition, some proteins will be labeled non-refoldable even if some regions of that protein do refold; hence, our definition of non-refoldability is a stringent one that implies the existence of structural differences with respect to the ensemble of conformations populated by the native protein. Generally speaking, our experiment cannot prove a protein to be refoldable, since unlike in studies on purified SNase and TtRNase H, we do not have full peptide coverage of every protein. Nevertheless, we shall assume a protein to be refoldable as a null hypothesis, unless proven otherwise by the data.
In total, 28,217 peptides (from 1,479 proteins) passed our stringent filters and were used for analysis. We chose to focus only on the proteins for which two or more peptide groups were quantified, a cohort of 1,198 proteins that represents ~53% of the proteins (~68% of cytosolic proteins) that E. coli expresses during log phase in rich media.22 This subset of proteins is enriched for more abundant proteins and is highly de-enriched for membrane proteins (which were removed during clarification of the native lysate), but is otherwise representative of the E. coli proteome in other respects (fig. S5, Text S3). Of these 1,198 proteins, 396 (33%) were found to be non-refoldable after 2 h, under our conditions (Fig. 3D).
Refoldability Correlates with Subunit Composition.
We next sought to identify features of proteins that correlate with non-refoldability. Monomeric proteins had the highest propensity to refold (75%), though intriguingly refoldability evinced a V-like curve with respect to subunit count, with trimers being the least refoldable (48%), and hexamers and larger assemblies being more refoldable (65%; P = 2 × 10⁻⁶ by chi-square test; Fig. 4A). Natural protein folding on a polysome provides a means to couple folding and assembly, hence operon structure could facilitate biogenesis of some multi-subunit protein assemblies in a manner not recapitulated by in vitro refolding.14, 23-26
Fig. 4. Characteristics of (Non-)Refolding Proteins.

(A) Proteins that are part of complexes with multiple subunits – but especially trimers and tetramers – are less refoldable than monomeric proteins (P = 2 × 10⁻⁶ by chi-square test). Percentages denote percent of proteins that are refoldable (red, more non-refolding than average; black, more refolding than average; gray, average level of refoldability). (B) Structure of the 70S ribosome, showing the distribution of non-refolding ribosomal proteins, which are highly enriched on the small-subunit (15.6-fold, P = 4 × 10⁻⁵ by Fisher’s exact test). (C) Proteins with many domains are more non-refoldable than proteins with zero or one domain (P = 2 × 10⁻⁷ by chi-square test). (D) Contingency tables showing that proteins with split domain architecture (i.e., in which one domain is non-contiguous with respect to sequence) are more non-refoldable than proteins in which domains are organized in a tail-to-head (T-to-H) manner. (E) X-ray structure of FabD (PDB: 2G2O), a non-refoldable 2-domain protein in which a FabD-like domain is interrupted with a ferredoxin-like domain. Typical for this class, the interrupted domain is non-refoldable whilst the intervening domain is refoldable. (F) 28 SCOP fold-types, ranked in order of refoldability, and colored by their SCOP class (see legend). Anticodon binding domains of class I aminoacyl-tRNA synthetase (aaRS) domains and class II aaRS domains are the least refoldable (33%, 38%), whilst some fold-types are 100% refoldable from the attested examples (P = 2 × 10⁻⁶ by chi-square test). Several folds discussed in the text are labeled with their refolding frequency. (G) Overall, proteins that host cofactors are less refoldable than apo-proteins (P = 2 × 10⁻¹⁰ by chi-square test), though the effect is non-uniform across cofactor types. Iron-sulfur cluster-containing proteins and heme proteins are more refoldable than apo-proteins, whilst, Fe-, Mg-, Mn-, and Zn- metalloproteins are less refoldable.
One of the most intricate assemblies in E. coli is the ribosome, whose small subunit (SSU) has 21 unique protein components, and whose large subunit (LSU) has 33. Though we remove the majority of the ribosomes during our sample preparation, the small residual amounts of ribosome in our sample were still abundant enough to admit 1033 peptides over 46 rProteins (19 SSU, 27 LSU; Fig. 4B). Strikingly, there were 11 non-refoldable proteins on the SSU (primarily around the head and neck) and only one on the LSU (uL6; P = 4 × 10⁻⁵ by Fisher’s exact test), suggesting that unlike the SSU, the LSU can self-assemble with relative ease. This result is highly dependent on ribosome concentration, as previous experiments in which ribosomes were not depleted via ultracentrifugation resulted in high levels of aggregation of ribosomal proteins (see Data S4).
Refoldability Correlates with Domains and Folds.
Using the SCOP database53,54 (Structural Classification of Proteins), we identified regions within proteins that could be assigned to structural domains. With this metric, we observed a monotonic trend that proteins with more domains refold less efficiently (Fig. 4C; P = 2 × 10⁻⁷ by chi-square test). Proteins with zero annotated domains (either because they’re disordered or because they don’t align with any of the superfamilies in SCOP) are highly refoldable (87%), 2.5 times the frequency of the subset of E. coli with six or seven domains. These findings are consistent with the view that the vectorial synthesis of translation helps decouple domains into independently folding units, 27-29 which could prevent non-native inter-domain interactions that might form during refolding of an unfolded full-length protein. Strikingly, proteins with split domain topology were consistently worse refolders than proteins in which domains are organized in a head-to-tail manner, a trend which we observed for domain counts from one to four (Fig. 4D, E; fig. S6A). For instance, among 3-domain proteins, only 37% with split domain topology refold, roughly half of the refolding frequency of the 3-domain proteins (68%) with head-to-tail domain organization (P = 0.03 by Fisher’s exact test). Indeed, if we only consider the 1- and 2-domain proteins with a head-to-tail organization, they refold at a frequency (85%, 80% respectively) that is similar to proteins with zero annotated domains. Collectively, these data suggest that proteins with split domain topology are more intrinsically challenging to refold, and suggest a class of proteins where exogenous factors (e.g., chaperones) or processes (e.g., translation) may be most critical in their biogenesis.
We next assigned peptides to individual domains (based on the location of the peptides within their parent proteins and the residue ranges for annotated domains), and assigned these domains into fold-types in the SCOP hierarchy. This analysis revealed folds with strikingly different levels of intrinsic refoldability (Fig. 4F, P-value = 2 × 10⁻⁶ by chi-square test; Note that in SCOP folds correspond to a set of structurally-related superfamilies). Satisfyingly, fold-types exemplified by model proteins are typically efficient refolders. For instance, SH3-like domains (10 examples) and Ubiquitin-like domains (9 examples)31 refold with 100% frequency (though there are fewer examples of these fold-types). Among the more highly-represented fold-types in the E. coli proteome, the OB-fold (40 examples) and the 3-helical bundle (29 examples) were the most refoldable (80%, 86% respectively), and the Rossman fold (47 examples) was among the least refoldable (49%). We should point out that our data do not support a global trend between refoldability and SCOP class (i.e., all-α, all-β, α/β, and α+β); for instance, highly-refolding folds include an all-α (3-helical bundle), an all-β (OB-fold), and an α/β (SAM-dependent methyltransferase). Intriguingly, fold-types that are strongly associated with domains within aminoacyl-tRNA synthetases (including the class II aaRS-fold, the class I anticodon-binding domain, and the α-hydrolase-like fold) were among the least intrinsically refoldable fold-types (38%, 33%, and 55% respectively) amongst the fold-types for which we have data (Data S2).
Our domain-level analysis demonstrates evidence for ‘coupling’ between the refolding outcomes of distinct domains in a given protein. For instance, in a two-domain protein, if one domain does not refold, the second domain is significantly more likely to also not refold (fig. S6B-C, P = 1 × 10⁻⁷ by chi-square test). This effect explains why two-domain proteins refold at a higher frequency than the square of the average refolding frequency of a domain. Finally, we note that non-refoldable fold-types are not any larger (or smaller) than refoldable fold-types (fig. S6D), suggesting that these trends reflect underlying topological differences in fold-types rather than a simple size-effect.
Refoldability Correlates with Cofactors.
Proteins that host cofactors were on the whole poorer refolders than those without (53% vs. 73%, P-value = 2 × 10⁻¹⁰ by Fisher’s exact test, Fig. 4G), though this finding was not universal. For instance, cofactors that are covalently attached to their host protein (e.g., iron-sulfur clusters and heme) tend to result in holo-proteins that are more refoldable than average (85% for [4Fe-4S], 89% for [2Fe-2S], 88% for heme), possibly because here the cofactor could act like a ‘folding nucleus’ that facilitates refolding of the attached polypeptide.32 These observations are intriguing in light of hypotheses that suggest an ancient provenance of iron-sulfur proteins and their importance in primitive metabolism.33, 34 On the other hand, proteins wherein cofactors are not covalently attached (such as metal ions, TPP, PLP, and FAD) all tend to be associated with lower levels of refoldability. Prima facie, this effect might be explained by the fact that in our refolding reactions, cellular cofactors will be present at concentrations ~1000-fold lower than in the cellular environment (which would make it entropically more uphill for cofactor-containing proteins to reassociate with their cognate cofactors). However, refoldability trends cannot be purely attributed to a concentration effect. For instance, amongst flavoproteins, we found that FMN-proteins are better refolders than FAD-proteins (80% vs. 55%), even though both of these cofactors would be present at low concentrations during refolding.
Correcting for Bias in Sequence Coverage.
We found that membrane-associated proteins, proteins with higher isoelectric points (pI), and proteins with low molecular weight all tend to be more refoldable (fig. S7A-C). However, the observation that proteins of large molecular weight refold poorly (fig. S7C) is confounded by the fact that, on average, we also quantify more peptides for massive proteins, potentially introducing a bias that makes it ‘easier’ to detect a significant structural difference (fig. S7I) within them. Importantly, this bias does not affect the trends we noted for cellular location, pI, subunit composition, cofactors, and fold-type (fig. S7G-H, fig. S8D, F, H, Text S2). We reasoned that another way we could check for this bias is by lumping together all the peptides associated with a given attribute (without regard to which specific protein they came from) allowing us to probe whether particular attributes (e.g., multimers) are intrinsically associated with higher frequencies of significant structural differences. Importantly, when we perform this ‘peptide-level’ analysis, this bias vanishes and all the trends we observed are recapitulated and statistically significant (fig. S7D-F, fig. S8A-C, G; P-values by chi-square tests range from 10−3 to 10−24). For instance, proteins with no annotated domains generate significant peptides at half the frequency of proteins with five annotated domains (fig. S8B), consistent with them refolding at roughly double the frequency.
Finally, to test whether the trends we observed were redundant, we performed a systematic cross-correlation analysis amongst the categories described (fig. S9). On the whole, we did find that certain protein categories were significantly co-enriched with other features, although none of these analyses would suggest a trend could be wholly attributed to a confounding variable. For instance, we found that tetramers were significantly more likely to have higher molecular weights than proteins with other subunit counts, which could partially explain their lower levels of refoldability (fig. S9A), though trimers tended to have some of the lowest molecular weights and were the least refoldable. Hence molecular weight does not generally explain the relationship between number of subunits and refoldability. Similarly, whereas 3-helical bundles were amongst the most refoldable domains and on average the lowest molecular weight (fig. S9D), SAM methyltransferase domains were even more refoldable and had one of the highest average molecular weights.
In summary, the enrichment of non-refolders in one group (e.g., trimers) cannot be attributed to a confounding property shared by members of that group
Preponderance of “Complete” Non-refolders.
During refolding, it is possible that some proteins partition toward several distinct minima in their energy landscape, with a fraction of the molecules successfully returning to the region associated with the native state, and another fraction ultimately becoming trapped in distinct misfolded state(s).35, 36 In such a scenario where the refolding yield is less than unity, the refolded sample would contain a mixture of native and non-native conformations. HTPs associated with the native state of that protein would be expected to be present at lower levels in the refolded sample, but nevertheless still be present (cf. Fig. 1). On the other hand, regions of a protein that completely fail to refold will would generate HTPs that are absent in the native sample, resulting in very large abundance ratios (and the ‘side lobes’ to the volcano plot in Fig. 3A). We can therefore divide our significant peptides into a subset that were not detected in one of the sample-types (so-called ‘all-or-nothing’ peptides which represent regions that completely do not refold), and a second set where the peptide was detectable in both native and refolded samples (which may represent regions that are present in a partially native form in the refolded ensemble). By this definition, 36% of the significant peptides in our dataset are all-or-nothing peptides, and 50% of the non-refoldable proteins have at least two regions that are completely non-refoldable (making them ‘complete non-refolders’; fig. S10A, Data S1).
The more domains a protein has, the more likely it is for it to be a complete non-refolder (P-value = 3 × 10⁻⁴ by chi-square test). For instance, non-refolding proteins with zero annotated domains are complete non-refolders only 17% of the time, but 100% of the non-refolding 5-domain proteins are complete non-refolders (fig. S10C, E). Likewise, proteins of greater molecular weight were significantly more likely to be complete non-refolders, with 85% of non-refolding proteins weighing more than 100 kDa completely non-refolding (fig. S10D).
Refolding Kinetics Across the Proteome.
Most proteins that can refold do so within the first minute (Fig. 5A, fig. S4G-J, Data S3). This is consistent with the corpus of classical protein folding studies, which typically record folding transitions on the ms–s timescales.37,38 Nevertheless, we identified 125 ‘slow’ refolders whose structural dynamics can be probed on the timescale of this experiment (fig. S11C), defined as requiring more than 1 min to refold (i.e., ‘non-refoldable’ in the 1-min refolding experiment but ‘refoldable’ in the 2-h refolding experiment). One example is carbonic anhydrase (Can), which is refoldable, however there are a cluster of sites near the zinc-binding pocket that remain non-native after 1 min, but return to native within 2 h (Fig. 5B). This finding is consistent with previous work that showed a human ortholog of carbonic anhydrase regains its catalytic activity slowly after denaturation.39 Overall, the refolding proteome was more susceptible to PK after 1 minute of refolding, and as time progressed up to 2 h, it became more native-like (fig. S11A-B).
Fig. 5. Proteome Refolding Kinetics.

(A) From 1 min to 2 h, the number of refolding proteins increases. (B) X-ray structure of carbonic anhydrase (PDB: 1T75) illustrating the proximity to Zn cations of sites that are distinct from the native structure after 1 min but return to native-like after 2 h. At 1 minute of refolding, carbonic anhydrase admitted 6 characteristic peptides, of which two were not detected in the native sample (“all-or-nothing” peptides), shown in red. (C, D, E) Frequency bars showing the fraction of the proteins of a given classification that are refolders (refoldable at 1 min and 2 h), slow refolders (non-refoldable at 1 min, refoldable at 2 h; 125 proteins, 16.8%), or fold losers (refoldable at 1 min, non-refoldable at 2 h; 15 examples, 2.0%). Note that these analyses only cover proteins that were identified at both time points with two more peptides each, and all P-values are based on chi-square tests. (C) Hexamers are significantly enriched in the population of slow refolders (2.3-fold), but not other subunit-counts. (D) Proteins with >5 domains are significantly enriched in the population of slow refolders (6-fold), but not proteins with other domain counts. (E) Many cofactor-containing proteins are significantly enriched in the population of slow refolders. (F) Frequency bars showing the fraction of proteins divided by cofactors that are refolders (refoldable at 5 min and 2 h), very slow refolders (non-refoldable at 5 min, refoldable at 2 h; 71 proteins, 9.4%), or fold losers (refoldable at 5min, non-refoldable at 2 h; 22 examples, 2.9%). Metalloproteins are significantly enriched in the population of very slow refolders. (G) Frequency bars showing the fraction of domains for various SCOP folds that are refolders, slow refolders, or fold losers. Some folds have few slow refolders, such as 3-helical bundles. TIM barrels, class II aaRS domains, and PLP-dependent transferase domains are enriched for slow refolders. (H) TIM barrels are disproportionately represented amongst very slow refolding domains (require more than 5 min).
The 125 slow refolders reflected 16.8% of the refoldable proteins that could be confidently assessed across the time series, but is enriched with proteins with particular features (Fig. 5C-F, Data S3). Compared to monomers, most multimers are not enriched in the slower refolding camp (Fig. 5C). On the other hand, hexameric assemblies are 2.3-fold enriched amongst slow refolders (P = 0.005 by chi-square test), and show a large uptick in refoldability from 1 min to 5 min (fig. S11D), suggesting that large assemblies might require more time to accrete all their constituents. Similarly, one-, two-, and three-domain proteins refold slowly at similar frequencies, but proteins with more than five domains are very likely to refold slowly (Fig. 5D, fig. S11E) – in fact all such proteins that refold at all, do.
Some of the more striking kinetic trends were found in relation to cofactors, in that metalloproteins are significantly slower refolders than non-metalloproteins (Fig. 5E-F, fig. S11F). Although iron-sulfur cluster-containing proteins refold at high levels, they are also 2.3-fold enriched amongst slow refolders. Iron-proteins, manganese-proteins, and zinc-proteins all tend to refold slowly, and have the further distinction of being highly enriched amongst a smaller cohort of ‘very slow refolders’ (Fig. 5F; 7.1-fold, 3.1-fold, and 3.6-fold respectively), defined as requiring more than 5 min to refold. This effect can probably be attributed to the low Fe2+, Mn2+, and Zn2+ concentrations in the buffer. The refolding kinetics of magnesium-proteins were more similar to the overall trend, which is reasonable given that Mg2+ was supplemented in the refolding buffer. After 2 h, all four of these types of metalloproteins refold with similar frequencies (fig. S11F). Collectively, these observations suggest that non-magnesium metalloproteins in the E. coli proteome are adept at selecting the appropriate metal from complex mixtures with high background levels of magnesium (because refolding is delayed until the protein encounters the correct metal), and that low metal concentrations decelerate metalloprotein refolding but do not prevent it.
We found distinct kinetic behaviors across different fold-types (Fig. 5G-H, fig. S11G). 3-helical bundles and Rossmann folds are fast-refolding fold-types that nearly always complete refolding within one minute. OB-folds and ferredoxin domains have numerous slow refolders within their ranks and gradually increase in refoldability over time, whilst TIM barrels and PLP-dependent transferase domains tend to refold slowly. TIM barrels are highly enriched (3.2-fold, P = 9 × 10⁻⁵ by chi-square test) amongst the smaller number of very slow refolding domains that require more than 5 min to refold (Fig. 5H). The observation that TIM barrels fold slowly intrinsically is notable given the previous observation that this fold-type is more frequently found as a substrate for chaperonins.40
Finally, we observed some intriguing relationships between refolding kinetics and isoelectric point (pI, fig. S11H-I). Proteins with pI between 7–9 have high refoldability at early times and show the shallowest time-dependence. However, proteins with pI less than 6, and greater than 10 have lower refoldability at early times and show steeper time dependences. These trends can be explained with a simple physical model. Proteins with pI close to 8 will be nearly neutrally charged in our experiments (and in the E. coli cytosol) and hence there would be less internal charge repulsion within the polypeptide chain. On the other hand, proteins with low pI are polyanions and those with high pI are polycations; hence, inter-residue electrostatic repulsion within these chains could cause additional friction slowing down peptide compaction. As expected, our set of 125 slow refolders is de-enriched with proteins with pI between 7–8 (3.7-fold, P = 0.05 by chi-square test; fig. S11I).
DISCUSSION
In our view, the existence of many proteins in the E. coli proteome that cannot intrinsically refold to their native states in vitro within 2 h can most likely be explained in one of two ways: either (i) native states of these proteins are not global thermodynamic minima, and their biogenesis is dependent on irreversible processes that ‘seed’ them into the native region of their energy landscapes where they become trapped; or (ii) native states of these proteins are thermodynamic minima that are challenging to access due to large barriers or a rough landscape. If it is the latter, and assuming that E. coli proteins can fold on the sub-h timescale in vivo (which one might assume would be necessary for them to be physiologically relevant), then chaperones would be required to serve as foldases to facilitate access to their native states.
To ascertain the relationship between chaperone usage and intrinsic refoldability, we categorized the proteins defined in our study into chaperonin class (Fig. 6A). Hartl and coworkers classified 208 E. coli proteins as class III on the basis that they are highly enriched in a fraction of proteins that co-precipitate with the GroEL/GroES chaperonin.40 A follow up study by Taguchi and coworkers41 determined that only a subset of class III proteins required chaperonin to remain soluble in the E. coli cytosol (and were renamed class IV); the previously-deemed class III proteins that remain soluble without chaperonin were labeled class III−. In consonance with the Taguchi classification system, the vast majority (87%) of class III− proteins are refoldable, whereas only half (54%) of the class IV proteins are refoldable. We reason that class IV proteins would be refoldable (class IV-R) if the primary role of the chaperonin is to prevent that protein from aggregating in the crowded cellular environment, because in our assays this function is not necessary (Fig. 1, fig. S2B). Consistent with this hypothesis, we also found that the refoldable class IV proteins tend to refold slowly, which could very well make them more prone to aggregate in more forbidding environments (Fig. 6A-B, fig. S12B). On the other hand, class IV proteins that are non-refoldable (class IV-NR) likely need a chaperone to serve as a foldase to smooth out their energy landscapes (Fig. 6B).
Fig. 6. Relationship between Chaperonins and Refoldability.

(A) Class I proteins (those which are de-enriched in the fraction of proteins that co-precipitate with GroEL/GroES) are highly non-refoldable, whereas class III− proteins (those which are enriched in the fraction of proteins that co-precipitate with GroEL/GroES, but do not require it to stay soluble in the cytosol) are highly refoldable (4.6-fold more; P = 2 × 10⁻⁶ by chi-square test). Class IV proteins (those which are enriched in the fraction of proteins that co-precipitate with GroEL/GroES, and require it to stay soluble in the cytosol) are split half-half; the portion which is refoldable is 3.1-fold enriched for slow-refolders (53% vs. 17% overall; P = 2 × 10⁻⁴ by chi-square test). (B) Refoldable class IV proteins (class IV-R) are those which can intrinsically refold under low-aggregation conditions but would require chaperonin to act as a holdase to prevent their aggregation in the cytosol. Non-refoldable class IV proteins (class IV-NR) use chaperonins to smooth their free energy landscape (as a foldase), and therefore are unable to refold intrinsically.
More intriguingly, we found that class I proteins – which are de-enriched in the fraction of proteins that co-precipitate with GroEL/GroES – were among the least refoldable proteins (19%). This difference was highly significant, both statistically (P-value = 2 × 10⁻⁶ by chi-square test; 3 × 10⁻¹⁹ at the peptide level (fig. S12A)) and by effect-size (4.6-fold, relative to class III−). A potential explanation for this finding is that perhaps these proteins do not associate with chaperonin because they fold co-translationally (GroEL/GroES is principally a post-translational chaperone42), which would then also explain why they do not refold in our experiment in which translation is absent. In support of this view, a separate study undertaken by Niwa et al. which subjected each E. coli protein individually to in vitro translation found that after folding on the ribosome, class I proteins are more soluble than class II or class III proteins. 43 This, in combination with the observation that class I proteins are half as likely to be monomeric (27% monomeric vs. 54% overall; P-value = 0.002 by Fisher’s exact test) and more likely to be multidomain (56% vs. 33% overall; P-value = 0.007 by Fisher’s exact test), is consistent with the hypothesis that class I proteins are more dependent on translation to assemble.23-25 Though class I proteins have traditionally been viewed as efficient intrinsic refolders, we note that even prototypical class I proteins such as enolase and glyceraldehyde-3-phosphate dehydrogenase only recover ca. 50% of their activity upon unassisted refolding,40,44 which would be consistent with either only a fraction of the population successfully returning to its native state, or the protein ‘refolding’ to a near-native-like state with diminished activity. Either of these outcomes would be considered as non-refolding by our definition.
Alpha-lytic protease is the most characterized example of a kinetically-trapped metastable native state.12 When fused to its pro-domain, it folds to its native conformation under thermodynamic control. Following the irreversible cleavage of its pro-domain, the native state is no longer thermodynamically stable but the barrier to exit the native state becomes high, effectively trapping the protein in its native form. Although pro-domains are not common across the proteome, alpha-lytic protease illustrates that coupling folding to an irreversible process can enable efficient folding to a metastable native state that is not refoldable. Because translation is replete with irreversible steps at each cycle of elongation, it could provide proteins with a more general strategy to arrive at metastable (and non-refoldable) native states. Whether (and why) some non-refoldable proteins are obligate co-translational folders remain important questions for further study. However, some preliminary hypotheses might be drawn by comparing our study to Niwa et al.’s in vitro translation solubility experiments.43 For instance, both studies found OB-folds and flavodoxins to be efficient folders, suggesting that these topologies can form independently of chaperones and translation (cf. Fig. 4F). On the other hand, thioredoxin folds and phosphorylase/hydrolase-like domains showed low aggregation after in vitro translation, but were generally non-refoldable, suggesting that these topologies may be more reliant on translation to fold.
To conclude, we report that many E. coli proteins cannot fully return to their native states efficiently from a fully-denatured state unassisted, a cohort enriched with multimers, multidomain proteins, and certain fold-types. These findings are consistent with several reports documenting non-refoldability of a few multidomain proteins in purified form based on fluorescence, CD, and activity.45,46 Rather than view this phenomenon as pathological, we suggest that non-refoldability be construed as a starting point to ask which cellular factors and/or processes are needed for certain proteins’ biogenesis. We speculate that these non-refoldable proteins’ native states are either metastable (which would suggest that their formation is coupled to irreversible processes) or that high kinetic barriers render refolding to their global minima infeasible under physiological timescales without chaperones. Assessing the structural features of the soluble misfolded products following (partially) unsuccessful refolding, and developing a fully predictive model of which proteins are non-refoldable represent important milestones for future research. Nevertheless, by employing a mass spectrometry-based proteomics approach, we have greatly expanded the number of proteins whose refolding has been interrogated, and have shown that many proteins do not follow the same paradigm as most extensively-studied model systems.47
METHODS
Culture and Lysis of K12.
E. coli cells, strain K12 (NEB ER2738) from saturated overnight cultures, were inoculated in 3 × 100 mL (biological triplicates) of MOPS EZ Rich Defined Media (M2105 Teknova) in 250 mL flasks at a starting OD600 of 0.05. Cells were grown at 37 °C with agitation (220 rpm) to a final OD600 of 0.8, at which point cells were collected by centrifugation at 4000 g for 15 mins at 4°C. Supernatants were removed and cell pellets were stored overnight at −20°C until further use.
Cell pellets were resuspended in 2.0 mL of native buffer (20 mM Tris pH 8.2 or 20 mM HEPES pH 7.0, 100 mM NaCl, 2 mM MgCl2). Resuspended cells were flash frozen by slow drip over liquid nitrogen and then cryogenically pulverized with a freezer mill (SPEX Sample Prep) over 8 cycles consisting of 1 min grind, 9 Hz and 1 min cool. Pulverized lysates were transferred to a 50 mL centrifuge tube and thawed at room temperature for 20 mins. Cellular lysates were then transferred to a fresh 1.5 mL microfuge tube and clarified at 16000 g for 15 mins at 4°C to remove insoluble cell debris. In preparations in which ribosome particles were depleted, clarified lysates were then transferred to 3 mL konical tubes and ultracentrifuged at 33,300 RPM at 4°C for 90 minutes without any sucrose cushion using a SW55 Ti rotor.13 These supernatants were transferred to fresh microfuge tubes and protein concentrations of the clarified cellular lysates were determined by using the bicinchoninic acid assay (Rapid Gold BCA Assay, Pierce) in a microtiter plate format with a plate reader (Molecular Devices iD3). Using the results from the BCA Assay, the clarified cellular lysates (whether ribosome-depleted or not) were normalized to a protein concentration of 3.3 mg mL−1 using the same lysis buffer (20 mM Tris pH 8.2 or 20 mM HEPES pH 7.0, 100 mM NaCl, 2 mM MgCl2). Typically 25% of the total protein content is removed during ribosome depletion, hence +ribosome samples are typically diluted with 25% more lysis buffer to reach 3.3 mg mL−1. This was the starting point for most downstream workflows vide infra.
Precipitation Studies.
For the study of protein aggregation, normalized lysates were prepared as described above and carried through various conditions accordingly. The native samples were prepared by diluting lysate with native dilution buffer (either 20 mM Tris pH 8.2 or 20 mM HEPES pH 7.0, 100 mM NaCl, 2 mM MgCl2, 1.08 mM DTT, 130 mM GdmCl) to a final protein concentration of 0.23 mg mL−1. Following this dilution, the final concentrations: are 20 mM buffer, 100 mM NaCl, 2 mM MgCl2, 1 mM DTT, 120 mM GdmCl. These samples are then incubated overnight at room temperature. The samples which were refolded by dilution from denaturant were prepared as follows: 600 μL of lysates, solid denaturant (100 mg guanidium chloride (GdmCl)), and 2.4 μL of a freshly prepared 700 mM dithiothreitol (DTT) stock solution were added to a fresh 1.5 mL microfuge tube and solvent was removed using a vacufuge plus (Eppendorf) to a final volume of 170 μL, such that the final concentrations of all components were: 11.6 mg mL−1 protein, 6 M GdmCl, 350 mM NaCl, 7 mM MgCl2, 10 mM DTT. Denatured samples were left to unfold at room temperature overnight. Unfolded lysates were then diluted 50× or 100× with refolding dilution buffer (19 mM Tris pH 8.2 or 19 mM HEPES pH 7.0, 95 mM NaCl, 1.9 mM MgCl2, 0.82 mM DTT) and incubated for 2 h at room temperature. After these procedures, the protein concentration will be 0.23 mg mL−1 or 0.115 mg mL−1. All samples (either native or refolded) contained 138 μg total protein.
The samples which were refolded by slow cooling from thermal denaturation were prepared as follows: 14 μL of lysates were diluted with native dilution buffer to a final protein concentration of 0.23 mg mL−1 or 0.023 mg mL−1 and distributed 100 μL per PCR tube. Samples were heated to 90°C over 1 h and then slowly cooled overnight to 4 °C (−1°C per 20 minutes) using a Thermocycler (ProFlex PCR System, ThermoFisher). Refolded samples were resuspended through pipetting and combined into a fresh 1.5 mL microfuge tube.
Precipitated protein was collected by centrifugation at 16000 g for 15 mins at 4°C from native and refolded samples. The supernatant was removed by careful pipetting so as not to disturb the protein pellet. The pellet was then resuspended in 50 μL of 8 M urea and the protein concentration was determined by BCA Assay as described above. The protein concentrations were converted to amounts using the resuspension volume (50 μL) and then converted to fractional precipitation by dividing by the amount of protein initially used in the refolding reaction (138 μg protein). The data are reported as a means ± standard deviations from the biological triplicates which were differentiated at the inoculation stage. Statistical tests were carried out using ANOVA with follow-up pairwise tests using Tukey’s correction for multiple hypothesis testing, as implemented in Prism 9 (Graphpad). The “precipitation” measured for the native samples were treated as the background level of the measurement because there should not be any precipitated protein in them.
Single Protein Experiments (SNase and RNase H).
For the study of single protein refolding, wild-type staphylococcal nuclease (SNase) and wild-type ribonuclease H from Thermus thermophilus (TtRNase H) were expressed and purified as described previously.48,49 and were provided as generous gifts from the García-Moreno Lab at Johns Hopkins University as 10 mg mL−1 frozen stocks in water. The native samples were prepared by diluting the frozen protein stock (SNase or TtRNase H) 450× with a 49:1 mixture of native buffer (20 mM Tris pH 8.2, 100 mM NaCl, 2 mM MgCl2, 1 mM DTT) and unfolding buffer (20 mM Tris pH 8.2, 100 mM NaCl, 2 mM MgCl2, 9 M Urea, 10 mM DTT). The native samples were then concentrated to a final protein concentration of 0.23 mg mL−1 using 3K MWC Amicon® Ultra-15 Centrifugal Filter Units (Millipore Sigma). For each protein, we generated a native sample in technical triplicates (see fig. S1A for workflow).
The pure protein samples were unfolded by diluting frozen protein stocks (SNase or TtRNaseH) 9× with unfolding buffer (final protein concentration was 1.1 mg mL−1 and final concentration of urea was 8 M) and incubating for 2 h at room temperature. Unfolded proteins were then refolded by either dilution or dialysis. To prepare the samples that were refolded by dilution, unfolded proteins were diluted 50× with native buffer and incubated at room temperature for 2 h to allow for the protein to refold. The samples were then concentrated to a final protein concentration of 0.23 mg mL−1 using Amicon Filters according to manufacturer protocol. These two samples were further analyzed by circular dichroism. To prepare the samples that were refolded by dialysis, 115 μL unfolded proteins were diluted with 300 μL of unfolding buffer such that the final concentration of all components were 0.3 mg mL−1 protein, 8 M Urea, 10 mM DTT. Unfolded proteins were then transferred to a wetted 3.5K MWCO dialysis cassette according to manufacturer protocol (Slyde-A-Lyzer G2, ThermoFisher) and refolded overnight in native buffer at 4°C with gentle stirring. After anticipated swelling of the dialysate, the protein concentration is expected to be 0.23 mg mL−1.
Circular Dichroism (CD) studies of protein folding were conducted as follows: protein concentration of each refolded sample was determined by measuring the absorbance at 280 nm and calculating the protein concentration using the extinction coefficients of the proteins (15,930 M−1 cm−1 for SNase and 30,480 M−1 cm−1 for TtRNaseH). CD spectra of refolded proteins were obtained at 25°C using a CD Spectrometer (Aviv 420) over a spectral range of 198 nm to 250 nm at a scanning rate of 1 nm / 3 sec in a 1-mm pathlength quartz cuvette. Molar Residue Ellipticity (MRE) was calculated for the minima of each of the refolded proteins (222 nm for SNase and 215 nm for TtRNaseH) using the protein concentration and the number of amino acids in each protein.
200 μL each of the refolded (dilution or dialysis) samples were divided into two different aliquots, in which one was spiked with 14.5 μL concentrated clarified E.coli lysate (~3.3 mg mL−1) to a final concentration of 0.23 mg mL−1 or not. The samples were then incubated with proteinase K (PK) from Tritirachium album (Sigma Aldrich).
2 μL of a PK stock (prepared as a 0.25 mg mL−1 PK in a 1:1 mixture of native buffer and 20% glycerol, stored at −20°C and thawed at most only once) were added to a fresh 1.5 mL microfuge tube. 200 μL of the native or refolded proteins (pure or spiked with lysate) were then added to the same microfuge tube and rapidly mixed by pipetting (enzyme: substrate ratio of 1:100 on a weight basis). Samples were incubated for exactly 1 min in a water bath preequilibrated at 25°C before transferring them to a mineral oil bath preequilibrated at 100°C and incubating them for 5 mins to quench PK activity. Boiled samples were then transferred to a fresh 2 mL microfuge tube containing 200 mg urea and 85 μL of native buffer such that the final urea concentration was 8 M and the final volume was 415 μL.
All protein samples were prepared for mass spectrometry as follows: 6 μL of a freshly prepared 700 mM stock of DTT were added to the sample containing microfuge tube to a final concentration of 10 mM and incubated at 37°C for 30 minutes at 700 rpm on a thermomixer to reduce cysteine residues. 24 μL of a freshly prepared 700 mM stock of iodoacetamide (IAA) were then added to a final concentration of 40 mM and incubated at room temperature in the dark for 45 minutes to alkylate reduced cysteine residues. After alkylation of cysteines, 1215 μL of 100 mM ammonium bicarbonate (pH 8) were added to the samples to dilute the urea to a final concentration of 2 M. 1 μL of a 1 mg mL−1 stock of Trypsin (Pierce) was added to the samples (to a final enzyme:substrate ratio of 1:50 on a weight basis) and incubated overnight at 25°C at 700 rpm.
Peptides were desalted with Sep-Pak C18 1 cc Vac Cartridges (Waters) over a vacuum manifold. Tryptic digests were first acidified by addition of 16.6 μL trifluoroacetic acid (TFA, Acros) to a final concentration of 1% (vol/vol). Cartridges were first conditioned (1 mL 80% ACN, 0.5% TFA) and equilibrated (4 × 1 mL 0.5% TFA), before loading the sample slowly under a diminished vacuum (ca. 1 mL/min). The columns were then washed (4 × 1 mL 0.5% TFA), and peptides eluted by addition of 1 mL elution buffer (80% ACN, 0.5% TFA). During elution, vacuum cartridges were suspended above 15 mL conical tubes, placed in a swing-bucket rotor (Eppendorf 5910R), and spun for 3 min at 350 g. Eluted peptides were transferred from Falcon tubes back into microfuge tubes and dried using a vacuum centrifuge (Eppendorf Vacufuge). Dried peptides were stored at −80°C until analysis. For analysis, samples were vigorously resuspended in 0.1% FA / 2% ACN in Optima water (ThermoFisher) to a final concentration of 1 mg/mL.
Proteome-Wide Kinetic Refolding Experiments.
Cell pellets were resuspended in 1.5 mL of native buffer (20 mM Tris pH 8.2, 100 mM NaCl, 2 mM MgCl2). Resuspended cells were flash frozen by slow drip over liquid nitrogen and then cryogenically pulverized with a freezer mill (SPEX Sample Prep) over 8 cycles consisting of 1 min grind, 9 Hz and 1 min cool. Pulverized lysates were transferred to a 50 mL centrifuge tube and thawed at room temperature for 20 mins. Cellular lysates were then transferred to a fresh 1.5 mL microfuge tube and clarified at 16000 g for 15 mins at 4°C to remove insoluble cell debris. Clarified lysates were then transferred to 3 mL konical tubes and ultracentrifuged at 33,300 RPM at 4°C for 90 minutes without any sucrose cushion using a SW55 Ti rotor.13 These supernatants were carefully separated from the ribosome pellet and transferred to fresh microfuge tubes, where protein concentrations were determined by using the bicinchoninic acid assay. Using the results from the BCA Assay, the clarified cellular lysates were normalized to a protein concentration of 3.3 mg mL−1 using the same lysis buffer (20 mM Tris pH 8.2, 100 mM NaCl, 2 mM MgCl2).
The native samples (N) were prepared by diluting lysates 14.3-fold with native dilution buffer (20 mM Tris pH 8.2, 100 mM NaCl, 2 mM MgCl2, 130 mM GdmCl, and 1.08 mM DTT) such that upon dilution, the final concentrations of all components are: 20 mM Tris pH 8.2, 100 mM NaCl, 2 mM MgCl2, 120 mM GdmCl, and 1 mM DTT, and a protein concentration of 0.23 mg mL−1. This sample was allowed to incubate for at least 1 h before being subjected to limited proteolysis.
The samples which were refolded by dilution from denaturant (R) were prepared as follows: 600 μL of lysates, solid denaturant (100 mg guanidium chloride (GdmCl)), and 2.4 μL of a freshly prepared 700 mM dithiothreitol (DTT) stock solution were added to a fresh 1.5 mL microfuge tube and solvent was removed using a Vacufuge plus (Eppendorf) until a final volume of 170 μL, such that the final concentrations of all components were: 11.6 mg mL−1 protein, 6 M GdmCl, 350 mM NaCl, 7 mM MgCl2, and 10 mM DTT. Following reduction to the desired final volume, denatured samples were left to unfold at room temperature overnight prior to refolding. To refold unfolded lysates, 4 μL of unfolded lysates were transferred to a fresh 1.5 mL microfuge tube and then rapidly diluted 50× with 196 μL of refolding dilution buffer (19 mM Tris pH 8.2, 95 mM NaCl, 1.9 mM MgCl2, 0.82 mM DTT) such that upon dilution, the final concentrations are: 20 mM Tris pH 8.2, 100 mM NaCl, 2 mM MgCl2, 120 mM GdmCl, 1 mM DTT, and a final protein concentration of 0.23 mg mL−1. Refolded lysates were incubated at room temperature for different durations (1 m, 5 m, 120 m, or overnight) to allow for proteins to refold before incubation with PK (see Fig. 1).
2 μL of a PK stock (prepared as a 0.25 mg mL−1 PK in a 1:1 mixture of native buffer and 20% glycerol, stored at −20°C and thawed at most only once) were added to a fresh 1.5 mL microfuge tube. After allowing proteins to refold for a specified amount of time, 200 μL of the refolded lysates were then added to the PK-containing microfuge tube and rapidly mixed by pipetting (enzyme: substrate ratio is 1:100 on a weight basis). Samples were incubated for exactly 1 min in a water bath preequilibrated at 25°C before transferring them to a mineral oil bath preequilibrated at 100°C and incubating them for 5 mins to quench PK activity. Boiled samples were then transferred to a fresh 2 mL microfuge tube containing 200 mg urea and 85 μL of native buffer such that the final urea concentration was 8 M and the final volume was 415 μL. This method generates the limited proteolysis sample (LiP; further abbreviated as L) protein samples. For samples designated as controls (C), the same procedure was used as above, except PK was not added. For samples designed as native (N; native control (NC) as well as native LiP (NL)), samples were prepared as above, except they were not unfolded and refolded (but nevertheless equilibrated with 120 mM GdmCl). In total, 21 samples were prepared for this experiment; native control, native LiP, refolded control, each done in biological triplicates. The refolded LiP were generated for each of the four refolding times in biological triplicates.
All protein samples were prepared for mass spectrometry and desalted with Sep-Pak C18 1cc Vac Cartridges (Waters) exactly as described above.
LC-MS/MS.
Chromatographic separation of digests were carried out on a Thermo UltiMate3000 UHPLC system with an Acclaim Pepmap RSLC, C18, 75 μm × 25 cm, 2 μm, 100 Å column. Approximately 1.5 μg of protein was injected onto the column. The column temperature was maintained at 40°C, and the flow rate was set to 0.300 μL min−1 for the duration of the run. Solvent A (0.1% FA) and Solvent B (0.1% FA in ACN) were used as the chromatography solvents.
The samples were run through the UHPLC System as follows: peptides were allowed to accumulate onto the trap column (Acclaim PepMap 100, C18, 75 μm x 2 cm, 3μm, 100 Å column) for 10 min (during which the column was held at 2% Solvent B). The peptides were resolved by switching the trap column to be in-line with the separating column, quickly increasing the gradient to 5% B over 5 min and then applying a 95 min linear gradient from 5% B to 25% B. Subsequently, the gradient was increased from 35% B to 40% B over 25 minutes, and then increased again from 40% B to 90% B over 5 minutes. The column was then cleaned with a saw-tooth gradient to purge residual peptides between runs in a sequence.
A Thermo Q-Exactive HF-X Orbitrap mass spectrometer was used to analyze protein digests. A full MS scan in positive ion mode was followed by twenty data-dependent MS scans. The full MS scan was collected using a resolution of 120,000 (@ m/z 200), an AGC target of 3E6, a maximum injection time of 64 ms, and a scan range from 350 to 1500 m/z. The data-dependent scans were collected with a resolution of 15,000 (@ m/z 200), an AGC target of 1E5, a minimum AGC target of 8E3, a maximum injection time of 55 ms, and an isolation window of 1.4 m/z units. To dissociate precursors prior to their re-analysis by MS2, peptides were subjected to an HCD of 28% normalized collision energies. Fragments with charges of 1, 6, 7, or higher and unassigned were excluded from analysis, and a dynamic exclusion window of 30.0 s was used for the data-dependent scans. Reproducibility studies of MS data were conducted by creating technical replicates of the refolded LiP (overnight incubation) and native LiP samples by reinjecting the same samples three separate times.
MS Data Analysis.
Proteome Discoverer Software Suite (v2.4, Thermo Fisher) and the Minora Algorithm were used to analyze mass spectra and perform Label Free Quantification (LFQ) of detected peptides. Default settings for all analysis nodes were used except where specified. The data were searched against Escherichia coli (UP000000625, Uniprot) reference proteome database. For peptide identification, the Proteome Discoverer Sequest HT node was using a semi-tryptic search allowing up to 2 missed cleavages. A precursor mass tolerance of 10 ppm was used for the MS1 level and a fragment ion tolerance was set to .02 Da at the MS2 level. Oxidation of methionine and Acetylation of the N-terminus were allowed as dynamic modifications while carbamidomethylation on cysteines was set as a static modification. Raw normalized extracted ion intensity data for the identified peptides were exported from the .pdResult file using a three-level hierarchy (protein > peptide group > consensus feature). These raw data were processed utilizing custom Python scripts (see Text S1). Briefly, normalized ion counts were averaged across biological replicates, and P-values were assessed using t-tests with Welch’s correction for unequal population variances.
To analyze trends in refoldability between different classifications, we compiled together the number of significant peptides and the total number of peptides quantified for each protein (domain) along with various metadata assembled from EcoCyc, the Superfamily database, and the protein isoelectric database (see below). Tests of categorical significance was accomplished primarily using the chi-square test (as implemented in Excel), or in a few cases, Fisher’s exact test when only two groups were being compared. Calculation of expected frequencies are explicitly provided in Data S1-S4. Non-parametric analyses of distributions were conducted in GraphPad Prism 9.
Bioinformatics and Metadata Collection.
Many of our findings depend on assigning a range of metadata to each of the proteins in the E. coli proteome and identifying patterns in refoldability between proteins and those classifications. The vast majority of the metadata that we used for these purposes came from the EcoCyc database (http://ecocyc.org), a curated database of the genes, proteins, and metabolic networks in the K-12 strain of E. coli.50
We used the gene symbol as our main identifier for E. coli proteins (abcX) although include a list of all synonyms identified by Ecocyc for that gene to facilitate a cross-comparison to the Uniprot and SUPERFAMILY databases. Ecocyc provides information about cellular compartment (cytosol, inner membrane, periplasmic space, outer membrane, ribosome, cell projection), subunit composition, essentiality, copy number, cofactors, and molecular weight (from nucleotide sequence). When the information was available, we used Ecocyc’s Component Of category in order to obtain the full constitutive composition of the protomer within a complex. Cellular compartment, subunit composition, and cofactor information is derived in a manually-curated manner from review of the relevant literature for each protein.
We note that subunit composition information is complicated to define precisely, as many proteins form non-constitutive complexes but those interactions are not required for the protein to be stably folded. We further note that Ecocyc’s collection of cofactor information is imperfect (comparison to PDB structures at time revealed disparities; e.g., LigA has both Mg2+ and Zn2+ cofactors although Ecocyc annotation includes only Mg2+), as well as the imperfect nature of defining a structural cofactors – some cofactors are intrinsic to a protein’s structure whereas others turn over in the manner of a substrate. We have opted to use Ecocyc’s information on record ‘as is’ for reproducibility and consistency, and developed a program that collects this information from the database and inserts it into a file, which is available upon reasonable request.
Copy number information predominantly comes from a single ribosome profiling study by Li and coworkers.51 We used copy number in Neidhardt EZ rich defined medium because of its similarity to the growth medium used in these studies. Essentiality information predominantly comes from the Keio collection study by Baba and coworkers.52 We used essentiality in LB (Lennox) media because of its use in the creation of the Keio collection. Abundance on a weight basis was determined by multiplying copy number by molecular weight.
Domain information was based on the SCOP hierarchy, and obtained through the Superfamily database (http://supfam.org).53,54 We used custom scripts to edit the ‘raw’ file available from supfam.org into a format more usable for our purposes (including the switch from a Uniprot identifier to the gene symbol identifier). This file is which is available upon reasonable request.
Isoelectric effects were obtained from the isoelectric database.55 We downloaded the file corresponding to E. coli and took the average of the isoelectric point calculated by all algorithms available for each protein. Midpoint melting temperatures were obtained from Leuenberger et al.17 Specifically, we downloaded aai7825_Leuenberger_Table-S3 and used the column entitled “Tm Protein,” a melting temperature based on a hierarchical fitting procedure. Chaperonin classes were obtained from Kerner et al.40 Specifically, we examined Table S3 and manually identified the current Uniprot accession code for each of the proteins identified by Kerner et al., and transferred this information into a file that contains the gene symbol, the current Uniprot accession code, and the class assignment. We have also compiled information from Fujiwara et al.,41 which breaks down Class III proteins into Class III− (see Supplementary Data).
Supplementary Material
ACKNOWLEDGMENTS
We thank S. Marqusee and D. Barrick for thoughtful conversations, and P. Mortimer for support with and maintenance of mass spectrometer instrumentation. We are grateful to B. García-Moreno and co-workers for providing samples of SNase and TtRNase H, and to K. Tripp for assistance with CD measurements. We acknowledge an HFSP research grant (RGY0074/2019) and an NSF CAREER grant (MCB-2045844) for funding. BW thanks the Program in Molecular Biophysics training grant (NIH T32GM008403). HET thanks the Chemistry-Biology Interface training grant for support (NIH T32GM080189). SDF would like to dedicate this paper to Dan Tawfik, zichrono l’vracha (of blessed memory), who critically reviewed it, and helped make him into a better scientist.
Footnotes
Competing Interests. Authors declare that they have no competing interests.
ASSOCIATED CONTENT
The Supporting Information is available free of charge at DOI: 10.1021/jacs.1c03270.
Supporting Information includes four Texts (Text S1-S4), eleven supplementary figures (Figs. S1-S11), and four datasets (Data S1-S4) provided as excel spreadsheets. The supporting information includes detailed description of the LFQ filtering algorithm (Text S1), a description of how coverage bias is accounted for (Text S2), a note on membrane proteins (Text S3), and a description of how kinetic trends were assessed (Text S4). Figures show additional data and analyses on single protein refolding studies (Fig. S1), precipitation assays (Fig. S2), reproducibility analysis (Fig. S3), summary data for all proteome-wide refolding experiments (Fig. S4), assessment of the study’s coverage (Fig. S5), additional analysis on domains (Fig. S6), analysis of peptide coverage bias (Figs. S7-S8), category cross-correlation analysis (Fig. S9), analysis on complete vs. partial non-refolding (Fig. S10), additional analyses on slow refolders (Fig. S11), additional analyses on chaperone class (Fig. S12).
Data Availability.
Raw proteomic data have been submitted to PRIDE via the ProteomeXchange under the accession codes PXD025926. Data used to construct figures are provided as spreadsheets as Supplementary Data S1-S3. Python programs are available on GitHub at https://github.com/friedlabJHU/refoldability-tools.
REFERENCES
- 1.Dobson CM; Evans PA The folding of hen lysozyme involves partially structured intermediates and multiple pathways. Nature 1992, 358, 302–307. [DOI] [PubMed] [Google Scholar]
- 2.Hughson FM; Wright PE; Baldwin RL Structural Characterization of a Partly Folded Apomyoglobin Intermediate. Science 1990, 249, 1544–1548. [DOI] [PubMed] [Google Scholar]
- 3.Lipman EA; Schuler B; Bakajin O; Eaton WA Single-Molecule Measurement of Protein Folding Kinetics. Science 2003, 301, 1233–1235. [DOI] [PubMed] [Google Scholar]
- 4.Matouschek A; Kellis J; Serrano L; Fersht A Mapping the Transition State and Pathway of Protein Folding by Protein Engineering. Nature 1989, 340, 122–126. [DOI] [PubMed] [Google Scholar]
- 5.Padmanabhan S; Marqusee S; Ridgeway T; Laue TM; Baldwin RL Relative Helix-Forming Tendencies of Nonpolar Amino Acids. Nature 1990, 344, 268–270. [DOI] [PubMed] [Google Scholar]
- 6.Anfinsen CB Principles That Govern the Folding of Protein Chains. Science 1973, 181, 223–230. [DOI] [PubMed] [Google Scholar]
- 7.Anfinsen CB; Haber E; Sela M; White FH The Kinetics of Formation of Native Ribonuclease During Oxidation of the Reduced Polypeptide Chain. Proc. Natl. Acad. Sci. USA 1961, 47, 1309–1314. [DOI] [PMC free article] [PubMed] [Google Scholar]
- 8.Karplus M Behind the folding funnel diagram. Nature Chem. Biol 2011, 7, 401–404. [DOI] [PubMed] [Google Scholar]
- 9.Dill K; Chan H From Levinthal to Pathways to Funnels. Nature Struct. Biol 1997, 4, 10–19. [DOI] [PubMed] [Google Scholar]
- 10.Dill KA; Ozkan SB; Shell MS; Weikl TR The Protein Folding Problem. Annu. Rev. Biophys 2008, 37, 289–316.. [DOI] [PMC free article] [PubMed] [Google Scholar]
- 11.Lai Z; McCulloch J; Lashuel HA; Kelly JW Guanidine Hydrochloride-Induced Denaturation and Refolding of Transthyretin Exhibits a Marked Hysteresis. Biochemistry 1997, 36, 10230–10239. [DOI] [PubMed] [Google Scholar]
- 12.Jaswal SS; Sohl JL; Davis JH; Agard DA Energetic landscape of α-lytic protease optimizes longevity through kinetic stability. Nature 2002, 415, 343–346. [DOI] [PubMed] [Google Scholar]
- 13.Harris CL An aminoacyl-tRNA synthetase complex in Escherichia coli. J. Bacteriol 1987, 169, 2718–2723 (1987). [DOI] [PMC free article] [PubMed] [Google Scholar]
- 14.Shiber A; Döring K; Friedrich U; Klann K; Merker D; Zedan M; Tippmann F; Kramer G; Bukau B Cotranslational assembly of protein complexes in eukaryotes revealed by ribosome profiling. Nature 2018, 561, 268–272. [DOI] [PMC free article] [PubMed] [Google Scholar]
- 15.Schopper S; Kahraman A; Leuenberger P; Feng Y; Piazza I; Müller O; Boersema PJ; Picotti P Measuring Protein Structural Changes on a Proteome-Wide Scale Using Limited Proteolysis-Coupled Mass Spectrometry. Nature Protoc. 2017, 12, 2391–2410. [DOI] [PubMed] [Google Scholar]
- 16.Feng Y; De Franceschi G; Kahraman A; Soste M; Melnik A; Boersema PJ; de Laureto PP; Nikolaev Y; Oliveira AP; Picotti P Global Analysis of Protein Structural Changes in Complex Proteomes. Nature Biotech. 2014, 32, 1036–1044. [DOI] [PubMed] [Google Scholar]
- 17.Leuenberger P; Ganscha S; Kahraman A, Cappelletti V, Boersema PJ, von Mering C, Claassen M, Picotti P, Cell-Wide Analysis of Protein Thermal Unfolding Reveals Determinants of Thermostability. Science 355, eaai7825, (2017). [DOI] [PubMed] [Google Scholar]
- 18.Piazza I; Kochanowski K; Cappelletti V; Fuhrer T; Noor E; Sauer U; Picotti P A Map of Protein-Metabolite Interactions Reveals Principles of Chemical Communication.” Cell 2018, 172, 358–361. [DOI] [PubMed] [Google Scholar]
- 19.Varela AE; Lang JF; Wu Y; Dalphin MD; Stangl AJ; Okuno Y; Cavagnero S Kinetic Trapping of Folded Proteins Relative to Aggregates under Physiologically Relevant Conditions. J. Phys. Chem. B 2018, 122, 7682–7698. [DOI] [PubMed] [Google Scholar]
- 20.Wang Y; van Oosterwijk N; Ali AM; Aldawy A; Anindya AL; Dömling ASS; Groves MR A Systematic Protein Refolding Screen Method using the DGR Approach Reveals that Time and Secondary TSA are Essential Variables. Sci. Rep 2017, 7, 9355. [DOI] [PMC free article] [PubMed] [Google Scholar]
- 21.Bianco V; Alonso-Navarro M; Di Silvio D; Moya S; Cortajarena AL; Coluzza I Proteins are Solitary! Pathways of Protein Folding and Aggregation in Protein Mixtures. J. Phys. Chem. Lett 2019, 10, 4800–4804. [DOI] [PubMed] [Google Scholar]
- 22.Wisniewski JR; Rakus D Quantitative analysis of the Escherichia coli proteome. Data in Brief 2014, 1, 7–11. [DOI] [PMC free article] [PubMed] [Google Scholar]
- 23.Shieh Y-W; Minguez P; Bork P; Auburger JJ; Guilbride DL; Kramer G; Bukau B Operon structure and cotranslational subunit association direct protein assembly in bacteria. Science 2015, 350, 678–680. [DOI] [PubMed] [Google Scholar]
- 24.Natan E; Wells JN; Teichmann SA; Marsh JA Regulation, evolution and consequences of cotranslational protein complex assembly. Curr. Opin. Struct. Biol 2017, 42, 90–97. [DOI] [PubMed] [Google Scholar]
- 25.Schwarz A; Beck M The benefits of cotranslational assembly: A structural perspective. Trends Cell. Biol 2019, 29, 791–803. [DOI] [PubMed] [Google Scholar]
- 26.Ahnert SE; Marsh JA; Hernandez H; Robinson CV; Teichmann SA Principles of assembly reveal a periodic table of protein complexes. Science 2015, 350, aaa2245–aaa2245. [DOI] [PubMed] [Google Scholar]
- 27.Chaney JL; Clark PL Roles for Synonymous Codon Usage in Protein Biogenesis. Annu. Rev. Biophys 2015, 44, 143–166. [DOI] [PubMed] [Google Scholar]
- 28.Borgia MB; Borgia A; Best RB; Steward A; Nettels D; Wunderlich B; Schuler B; Clarke J Single-molecule fluorescence reveals sequence-specific misfolding in multidomain proteins. Nature 2011, 474, 662–665. [DOI] [PMC free article] [PubMed] [Google Scholar]
- 29.Thanaraj TA; Argos P Ribosome-mediated translational pause and protein domain organization. Protein Sci. 1996, 5, 1594–1612. [DOI] [PMC free article] [PubMed] [Google Scholar]
- 30.Hamill SJ; Steward A; Clarke J The folding of an immunoglobulin-like greek key protein is defined by a common-core nucleus and regions constrained by topology. J. Mol. Biol 2000, 297, 165–178. [DOI] [PubMed] [Google Scholar]
- 31.Sabelko J; Ervin J; Gruebele M Observation of Strange Kinetics in Protein Folding. Proc. Natl. Acad. Sci. USA 1999, 96, 6031–6036. [DOI] [PMC free article] [PubMed] [Google Scholar]
- 32.Lei H; Guo Y; Hu X; Hu C; Hu X; Li H Reversible Unfolding and Folding of the Metalloprotein Ferredoxin Revealed by Single-Molecule Atomic Force Microscopy. J. Am. Chem. Soc 2017, 139, 1538–1544. [DOI] [PubMed] [Google Scholar]
- 33.Wächtershäuser G Evolution of the first metabolic cycles. Proc. Natl. Acad. Sci. USA 1990, 87, 200–204. [DOI] [PMC free article] [PubMed] [Google Scholar]
- 34.Wächtershäuser G Groundworks for an evolutionary biochemistry: The iron-sulfur world, Prog. Biophys. Mol. Biol 1992, 58, 85–201. [DOI] [PubMed] [Google Scholar]
- 35.Sinclair JF; Ziegler MM; Baldwin TO Kinetic partitioning during protein folding yields multiple native states. Nat. Struct. Biol 1994, 1, 320–326. [DOI] [PubMed] [Google Scholar]
- 36.Thirumalai D; Klimov DK; Woodson SA Kinetic Partitioning Mechanism as a unifying theme in the folding of Biomolecules. Theo. Chem. Accts 1997, 96, 14–22. [Google Scholar]
- 37.Maxwell KL; et al. Protein Folding: Defining a “Standard” Set of Experimental Conditions and a Preliminary Kinetic Data Set of Two-State Proteins. Protein Sci. 2005, 14, 602–616. [DOI] [PMC free article] [PubMed] [Google Scholar]
- 38.Bogatyreva NS; Osypov AA; Ivankov DN KineticDB: a Database of Protein Folding Kinetics. Nucleic Acids Res. 2009, 37, D342–D346. [DOI] [PMC free article] [PubMed] [Google Scholar]
- 39.Kern G; Fern D; Schmid FX; Fischer G A kinetic analysis of the folding of human carbonic anhydrase II and its catalysis by cyclophilin. J. Biol. Chem 1995, 270, 740–735. [DOI] [PubMed] [Google Scholar]
- 40.Kerner MJ; Naylor DJ; Ishihama Y; Maier T; Chang H-C; Stines AP; Georgopoulos C; Frishman D; Hayer-Hartl M; Mann M; Hartl FU Proteome-Wide Analysis of Chaperonin-Dependent Protein Folding in Escherichia Coli. Cell 2005, 122, 209–220. [DOI] [PubMed] [Google Scholar]
- 41.Fujiwara K; Ishihama Y; Nakahigashi K; Soga T; Taguchi H A systematic survey of in vivo obligate chaperonin-dependent substrates. EMBO J. 2010, 29, 1552–1564. [DOI] [PMC free article] [PubMed] [Google Scholar]
- 42.Kim YE; Hipp MS; Bracher A; Hayer-Hartl M; Hartl FU Molecular Chaperone Functions in Protein Folding and Proteostasis. Annu. Rev. Biochem 2013, 82, 323–355. [DOI] [PubMed] [Google Scholar]
- 43.Niwa T; Ying B-W; Saito K; Jin W; Takada S; Ueda T; Taguchi H Bimodal protein solubility distribution revealed by an aggregation analysis of the entire ensemble of Escherichia coli proteins. Proc. Natl. Acad. Sci. USA 2009, 106, 4201–4206. [DOI] [PMC free article] [PubMed] [Google Scholar]
- 44.Huang G-C; Li Z-Y; Zhou J-M; Fischer G Assisted folding of D-glyceraldehyde-3-phosphate dehydrogenase by trigger factor. Protein Sci. 2000, 9, 1254–1261. [DOI] [PMC free article] [PubMed] [Google Scholar]
- 45.Strucksberg KH; Rosenkranz T; Fritter J Reversible and irreversible unfolding of multi-domain proteins. Biochim. Biophys. Acta Proteins Proteomics 2007, 1774, 1591–1603. [DOI] [PubMed] [Google Scholar]
- 46.Paul S; Singh C; Mishra S; Chaudhuri TK The 69 kDa Escherichia coli maltodextrin glucosidase does not get encapsulated underneath GroES and folds through trans mechanism during GroEL/ GroES-assisted folding. FASEB J. 2007, 21, 2874–2885. [DOI] [PubMed] [Google Scholar]
- 47.Braselmann E; Chaney JL; Clark PL Folding the proteome. Trends Biochem Sci. 2013, 38, 337–344. [DOI] [PMC free article] [PubMed] [Google Scholar]
- 48.Shortle D; Meeker A Mutant forms of staphylococcal nuclease with altered patterns of guanidine hydrochloride and urea denaturation. Proteins: Struct Funct Genet 1986, 1, 81–89. [DOI] [PubMed] [Google Scholar]
- 49.Hollien J; Marqusee S Thermodynamic comparison of mesophilic and thermophilic ribonucleases H. Biochemistry 1999, 38, 3831–3836. [DOI] [PubMed] [Google Scholar]
- 50.Keseler IM; et al. The EcoCyc database: reflecting new knowledge about Escherichia coli K-12. Nucleic Acids Res. 2017, 45, D543–D550. [DOI] [PMC free article] [PubMed] [Google Scholar]
- 51.Li G-W; Burkhardt D; Gross C; Weissman J Quantifying absolute protein synthesis rates reveals principles underlying allocation of cellular resources. Cell 2014, 24, 624–635. [DOI] [PMC free article] [PubMed] [Google Scholar]
- 52.Baba T; Ara T; Hasegawa M; Takai Y; Okumura Y; Baba M; Datsenko KA; Tomita M; Wanner BL; Mori H Construction of Escherichia coli K-12 in-frame single-gene knockout mutants: the Keio collection. Mol. Sys. Biol 2006, 2, 2006.0008. [DOI] [PMC free article] [PubMed] [Google Scholar]
- 53.Gough J; Karplus K; Hughey R; Chothia C Assignment of homology to genome sequences using a library of hidden Markov models that represent all proteins of known structure. J. Mol. Biol 2001, 313, 903–919. [DOI] [PubMed] [Google Scholar]
- 54.Pandurangan AP; Stahlacke J; Oates ME; Smithers B; Gough J The superfamily 2.0 database: A significant proteome update and a new webserver. Nucleic Acids Res. 2019, 47, D490–D494. [DOI] [PMC free article] [PubMed] [Google Scholar]
- 55.Kozlowski LP Proteome-pI: proteome isoelectric point database. Nucleic Acids Res. 2017, 45, D1112–D1116. [DOI] [PMC free article] [PubMed] [Google Scholar]
Associated Data
This section collects any data citations, data availability statements, or supplementary materials included in this article.
Supplementary Materials
Data Availability Statement
Raw proteomic data have been submitted to PRIDE via the ProteomeXchange under the accession codes PXD025926. Data used to construct figures are provided as spreadsheets as Supplementary Data S1-S3. Python programs are available on GitHub at https://github.com/friedlabJHU/refoldability-tools.