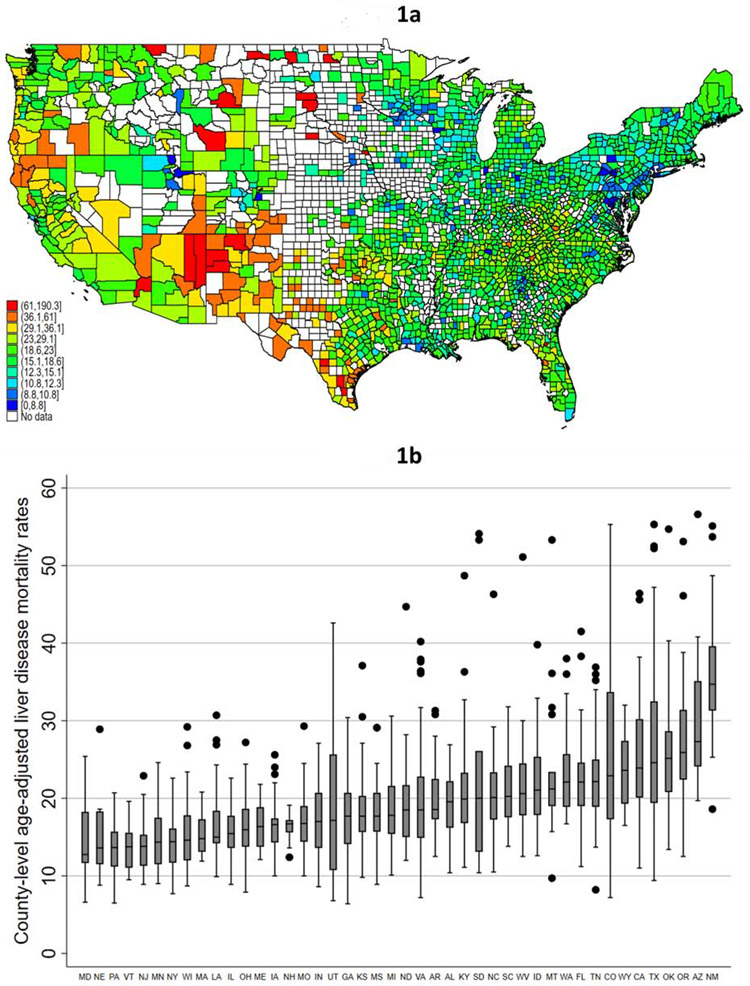
Figure 1 (two panels): County-level variability in liver disease-related mortality rates.
- Figure 1a: County-level age-adjusted liver disease-related mortality rates; 2009-2018*†
- Figure 1b: Within-state variability in age-adjusted county-level liver disease-related mortality rates; 2009-2018*‡
- * CDC WONDER age-adjusted mortality rates excludes counties with fewer than 20 liver disease-related deaths due to “unreliable” age-adjusted rates
- † Legend categories based on 1st, 5th, 10th, 25th, 50th, 75th, 90th, 95th, and 99th percentile of mortality
- ‡ Figure y-axis excludes top 1% of counties, and only states (n=45) with 10 or more counties with available data were included

