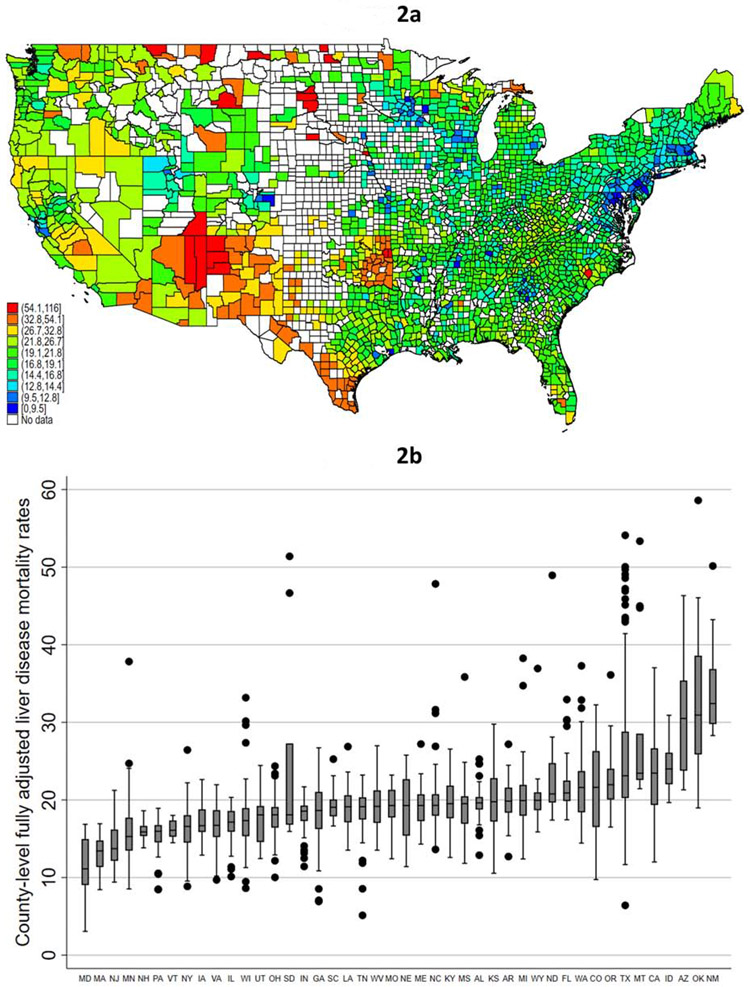
Figure 2b: Within-state variability in fully adjusted county-level liver disease-related mortality rates; 2009-2018*‡**
* CDC WONDER age-adjusted mortality rates excludes counties with fewer than 20 liver disease-related deaths due to “unreliable” age-adjusted rates
† Legend categories based on 1st, 5th, 10th, 25th, 50th, 75th, 90th, 95th, and 99th percentile of mortality
‡ Figure y-axis excludes top 1% of counties, and only states (n=46) with 10 or more counties with available data were included
** Fully adjusted mortality rates based on post-estimation predictions of multivariable linear regression models. Legend categories based on 1st, 5th, 10th, 25th, 50th, 75th, 90th, 95th, and 99th percentile of mortality

