Abstract
The lung is the primary organ targeted by severe acute respiratory syndrome coronavirus 2 (SARS-CoV-2), making respiratory failure a leading coronavirus disease 2019 (COVID-19)-related mortality. However, our cellular and molecular understanding of how SARS-CoV-2 infection drives lung pathology is limited. Here we constructed multi-omics and single-nucleus transcriptomic atlases of the lungs of patients with COVID-19, which integrate histological, transcriptomic and proteomic analyses. Our work reveals the molecular basis of pathological hallmarks associated with SARS-CoV-2 infection in different lung and infiltrating immune cell populations. We report molecular fingerprints of hyperinflammation, alveolar epithelial cell exhaustion, vascular changes and fibrosis, and identify parenchymal lung senescence as a molecular state of COVID-19 pathology. Moreover, our data suggest that FOXO3A suppression is a potential mechanism underlying the fibroblast-to-myofibroblast transition associated with COVID-19 pulmonary fibrosis. Our work depicts a comprehensive cellular and molecular atlas of the lungs of patients with COVID-19 and provides insights into SARS-CoV-2-related pulmonary injury, facilitating the identification of biomarkers and development of symptomatic treatments.
Subject terms: SARS-CoV-2, Senescence, Innate immunity
Wang et al. analysed post-mortem samples of the lungs of patients with COVID-19 by bulk and single-nucleus RNA sequencing along with proteomics and discovered lung senescence as a feature of COVID-19 pathology.
Main
Coronavirus disease 2019 (COVID-19) continues to ravage the global community. Across age groups, patients over the age of 65 years remain at the highest risk of severe complications of COVID-19 and account for about 80% of COVID-19-related deaths (https://data.cdc.gov). The human lung, a multi-compartmental dendritic structure composed of highly specialized cell types and infiltrated immune cells1, is the most vulnerable tissue in COVID-19 (refs. 2–5). In patients with severe disease, the severe acute respiratory syndrome coronavirus 2 (SARS-CoV-2) virus propagates in the lower respiratory tract to cause hypoxaemia and severe pneumonia, accompanied by acute respiratory distress syndrome5. Through histological examinations, we and others have identified features of bilateral diffuse alveolar damage, signs of respiratory inflammation, hyaline membrane formation, microvascular complications and fibrosis in the lungs of individuals who have died of COVID-19 (refs. 2,4). However, to develop urgently needed and effective targeted symptomatic therapies, we need a comprehensive cellular and molecular profile of lung pathology of patients with COVID-191,6.
Here, we integrated transcriptomics, proteomics and histopathological technologies to construct a comprehensive multi-omics and single-nucleus transcriptomic atlas of the lungs from the patients with COVID-19. In a series of verification experiments, our data link COVID-19-associated changes in lung phenotypes and functions with cell type-specific gene expression changes, and we resolve molecular mechanisms of enhanced senescence, inflammation, apoptosis, coagulation and fibrosis. Overall, our work deepens our understanding of the COVID-19-diseased human lung and provides avenues for developing strategies for the treatment of symptoms.
Results
Transcriptomic and proteomic analyses of COVID-19 pathology
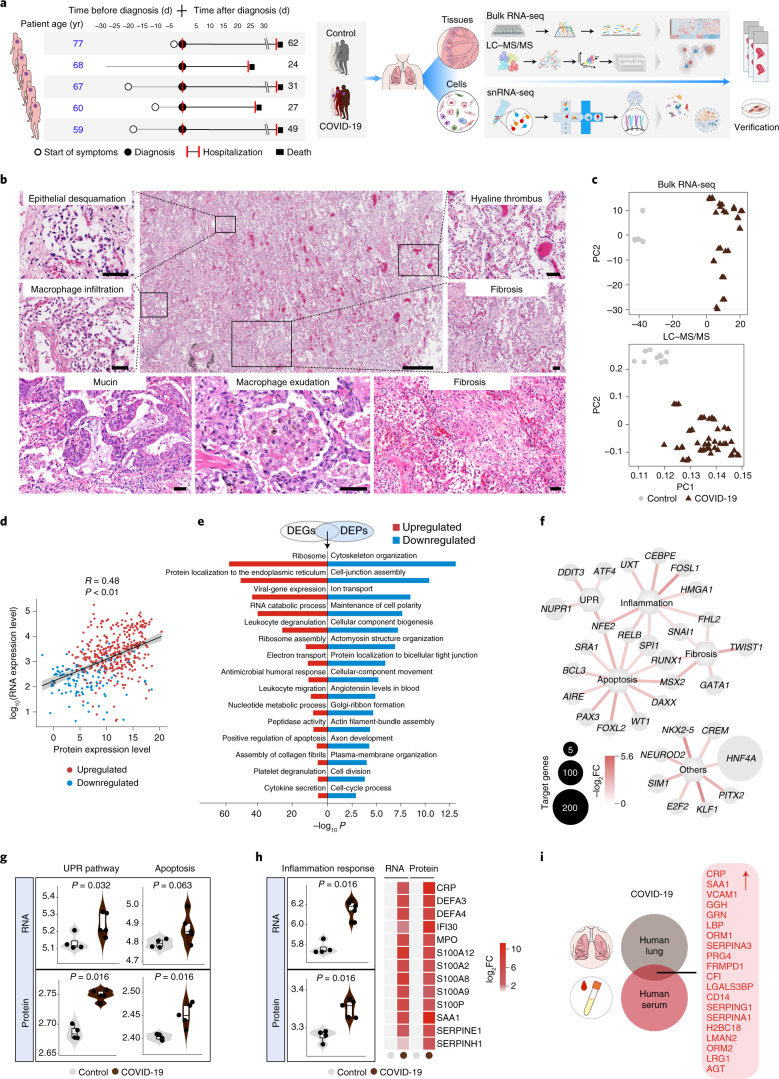
We obtained post-mortem lung-tissue specimens from patients with COVID-19 (mean age of 66 years; Fig. 1a and Supplementary Table 1). We also obtained age-matched normal lung samples from a cohort without any known history of infectious diseases as controls (Control; Fig. 1a and Supplementary Table 1). Following histopathological examination of SARS-CoV-2-infected lung parenchyma, we found a spectrum of diffuse alveolar damage characterized by desquamation of the alveolar epithelium and mucous-plug formation (Fig. 1b, Extended Data Fig. 1a,b and Supplementary Table 1). We also detected vascular injury with disseminated intravascular coagulation (Fig. 1b). In addition, fulminant intra-alveolar macrophage infiltration, severe pulmonary fibrosis and increased apoptosis were evident (Fig. 1b and Extended Data Fig. 1c).
Fig. 1. Integrated analysis of COVID-19 pulmonary pathology.
a, Study overview. Information on the patients with COVID-19 and the pathological processes (left). Schematic of the experimental process of the analysis of five COVID-19 and four normal (Control) lung tissues by bulk RNA-seq, liquid chromatography with tandem mass spectrometry (LC-MS/MS), snRNA-seq and experimental verification (right). b, Representative images of haematoxylin-and-eosin staining of lung sections from patients with COVID-19 (n = 5 lungs with samples from three lung lobes each). Scale bars, 400 μm (main image; centre top) and 50 μm (magnified images). c, Principle component (PC) analysis showing the differences between the lungs of Controls and patients with COVID-19 based on the expression patterns from the RNA-seq (top) and LC-MS/MS analyses (bottom). d, Spearman’s correlation analysis of the expression levels of overlapping genes and proteins that were differentially expressed between the COVID-19 and Control lungs (|log2(fold change, FC)| > 1.5, adjusted P < 0.05). Linear fitting is indicated by a black line with confidence intervals represented in grey shading. e, GO term and pathway enrichment analysis of overlaps between COVID-19 DEGs and DEPs. f, Network plot showing upregulated transcription factors identified by ingenuity pathway analysis of the bulk RNA-seq. The small and large node sizes indicate low and high numbers of target genes, respectively. g, Gene-set scores of UPR pathway- and apoptosis-related genes at the RNA (top) and protein (bottom) level. h, Gene-set scores of inflammation response-related genes at RNA and protein levels (left). Heatmap showing inflammation-related genes upregulated at both the RNA and protein level (right). g,h, Control, n = 4 lungs; and COVID-19, n = 5 lungs, with samples from three lung lobes each. The boxes show the median (centre line) and the quartile range (25-75%), and the whiskers extend from the quartile to the minimum and maximum values. P values are indicated; Wilcoxon signed-rank test. i, Venn plot showing the DEPs that are common to the lungs and sera of patients with COVID-19. The upregulated proteins are listed (right).
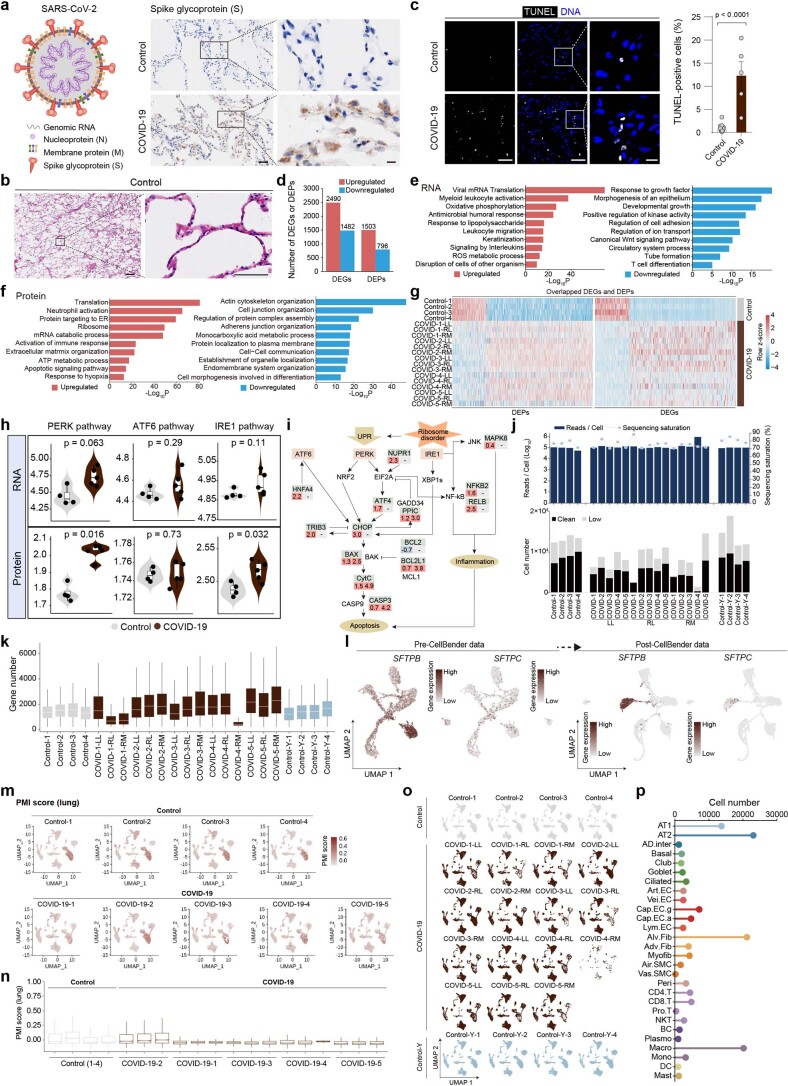
Extended Data Fig. 1. Pathological analysis and transcriptional and proteomic profiles of the lung tissues of patients with COVID-19.
a, Left, schematic diagram of SARS-CoV-2. Right, representative images of immunostaining of spike glycoprotein (S) in Control (n = 4) and COVID-19 lungs (n = 5 patient lungs sampled from three lung lobes each). Scale bars, 50 μm and 10 μm (zoomed-in images). b, Representative images of H&E staining of Control lungs (n = 4 donors) related to Fig. 1b. Scale bars, 400 μm and 50 μm (zoomed-in images). c, TUNEL staining of lungs. Quantitative data are shown as mean ± s.e.m. Control, n = 13; COVID-19, n = 5 patient lungs sampled from three lung lobes each. Scale bars, 50 μm and 10 μm (zoomed-in image). Two-tailed t-test P values are indicated. d, Bar plot showing the numbers of DEGs and DEPs between Control and COVID-19 groups. e-f, GO term and pathway enrichment analysis of DEGs (e) or DEPs (f) between Control and COVID-19 groups. g, Heatmap showing the overlapped genes of DEGs and DEPs between Control and COVID-19 groups. h-o, Transcriptional, proteomic, and single-nucleus RNA sequencing analyses of Control, COVID-19 and Control-Y groups. Gene set scores of indicated pathway-related genes at RNA and protein levels. P values by Wilcoxon test are indicated (h). Diagram of UPR pathway. Values below indicate log2FC for RNA (left) and protein (right) levels (i). Bar plot showing the reads per cell, sequencing saturation (Top) and cell numbers (Bottom) of each sample in snRNA-seq (j). Box plot showing the detected gene numbers across cells of different samples (k). UMAP plots showing the levels of SFTPB and SFTPC across different cell types before and after the data were processed by CellBender (l). UMAP (m) and box (n) plots showing comparable gene set scores of 19 genes (lung) likely affected by different post-mortem intervals (PMI). UMAP plots showing cell distributions in different samples of human lung tissues (o). Control, n = 4 lungs; COVID-19, n = 5 patient lungs sampled from three lung lobes each; Control-Y, n = 4 lungs. Box shows the median (centre line) and the quartile range (25-75%) and the whiskers extend from the quartiles to the minimum and maximum values. p, Cell numbers of different cell types in human lung tissues.
To explore the molecular mechanisms of COVID-19 pneumonia, we performed genome-wide RNA sequencing (RNA-seq) and data-independent acquisition (DIA) mass spectrometry-based proteomics analyses on lung samples from five COVID-19 cases and four age-matched Control individuals (Fig. 1a,c and Supplementary Table 1). We identified 3,972 differentially expressed genes (DEGs) and 2,299 differentially expressed proteins (DEPs) in the COVID-19 group (Extended Data Fig. 1d and Supplementary Table 2), which largely overlapped (Fig. 1d).
Consistent with lung deformation and dysfunction caused by SARS-CoV-2 infection, we identified downregulated cytoskeleton organization and cell-junction assembly (Fig. 1e and Extended Data Fig. 1e–g), and upregulated apoptosis, viral gene expression, ribosome and endoplasmic-reticulum localization pathways (Fig. 1e and Extended Data Fig. 1e–g) through functional annotation of overlapping DEGs and DEPs by Gene Ontology (GO) term analysis. As determined by transcription factor network analysis, upregulated DEGs primarily coalesced into activation of the unfolded protein response (UPR; for example, ATF4 and DDIT3) and apoptosis induction (Fig. 1f,g, Extended Data Fig. 1h,i and Supplementary Table 3). Together with immunohistological staining results showing spike protein expression and an increased number of apoptotic cells in the lungs of patients with COVID-19 (Extended Data Fig. 1a,c), these findings suggest that SARS-CoV-2 infection triggers the UPR and cell apoptosis.
Interactions between SARS-CoV-2 and host tissues induce inflammation. Accordingly, we found that genes and proteins related to leukocyte degranulation and migration (for example, RELB) were dramatically upregulated in COVID-19 pulmonary parenchyma (Fig. 1e,f and Extended Data Fig. 1e,f). Among the most-upregulated genes at both the transcriptional and translational levels were C-reaction protein (CRP; Fig. 1h)7 and serum amyloid A (SAA1; Fig. 1h)8, both predictive COVID-19 markers. Furthermore, inflammation-related genes in the S100 family and serpin serine protease inhibitors increased at both the RNA and protein levels (Fig. 1h). By jointly analysing the upregulated protein profiles in lung tissues and sera9, we found that CRP, SAA1 and serpin serine protease inhibitors (SERPINA3, SERPING1 and SERPINA1) also accumulated in the sera of patients with severe COVID-19 (Fig. 1i), indicative of their potential use as markers of the degree of COVID-19-related lung damage.
A single-cell transcriptional atlas of the lungs of patients with COVID-19
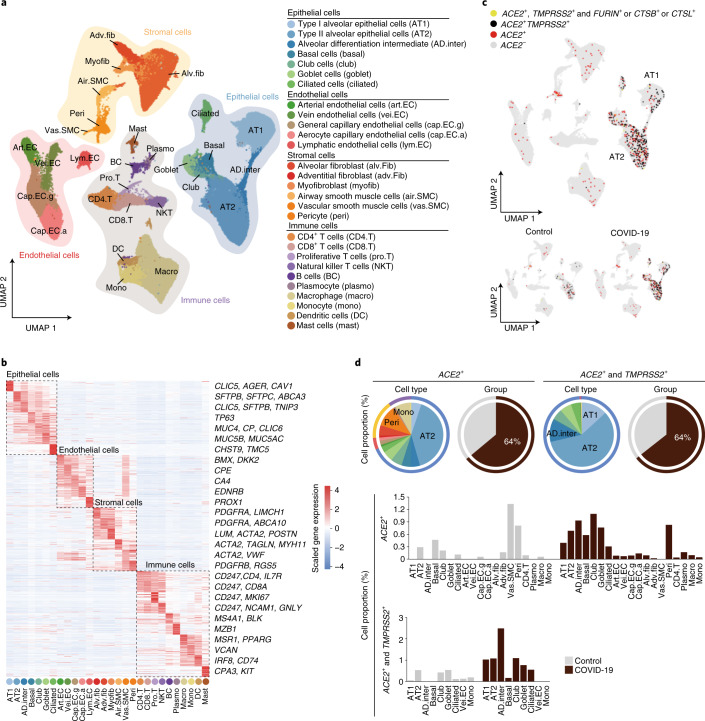
To achieve high-resolution molecular profiling of COVID-19 pneumonic pathology, we performed single-nucleus RNA-seq (snRNA-seq) on the lungs of patients with COVID-19 and the aforementioned Control group (Fig. 1a). After quality control and cluster annotation, (Extended Data Fig. 1j–n), we identified 28 cell types based on signature genes (Fig. 2a,b and Extended Data Fig. 1o,p), which were classified into four major cell types-epithelial, endothelial, stromal and immune cells (Fig. 2b, Extended Data Fig. 2a–f and Supplementary Table 4). Consistent with previous reports10,11, our data revealed that ACE2 and TMPRSS2 were primarily expressed in epithelial cells, such as type I and II alveolar pneumocytes (AT1 and AT2, respectively), which are also the main SARS-CoV-2 target cell types (Fig. 2c). Notably, increased numbers of epithelial cells positive for ACE2 and/or TMPRSS2 were detected in the COVID-19 samples (Fig. 2d), suggesting that SARS-CoV-2 increases the infectivity in patients with COVID-19 by eliciting positive-feedback effects12.
Fig. 2. Construction of single-nucleus atlases of the human lung by snRNA-seq.
a, Human lung single-nucleus transcriptional atlas. Uniform manifold approximation and projection (UMAP) plots showing different cell types by snRNA-seq (left). Table of abbreviations used in all panels for the different cell types (right). b, Heatmap showing the gene expression signatures of the top 30 marker genes corresponding to each cell type in human lungs (left). Each column represents a cell type, each row indicates the expression of one gene and each colour represents one cell type as illustrated in a. Representative marker genes for each cell type are shown (right). c, UMAP plots showing ACE2 and TMPRSS2 double positive cells with positivity for FURIN, CTSB or CTSL, other ACE2 and TMPRSS2 double positive cells, other ACE2+ cells and ACE2− cells in the human lung atlas. Bottom panels show the distribution of cells from Control and COVID-19 groups. d, Cell-type (colour coded as per the legend in a) composition of cells that express genes associated with SARS-CoV-2 entry and their percentages in the lungs of the two groups-COVID-19 and Control (top). Percentages of different cell types expressing the corresponding SARS-CoV-2 entry-associated genes (bottom).
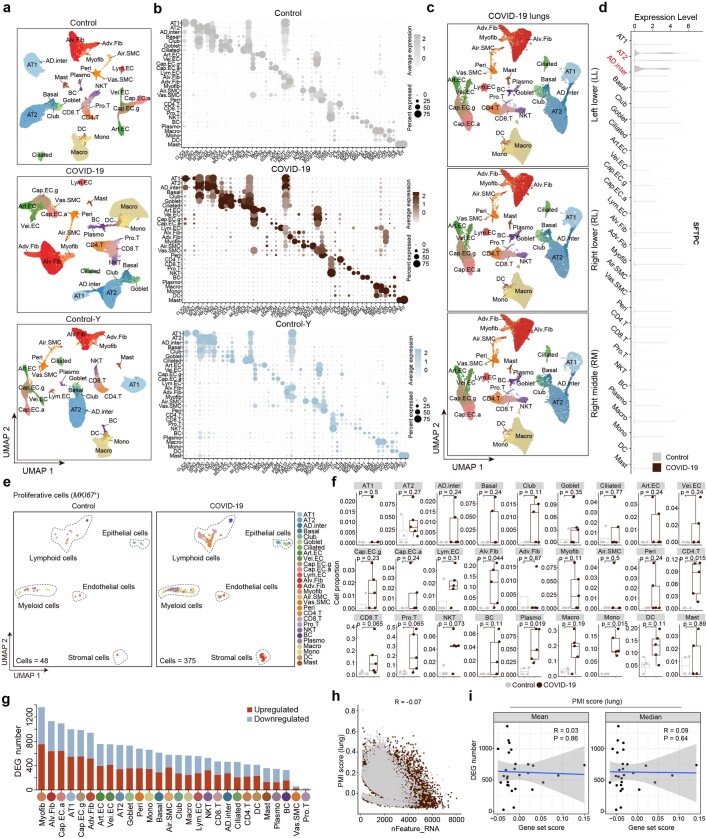
Extended Data Fig. 2. Data quality control and cell type identification by snRNA-seq.
(a) UMAP plots showing cell distributions of different cell types in Control, COVID-19, and Control-Y groups. (b) Dot plots showing the expression levels of cell type-specific marker genes in Control, COVID-19, and Control-Y groups. (c) UMAP plots showing cell distributions of different cell types in left lower (LL), right middle (RM), and right lower (RL) lobes of the lungs of patients with COVID-19. (d) Violin plot showing expression levels of SFTPC across different cell types in Control and COVID-19 lungs. (e) UMAP plots showing MKI67-positive proliferative cells in Control and COVID-19 groups. (f) Box plots showing cell proportions of proliferative cells across different cell types in human lung between Control and COVID-19 groups. Control, n = 4 lungs; COVID-19, n = 5 lungs with samples from three lung lobes each. Box shows the median (centre line) and the quartile range (25-75%) and the whiskers extend from the quartiles to the minimum and maximum values. (g) Bar plot showing numbers of DEGs (|logFC | > 0.5, adjusted P value < 0.05) in different cell types between COVID-19 and Control lungs. (h) Scatter plot showing gene set scores of PMI-related genes (lung) (Y-axis) and detected gene numbers (X-axis) across cells of Control and COVID-19 lungs. Control, n = 34,974 cells; COVID-19, n = 73,116 cells. R value from spearman’s correlation analysis is as indicated. (i) The dot plots showing the Spearman’s correlations between PMI scores and DEG numbers across different cell types of lung. Mean, the mean values of PMI scores across cells of each type. Median, the median values of PMI scores across cells of each cell types. R value from spearman’s correlation analysis is as indicated.
Molecular characterization of COVID-19 pathology
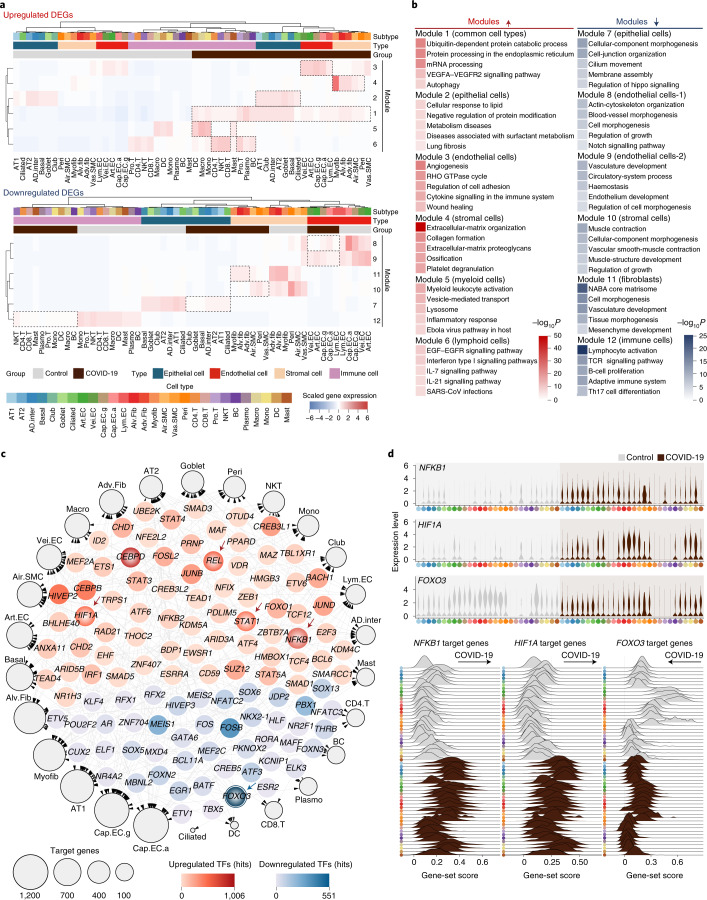
To further investigate the cell type-specific transcriptional characteristics of pathogenesis in the lungs of patients with COVID-19, we compared DEGs between COVID-19 and Control groups by cell type (hereafter referred to as COVID-19 DEGs; Fig. 3a,b and Extended Data Fig. 2g–i). We identified a total of 3,264 COVID-19 DEGs across 28 cell types (Extended Data Fig. 2g) and found that COVID-19 DEGs were most prevalent in myofibroblasts, alveolar fibroblasts, aerocyte capillary endothelial cells (Cap.EC.a) and AT1 (Extended Data Fig. 2g). The DEG numbers in the 28 cell types were not significantly associated with the post-mortem interval (Extended Data Fig. 2h,i). Using modularized analysis of the COVID-19 DEGs, we deconvoluted gene expression perturbations to various cell types (Fig. 3a,b and Supplementary Table 4) and identified six functional upregulated DEG modules (Fig. 3b). These were: Module 1, ubiquitin-dependent protein catabolic process (commonly upregulated pathways); Module 2, diseases associated with surfactant metabolism and lung fibrosis (mainly attributed to epithelial cells); Module 3, angiogenesis (mainly attributed to endothelial cells) and Module 4, extracellular-matrix organization (mainly attributed to stromal cells; Fig. 3b); Module 5, which was mainly enriched in myeloid cells (macrophage, monocytes and mast cells), as reflected by upregulated gene expression associated with myeloid leukocyte activation; and Module 6, which was mainly enriched in lymphocytes, as reflected by interferon type I signalling pathways and SARS-CoV infection (Fig. 3a,b). We also identified six downregulated DEG modules, generally linked with tissue morphogenesis, structural integrity and homeostasis, including Module 7 (mainly attributed to epithelial cells) and Module 12 (mainly attributed to immune cells; Fig. 3a,b).
Fig. 3. Transcriptional characteristics of the lungs of patients with COVID-19.
a, Heatmap showing DEGs (|logFC| > 0.5, adjusted P < 0.05), which were clustered into 12 modules by k-means analysis, across different cell types in the lungs of the COVID-19 and Control groups. Modules 1-6 indicate the specific upregulated modules in the lungs of patients with COVID-19 (top) and modules 7-12 indicate the specific upregulated modules in Control lungs (bottom). Dotted lines represent different cell types (e.g. epithelial, endothelial, stromal or immune cells). b, GO term-enrichment analysis of DEGs from different modules as shown in a. Pathways of upregulated and downregulated DEGs are indicated in red and blue, respectively. c, Transcriptional network showing the core transcription factors identified based on COVID-19 DEGs using SCENIC. The outer nodes represent different cell types and the sizes of the outer nodes indicate the number of target genes involved in this cell type. The inner nodes represent upregulated and downregulated transcription factors. The intensities of the colours indicate the number of target genes regulated by these transcription factors. d, Violin plots showing the expression levels of NFKB1, HIF1A and FOXO3 in the lungs of the two study groups (top). Ridge maps showing the gene-set scores of targets genes of the same transcription factors (bottom). Cell-type abbreviations and colour codes as per Fig. 2a.
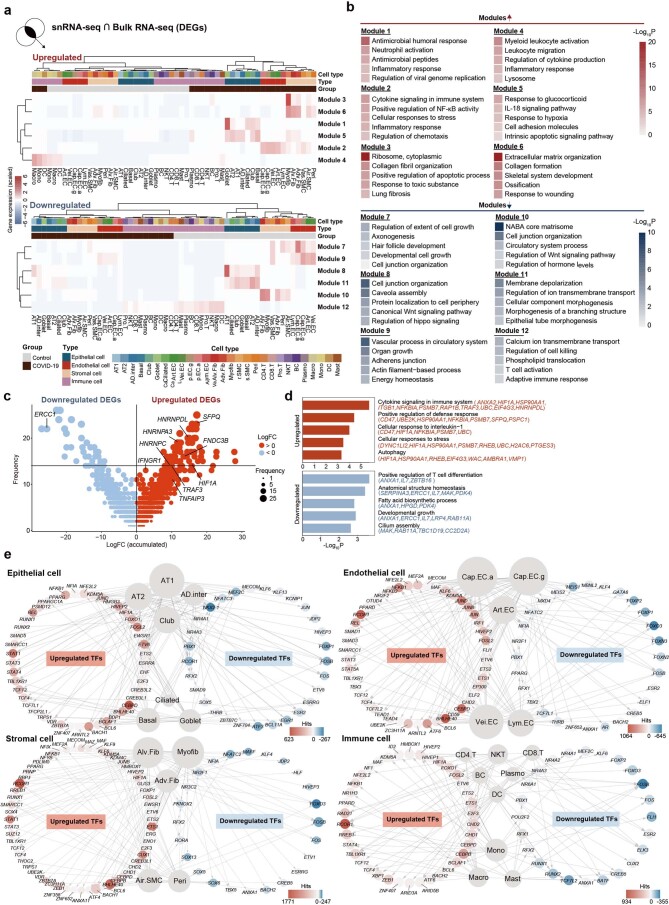
To discern how changes in cell type-specific gene expression contribute to the RNA profile of the lung as a whole, we jointly analysed DEGs obtained at single-cell and bulk levels (Extended Data Fig. 3a,b). We found that pro-fibrotic pathways (such as collagen-fibril organization and lung fibrosis) dominated in fibroblasts and myofibroblasts (Extended Data Fig. 3a,b). By comparison, cytokine, inflammatory and chemotaxis pathways were activated in endothelial cells (Extended Data Fig. 3a,b). In addition, hypoxia factor HIF1Α was associated with hypoxaemia in COVID-19, whereas the pro-inflammatory factors TRAF3 and IFNGR1 were augmented in multiple cell types (Extended Data Fig. 3c,d and Supplementary Table 4).
Extended Data Fig. 3. Global transcriptional changes underlying COVID-19 pulmonary pathobiology.
(a) Heatmaps showing DEGs shared by bulk RNA-seq and snRNA-seq data and clustered into modules by k-means analysis across different cell types in Control and COVID-19 lungs. (b) GO terms enrichment analysis of DEGs from different modules as shown in Extended Data Fig. 3a. Colour of red and blue indicates pathways of upregulated and downregulated genes, respectively. (c) Bubble plot showing the DEGs (|logFC | > 0.5, adjusted P value < 0.05) between COVID-19 and Control groups, with x-axis indicating the accumulated logFC from different cell types and y-axis representing their frequencies in different cell types. P values were determined using Wilcoxon signed-rank test. The red and blue nodes indicate the upregulated and downregulated DEGs, respectively. The node size from small to large indicates the low to high frequency of each DEG, respectively. (d) GO and pathway enrichment analysis of overlapped genes in more than 14 cell types between COVID-19 and Control DEGs. (e) Transcriptional network showing the core transcription factors (TFs) identified in snRNA-seq from different cell types by SCENIC analysis. The node size indicates the number of target genes in the indicated cell types.
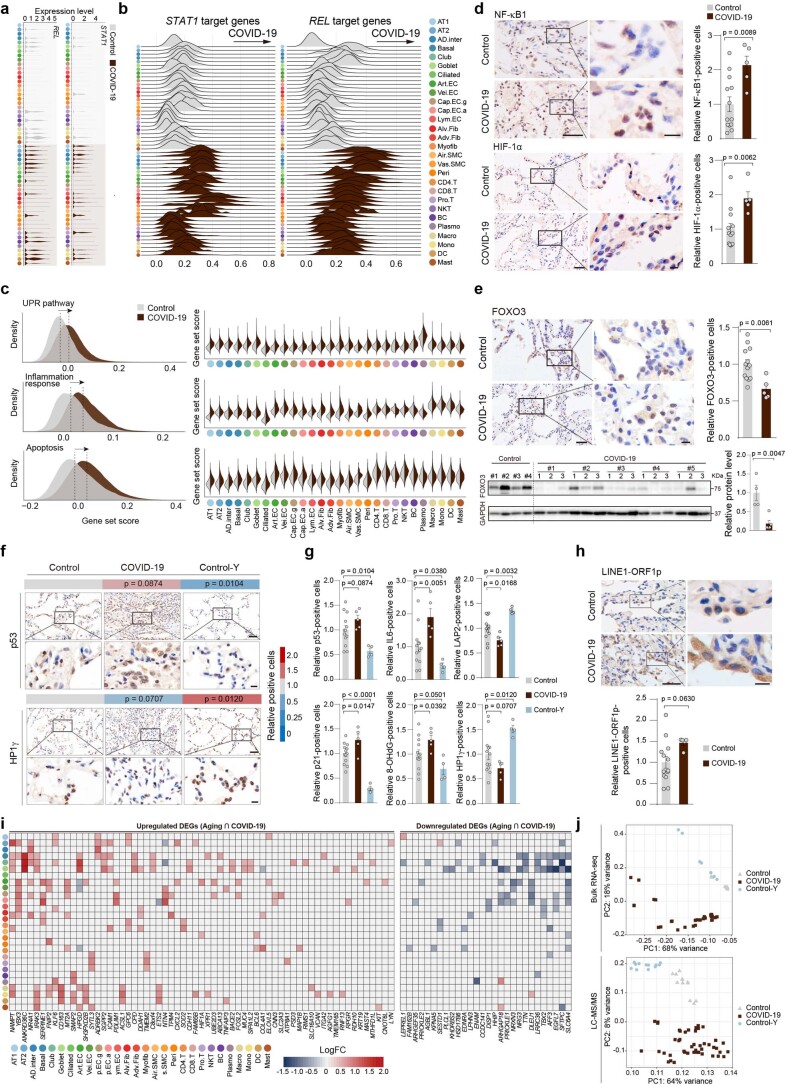
To dissect the transcriptional regulons underlying COVID-19 pathogenesis, we performed SCENIC analysis to identify candidate transcription factors governing DEGs across cell types. As expected, pro-inflammatory transcription factors-including NFKB1, REL, STAT1, -3, -4 and -5A as well as hypoxia regulator HIF1A, UPR regulator ATF6 and apoptosis regulator BCL6-were identified as regulatory nodes for upregulated DEGs (Fig. 3c,d, Extended Data Fig. 3e, 4a–c and Supplementary Table 3). Of these, we verified the upregulation of NF-κB1 and HIF-1α in the lungs of patients with COVID-19 by immunohistology (Extended Data Fig. 4d). By contrast, we identified FOXO3, a gene often implicated in tissue morphogenesis and regeneration13,14, as the top transcription regulator for downregulated COVID-19 DEGs (Fig. 3c,d and Extended Data Fig. 4e). These analyses highlight the multi-faceted consequences of COVID-19 and provide a molecular portrait of the pathology of the lungs of patients with COVID-19.
Extended Data Fig. 4. Transcriptional networks and core TFs implicated in COVID-19 lung pathology.
(a) Violin plots showing the expression levels of REL and STAT1 across different cell types in Control and COVID-19 lungs. (b) Ridge plots showing the gene set scores of targets genes of REL and STAT1. (c) Gene set scores of indicated pathways in all the cells (left) or different cell types (right) of Control and COVID-19 groups. (d) Immunostaining analysis of NF-κB1 (top), HIF-1α (bottom) in Control and COVID-19 lungs, respectively. Scale bars, 50 μm and 10 μm (zoomed-in image). Quantitative data are shown as mean ± s.e.m. Control, n = 13; COVID-19, n = 5 patients with samples from three lung lobes each. Two-tailed t-test P values are indicated. (e) Immunostaining (top) and Western blotting (bottom) analysis of FOXO3 in Control and COVID-19 lungs, Scale bars, 50 μm and 10 μm (zoomed-in image). Quantitative data are shown as mean ± s.e.m. Control, n = 13 for immunostaining and n = 4 for Western blotting; COVID-19, n = 5 patients with samples from three lung lobes each. Two-tailed t-test P values are indicated. (f) Immunohistochemical analysis of p53 and HP1γ in Control, COVID-19, and Control-Y lungs. Quantitative data are shown as the mean. Scale bars, 50 μm and 10 μm (zoomed-in image). Control, n = 13 lungs; COVID-19, n = 5 lungs with samples from three lung lobes each; Control-Y, n = 4 lungs. One-tailed t-test P values are indicated. (g) Quantitative data of immunostaining of senescence markers in lung tissues. Data are shown as mean ± s.e.m. Control, n = 13; COVID-19, n = 5 patients with samples from three lung lobes each, Control-Y, n = 4. One-tailed t-test P values are indicated. (h) Immunohistochemical staining of LINE1-ORF1p in Control and COVID-19 lungs. Scale bars, 50 μm and 10 μm (zoomed-in image). Quantitative data are shown as mean ± s.e.m. Control, n = 13; COVID-19, n = 5 patients with samples from three lung lobes each. Two-tailed t-test P values are indicated. (i) Heatmaps showing the upregulated and downregulated DEGs shared between aging and COVID-19 DEGs in different cell types. (j) PCA of RNA-seq (top) and LC-MS/MS (bottom) data for different samples from Control, COVID-19, and Control-Y lungs.
Senescence as a pathological characteristic of the lungs of patients with COVID-19
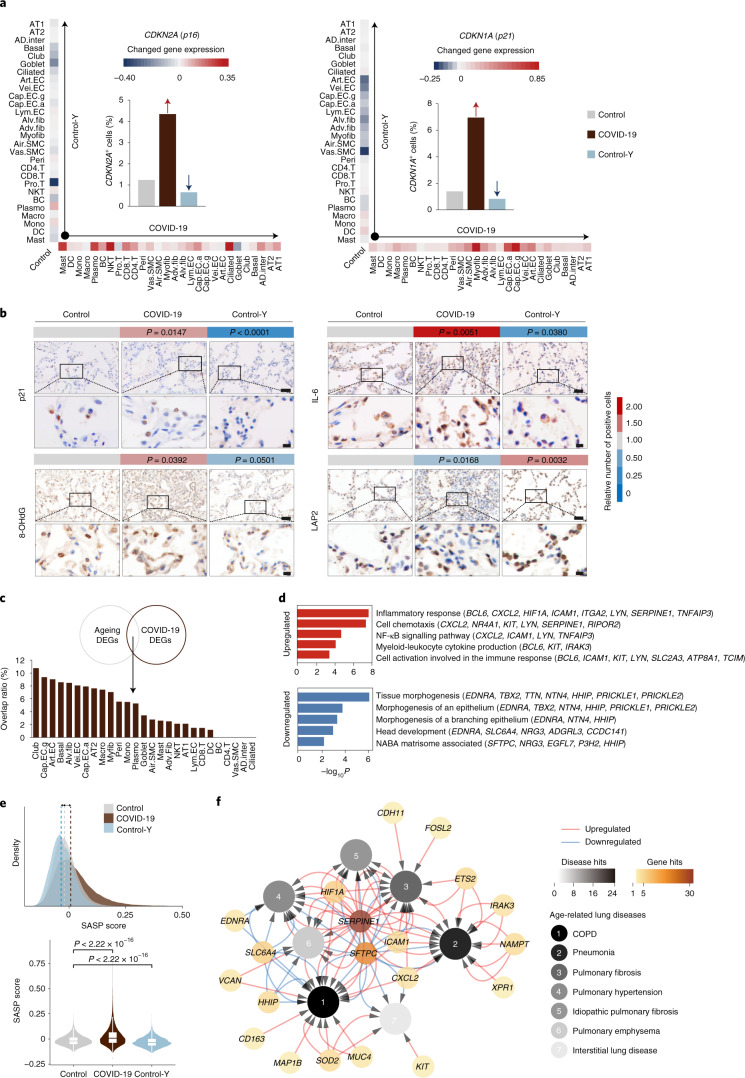
Previous studies suggest that SARS-CoV-2 infection triggers senescence in the immune system15,16. Here, when compared with samples from Control individuals, we found that p16, p21, IL-6 and p53 were upregulated along with an increase in the DNA oxidation marker 8-hydroxy-2′-deoxyguanosine (8-OHdG) in the lungs of patients with COVID-19 (Fig. 4a,b and Extended Data Fig. 4f,g). In addition, we detected a decrease in lamina-associated polypeptide 2 (LAP2) expression and a trend towards decreased expression of the heterochromatin-associated HP1γ (Fig. 4b and Extended Data Fig. 4f,g) along with an increasing trend of retrotransposable element LINE1-ORF1p expression, indicative of exacerbated lung senescence in patients with COVID-19 (Extended Data Fig. 4h)17–19.
Fig. 4. Dissection of the relationships between ageing and COVID-19 DEGs in human lungs.
a, Hallmarks of senescence. Heatmaps (periphery, along the y and x axes) showing the relative expression levels of CDKN2A (left) and CDKN1A (right) in each cell type in the lungs of the COVID-19 and Control-Y groups compared with the Control group. The proportions of CDKN2A- (left) and CDKN1A-positive (right) cells in the lungs of the COVID-19 and Control-Y groups compared the Control group are shown (bar graphs). b, Immunohistochemical analysis of p21, IL-6, 8-OHdG and LAP2 in the indicated groups. Scale bars, 50 μm (main images; top) and 10 μm (magnified images; bottom). Quantitative data are shown as the mean. Control, n = 13 lungs; COVID-19, n = 5 lungs, with samples from three lung lobes each; and Control-Y, n = 4 lungs. One-tailed Student’s t-test P values are indicated. c, Genes shared by the ageing and COVID-19 DEGs. The proportion of DEGs shared by the ageing and COVID-19 groups are shown for the different cell types. d, GO term and pathway enrichment analyses for genes shared by the ageing and COVID-19 DEGs. e, Ridge map showing the density of distribution of the SASP scores of all of the cells in the Control, COVID-19 and Control-Y lungs (top). The medians of SASP scores of different groups are indicated with vertical lines. Violin and box-and-whisker plot showing the SASP scores of the Control (n = 34,974 cells), COVID-19 (n = 73,116 cells) and Control-Y (n = 33,062 cells) lungs. The boxes in the box-and-whisker plots show the median (centre line) and the quartile range (25–75%), and the whiskers extend from the quartile to the minimum and maximum values. P values, determined using a Wilcoxon signed-rank test, are indicated. f, Network plot showing the genes that altered concomitantly in Control and COVID-19 lungs and genes in the age-related lung disease database (https://www.disgenet.org/home/). The white-to-black legend on the left indicates the number of genes- from low to high, respectively-related to the indicated diseases; whereas the white-to-dark brown legend on the right indicates the number of cell types expressing the indicated genes from low to high, respectively. COPD, chronic obstructive pulmonary disease. Cell-type abbreviations as per Fig. 2a.
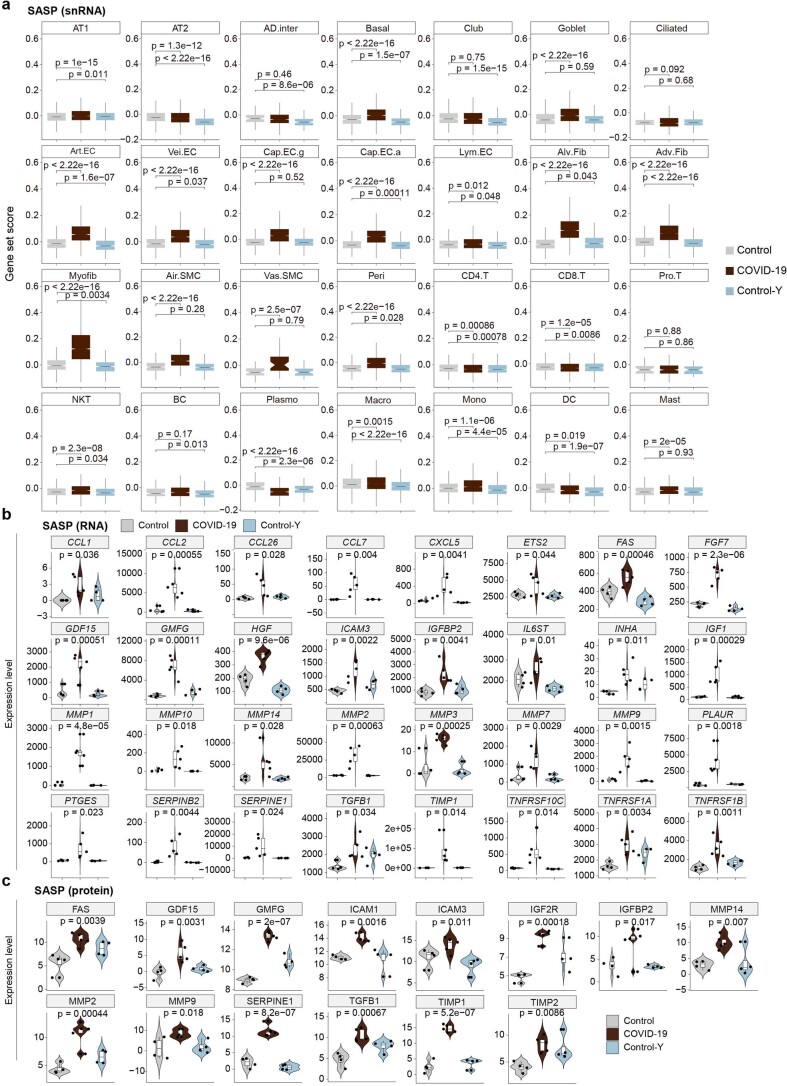
Given that earlier work highlighted cellular senescence in lung ageing20 and that in this study we detected multiple cellular senescence markers in the lungs of patients with COVID-19 (Fig. 4a,b and Extended Data Fig. 4f–h), we speculated that lung ageing might be aggravated by SARS-CoV-2 infection. Accordingly, we analysed ageing-associated DEGs (ageing DEGs) by comparing the snRNA-seq profiles of Control lung samples from young individuals (Control-Y) with Control samples (Fig. 4c). Next, we performed an integrated analysis and identified 91 genes that were shared by ageing DEGs and COVID-19 DEGs (Fig. 4c and Extended Data Fig. 4i). These DEGs were primarily associated with epithelial and endothelial cells (Fig. 4c), suggesting that these two cell types are more prone to manifest ageing-related changes in SARS-CoV-2-infected lungs. GO analysis showed that the downregulated DEGs were related to tissue morphogenesis, whereas the upregulated DEGs were mainly associated with the inflammatory response, cell chemotaxis and NF-κB signalling (Fig. 4d). Notably, in most cell types, we found ageing-associated senescence-associated secretory phenotype (SASP)-gene expression to be further elevated by COVID-19 (ref. 21), indicating that SARS-CoV-2 infection amplifies the pro-inflammatory microenvironment of the aged lung (Fig. 4e and Extended Data Figs. 4j, 5a–c). We further identified 20 genes that altered concordantly in the lungs of patients with COVID-19 and aged individuals, and genes underlying a variety of ageing-related lung disorders (Fig. 4f), suggesting that COVID-19 augments pulmonary senescence programmes, which in turn contribute to lung ageing and related disorders.
Extended Data Fig. 5. Cellular senescence in the lungs of patients with COVID-19.
(a) Gene set scores of SASP genes in different cell types from Control (n = 34,974 cells), COVID-19 (n = 73,116 cells), and Control-Y (n = 33,062 cells) groups. Box shows the median (centre line) and the quartile range (25-75%) and the whiskers extend from the quartiles to the minimum and maximum values. P values by Wilcoxon test are indicated. (b) Violin plots showing the SASP gene expression levels increased in the lungs of patients with COVID-19 compared to those in Control lungs. Control, n = 4 lungs; COVID-19, n = 5 lungs with samples from three lung lobes each; Control-Y, n = 4 lungs. Box shows the median (centre line) and the quartile range (25-75%) and the whiskers extend from the quartiles to the minimum and maximum values. P values from ANOVA are as indicated. (c) Violin plots showing the SASP protein expression levels increased in the lungs of patients with COVID-19 compared to those in Control lungs. Control, n = 4 lungs; COVID-19, n = 5 lungs with samples from three lung lobes each; Control-Y, n = 4 lungs. Box shows the median (centre line) and the quartile range (25-75%) and the whiskers extend from the quartiles to the minimum and maximum values. P values from ANOVA are as indicated.
Molecular signatures of epithelial damage in the lungs of patients with COVID-19
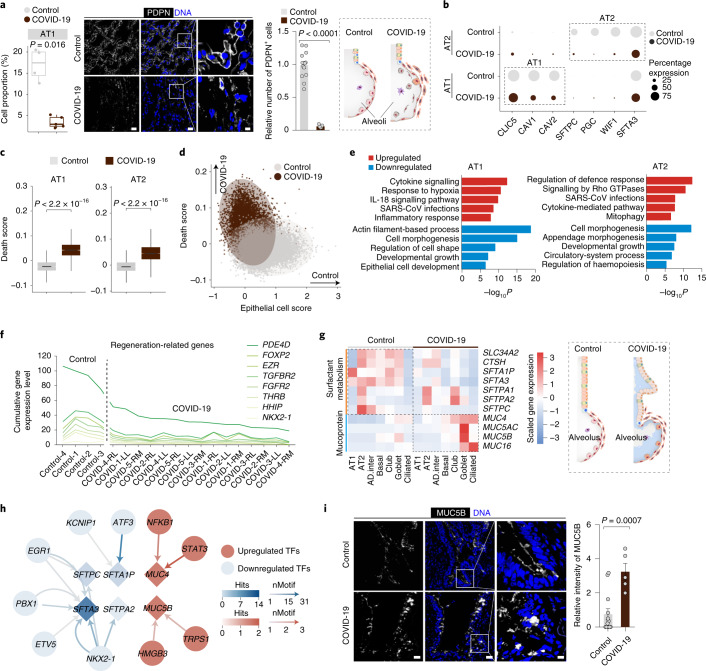
AT1 and AT2 cells, which both express ACE2, are the main targets of SARS-CoV-2 infection and their damage drives COVID‐19 pathogenesis2,4. Here we found an alarming disintegration of both the AT1 (P = 0.016) and AT2 (P = 0.19) populations, in line with the alveolar epithelium sloughing that we had defined histologically and confirmed by immunostaining with AT1- and AT2-specific markers (Fig. 5a and Extended Data Fig. 6a).
Fig. 5. Cellular and molecular features underlying diffuse alveolar damage in the lungs of patients with COVID-19.
a, Proportions of AT1 cells in the lungs of the Control (n = 4 donors) and COVID-19 (n = 5 donors) groups (left). Immunofluorescence analysis of PDPN in the lungs of the Control and COVID-19 groups (middle). Alveolar diagrams on the right showing the shedding of lung alveolar epithelial cells in patients with COVID-19. b, Proportions of cells expressing AT1- or AT2-representative markers (CLIC5, CAV1 and CAV2; and SFTPC, PGC, WIF1 and SFTA3, respectively) in the indicated samples. c, Death scores of AT1 and AT2 cells in Control (AT1, n = 5,918 cells; and AT2, n = 6,576 cells) and COVID-19 (AT1, n = 2,536 cells; and AT2, n = 8,612 cells) lungs. a,c, The boxes in the box-and-whisker plots show the median (centre line) and the quartile range (25-75%), and the whiskers extend from the quartiles to the minimum and maximum values. P values, determined using a Wilcoxon signed-rank test, are indicated. d, Gene-set scores of cell-death and epithelial cell markers in AT1 and AT2 cells in the lungs of the Control (n = 12,494 cells) and COVID-19 (n = 11,148 cells) groups. Each dot represents one cell. e, GO term and pathway enrichment analysis of COVID-19 DEGs in AT1 (left) and AT2 (right) cells. f, Expression levels of regeneration-related genes in the AT2 cells of COVID-19 and Control lungs. RL, right lower lobe; RM, right middle lobe; and LL, left lower lobe. g, Heatmap showing the expression levels of surfactant- and mucoprotein-related genes in Control and COVID-19 samples (left). Alveolar diagrams on the right show the accumulation of mucus in lung alveoli of patients with COVID-19. Cell-type abbreviations as per Fig. 2a. h, Network plot showing core transcription factors (TFs) in the regulation of surfactant-related COVID-19 DEGs in lung epithelial cells. The diamonds indicate the surfactant-related genes and the nodes denote transcription factors. nMotif denotes the number of motifs for each gene by the indicated transcription factor. i, Immunofluorescence analysis of MUC5B in the bronchiole and alveolar ducts of Control and COVID-19 lungs. a,i, Control, n = 13 lungs; and COVID-19, n = 5 lungs, with samples from three lung lobes each. Scale bars, 20 μm (main images) and 5 μm (magnified images). Quantitative data are shown as the mean ± s.e.m. Two-tailed t-test P values are indicated.
Extended Data Fig. 6. Cell proportion and gene expression changes of epithelial cells and immune cells in the lungs of patients with COVID-19.
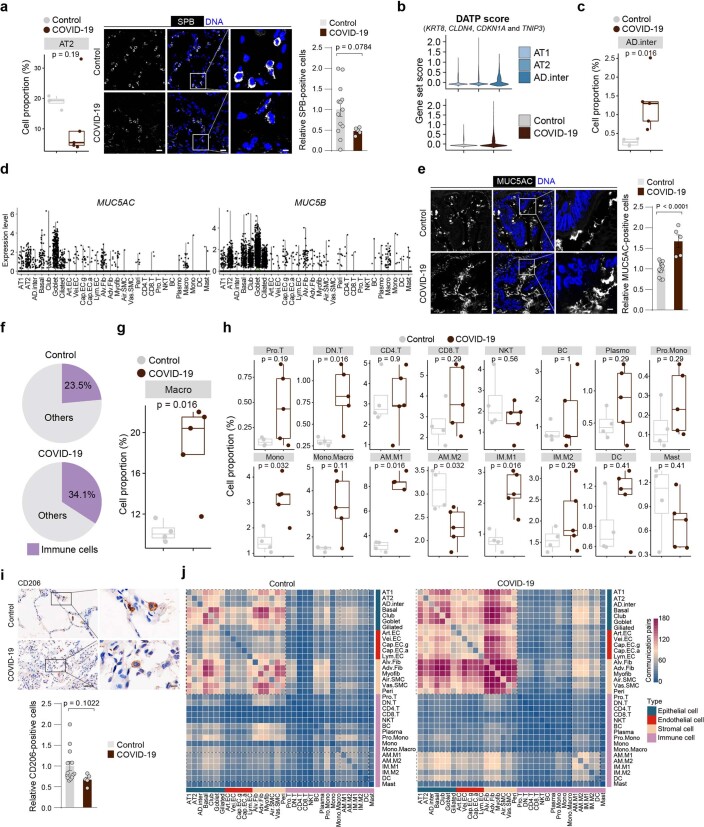
(a) Left, boxplot showing cell proportions of AT2 in Control (n = 4) and COVID-19 (n = 5) lungs. Box shows the median (centre line) and the quartile range (25-75%) and the whiskers extend from the quartiles to the minimum and maximum values with P values indicated (Wilcoxon test). Middle, immunofluorescence analysis of SPB in lungs. Scale bars, 20 and 5 μm (zoomed-in image). Right, quantitative data of relative SPB-positive cells shown as mean ± s.e.m with P values indicated (t-test). Control, n = 13 lungs; COVID-19, n = 5 patient lungs sampled from three lung lobes each. (b) Violin plots showing the damage-related transient progenitor (DATP) scores in AT1, AT2 and AD.inter. (top) along with those in Control and COVID-19 lungs (bottom). (c) Boxplot showing cell proportions of AD.inter in Control (n = 4) and COVID-19 (n = 5) lungs. Box shows the median (centre line) and the quartile range (25-75%) and the whiskers extend from the quartiles to the minimum and maximum values with P values indicated (Wilcoxon test). (d) Violin plots showing the levels of MUC5AC and MUC5B in human lungs. (e) Immunofluorescence analysis of MUC5AC in the bronchiole and alveolar ducts of lungs. Scale bars, 20 μm and 5 μm (zoomed-in image). Quantitative data are shown as mean ± s.e.m with P values indicated (t-test). Control, n = 13 lungs; COVID-19, n = 5 patient lungs sampled from three lung lobes each. (f) Pie plots showing cell proportions of immune cells in lungs. (g-h), Boxplots showing cell proportions of macrophages (g) or different immune cells (h) from Control (n = 4) and COVID-19 (n = 5) lungs. Box shows the median and the quartile range (25-75%) and the whiskers extend from the quartiles to the minimum and maximum values with P values indicated (Wilcoxon test). (i) Immunohistology analysis of macrophage marker CD206 in lungs. Scale bars, 50 μm and 10 μm (zoomed-in image). Quantitative data are shown as mean ± s.e.m with P values indicated (t-test). Control, n = 13 lungs; COVID-19, n = 5 patient lungs sampled from three lung lobes each. (j) Heatmaps showing the numbers of cell-cell communication pairs in lungs.
The remaining AT1 and AT2 cells expressed lower levels of cell type-specific marker genes along with an increased apoptotic rate (Fig. 5b-d). The AT1 population expressed high levels of genes associated with response to cytokine signalling (such as NFKB1, CXCL2, CXCL8 and STAT1, -3 and -4), response to hypoxia (such as HIF1A) and SARS-CoV infections (Fig. 5e and Supplementary Table 4). Similarly, the expression levels of genes involved in the regulation of the defence response (such as C3, CD47 and IFI16) and SARS-CoV infections were elevated in the remaining AT2 cells in the lungs of patients with COVID-19 (Fig. 5e and Supplementary Table 4). Specifically, SARS-CoV-2 infection in AT2 cells led to downregulation of regeneration-related genes critical for lung-injury repair (Fig. 5f). Furthermore, we found that alveolar differentiation intermediate cells (AD.inter), with an elevated damage-associated transient progenitors signature (KRT8 and CLDN4), was an intermediate cell type in a stagnant state during AT2-to-AT1 differentiation (Extended Data Fig. 6b)22. This cell type accumulated up to fivefold in the lungs of patients with COVID-19 relative to the controls (Extended Data Fig. 6c), demarcating dysregulated epithelial cell differentiation in the COVID-19 group6,23.
At the air–liquid interface, pulmonary epithelial cells secrete surfactants to reduce the pulmonary surface tension24. We detected lower levels of SFTPC, SFTA3 and SFTPA1 in different epithelial cell types in the lungs of patients with COVID-19 (Fig. 5g). Concomitant with the loss of surfactants, genes encoding MUC5AC, MUC5B, MUC4 and, MUC16 were highly expressed in airway epithelial cells (Fig. 5g and Extended Data Fig. 6d,e), possibly as a result of transcriptional regulation by factors such as NFKB1 and STAT3 (Fig. 5h). In agreement with these molecular changes, we detected mucus-plug formation (which could block the airway), as evidenced by haematoxylin-and-eosin staining and immunostaining in the lungs of patients with COVID-19 (Figs. 1b, 5i and Extended Data Fig. 6e). Together, our data show that SARS-CoV-2 infection is associated with epithelial cell apoptosis and functional decline, manifested as surfactant loss and mucus hypersecretion, hindering gas exchange and causing hypoxaemia in the lung.
Dissection of the immune-cell disorders in the lungs of patients with COVID-19
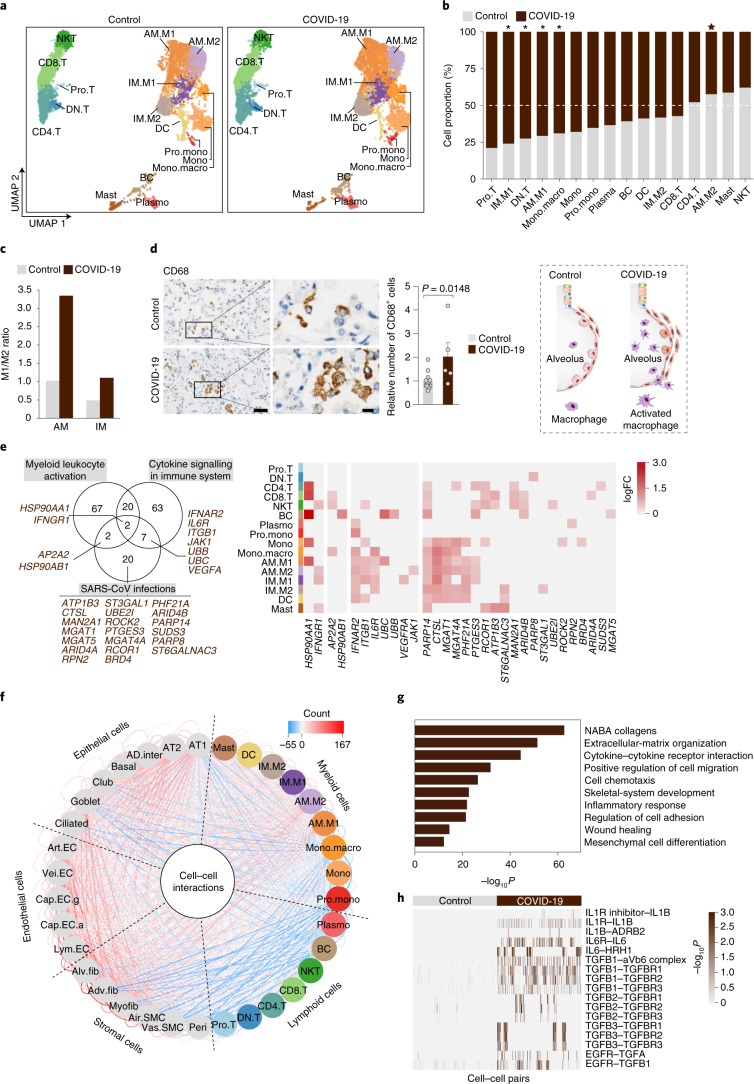
The combination of dysregulated immune responses and an excessive host defence response is considered to be an important cause of injury to the lungs of patients with COVID-19 (refs. 25–29). However, how immune cells are regulated in the parenchyma of the lung of patients with COVID-19 at the single-cell resolution remains largely unclear. To fill this knowledge gap, we profiled the 16 immune-cell types comprising the immune-cell landscape of the parenchyma of the lungs of patients with COVID-19 (Fig. 6a). Macrophages are known to play a pivotal role in COVID-19 lethality30. Consistent with the fulminant inflammatory infiltration present in the lungs of patients with COVID-19 (Fig. 1b and Extended Data Fig. 6f), the total macrophage population was enriched in the COVID-19 group (Fig. 6b,c and Extended Data Fig. 6f,g), as confirmed by immunostaining (Fig. 6d). To exert inflammation-regulatory roles, macrophages polarize to become either classic pro-inflammatory macrophages (M1) or anti-inflammatory macrophages (M2)31,32. Here we found that both M1 alveolar and M1 interstitial macrophage populations increased proportionally, whereas M2 alveolar macrophages decreased (Fig. 6c and Extended Data Fig. 6h,i), indicating a shift towards the M1 phenotype in response to SARS-CoV-2.
Fig. 6. The disturbed immune system in the lungs of patients with COVID-19.
a, UMAP plots showing immune cells in the lungs of the Control (left) and COVID-19 (right) groups; n = 8,000 cells each. b, Proportions of different immune cell types in the lungs of the Control and COVID-19 groups. Asterisks indicate significant differences in the cell proportions between the two groups. The dashed line denotes a cell proportion of 50%. c, M1/M2 ratios in alveolar (AM) and interstitial (IM) macrophages in the lungs of the Control and COVID-19 groups. d, Immunohistology analysis of the macrophage marker CD68 (left) in the lungs of the Control and COVID-19 groups. Scale bars, 50 μm (main images) and 10 μm (magnified images). Quantitative data are shown as the mean ± s.e.m. Control, n = 13 lungs; and COVID-19, n = 5 lungs, with samples from three lung lobes each. Two-tailed t-test P values are indicated. Alveolar diagrams showing the infiltration of immune cells and macrophage polarization in the lungs of patients with COVID-19 (right). e, Venn diagram showing the genes that are shared by the groups of genes related to ‘myeloid leukocyte activation’, ‘cytokine signalling in immune system’ and ‘SARS-CoV infections’ (left). Heatmap showing COVID-19 DEGs related to SARS-CoV infections in different immune cell types (right). f, Network showing the cell-cell communications across all cell types in the lungs of patients with COVID-19 compared with those in the Control group. Red lines indicate increased cell–cell interactions in the COVID-19 group. Blue lines indicate decreased cell-cell interactions in the COVID-19 group. g, GO term and pathway enrichment analysis of specific cell-cell communications in the lungs of patients with COVID-19. h, Heatmap showing the cell–cell communications in the lungs of patients with COVID-19 compared with the Control group. AM.M1, M1 alveolar macrophage; AM.M2, M2 alveolar macrophage; IM.M1, M1 interstitial macrophage; IM.M2, M2 interstitial macrophage; Pro.mono, proliferative monocyte; Mono.macro, mononuclear macrophage; DN.T, doublet negative (CD4-CD8-) T cells; and the remaining cell-type abbreviations as per Fig. 2a.
Similarly, the transcriptional profiles of other immune cells shifted to a more activated state, as indicated by elevated expression of genes related to myeloid-leukocyte activation, cytokine signalling and SARS-CoV infections (Fig. 6e). Among these, a panel of glycosylation genes essential for immune cell activation and host immune defence initiation, such as MGAT1, MGAT4A, MGAT5, PARP8, PARP14, RPN2, ST6GALNAC3 and ST3GAL1, were expressed at high levels in COVID-19 immune cells33, especially macrophages (Fig. 6e).
To further understand the pathological consequences of the dysregulated immune system, we analysed the cell-cell interactions between immune cells and other types of pulmonary cells (Fig. 6f and Extended Data Fig. 6j), and found increased pro-inflammatory (that is, cytokine–cytokine receptor interaction) and pro-fibrotic (that is, NABA-collagens) cell-cell interactions in the COVID-19 samples (Fig. 6g and Supplementary Table 5)34. For instance, the interactions of IL1B, IL6, and TGFB1, -2 and -3 with their receptors were augmented in the lungs of patients with COVID-19 (Fig. 6h). Together, these data suggest that an imbalanced host immune system worsens lung damage by releasing excessive cytokine factors that drive diffuse alveolar damage.
Characterization of the endotheliopathy in the lungs of patients with COVID-19
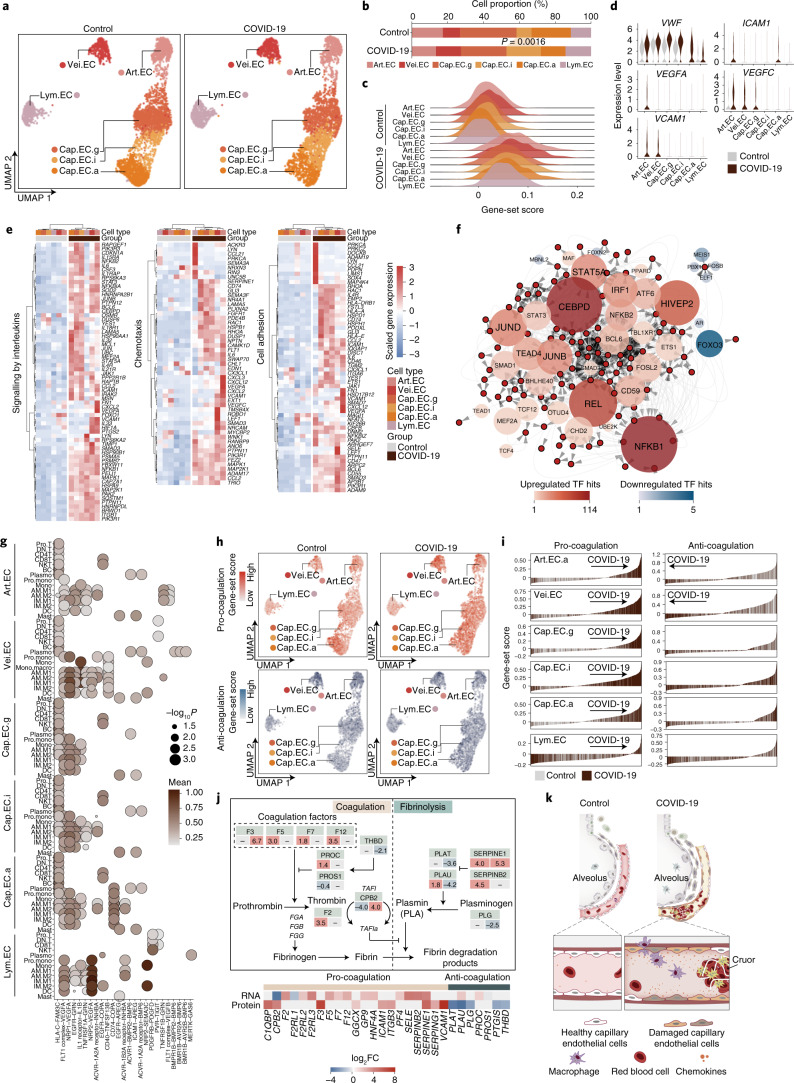
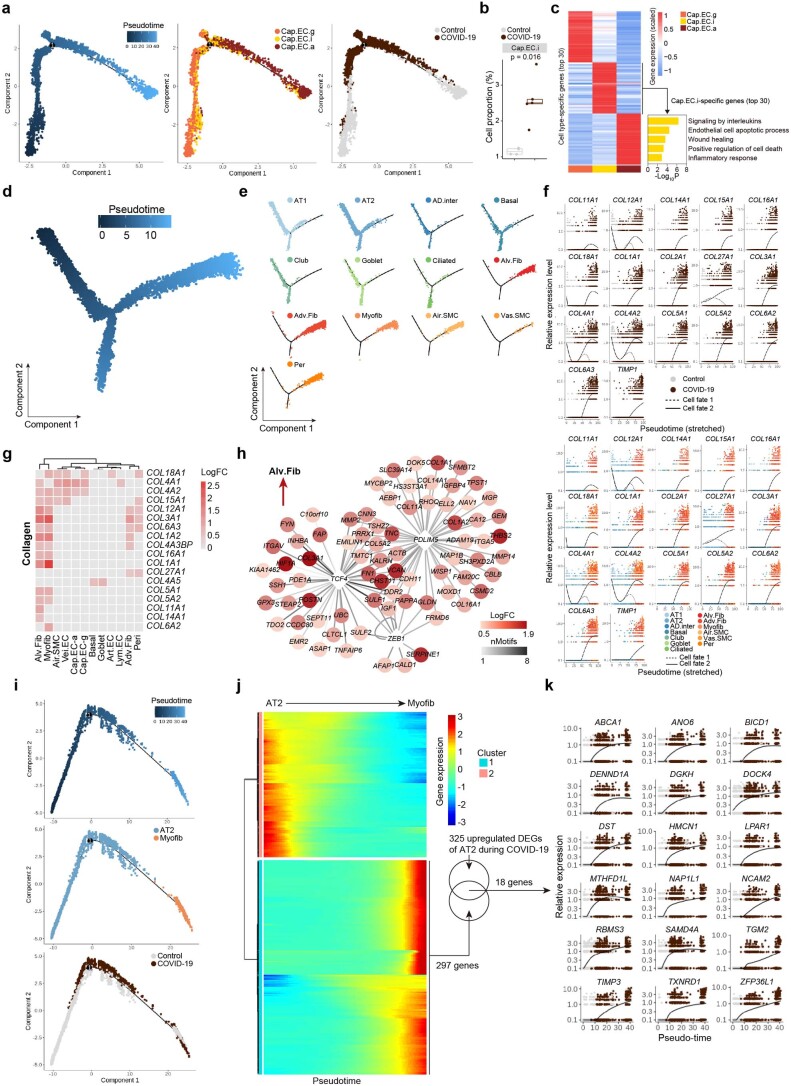
Endothelial cell dysfunction and impaired vascular function contribute to the COVID-19-associated complications with a high mortality risk such as coagulopathy and thrombosis35,36. To study the cell type-specific molecular basis of COVID-19-related vasculopathy, we divided pulmonary endothelial cells into six subtypes consisting of three alveolar-capillary cell types (Cap.EC.a, which is specialized for gas exchange; Cap.EC.g, which is involved in capillary regeneration; and Cap.EC.i, which is a capillary intermediate between the Cap.EC.a and Cap.EC.g states), pulmonary arterial endothelial cells (Art.EC), pulmonary vein endothelial cells (Vei.EC) and pulmonary lymphatic endothelial cells (Lym.EC; Fig. 7a)37. Both the Cap.EC.a and Cap.EC.g populations declined in the lungs of patients with COVID-19 (Fig. 7b), consistent with the compromised oxygen-exchange ability and hypoxaemia observed in these patients. Through pseudotime analysis, we uncovered a group of Cap.EC.i cells, occupying the trajectory between the Cap.EC.g and Cap.EC.a cells (Extended Data Fig. 7a), that accumulated to levels around twofold more in the lungs of patients with COVID-19 than in the controls (Extended Data Fig. 7b). Similar to that of the AT2-AD.inter-AT1 cell axis, the Cap.EC.i population, with high expression of endothelial inflammation- and damage-associated genes (IL6, SERPINE1 and TNFAIP3), appeared as an intermediate cell type during Cap.EC.g-to-Cap.EC.a differentiation in the lungs of patients with COVID-19 (Extended Data Fig. 7c).
Fig. 7. Molecular basis underlying pulmonary endotheliopathy in the lungs of patients with COVID-19.
a, UMAP plots showing subtypes of CLDN5+ endothelial cells in the lungs of the Control and COVID-19 groups; n = 4,500 cells in each. b, Proportions of endothelial cell subtypes in the lungs of the Control and COVID-19 groups. The P value, determined using a Wilcoxon signed-rank test, is indicated. c, Ridge map showing increased death scores in different endothelial cell subtypes in the lungs of patients with COVID-19 compared with those of the Control group. d, Expression levels of endothelial damage-related genes in different endothelial cell subtypes. e, Heatmaps showing the upregulated COVID-19 DEGs related to inflammation in the different endothelial cell subtypes. f, Reconstruction of the transcriptional regulon network linking core regulatory transcription factors to potential target genes of the indicated pathways. g, Cell-cell interactions between immune cells and various endothelial cell subtypes. h, UMAP plots showing the expression levels of genes related to pro- (top) and anti-coagulation (bottom) in different endothelial cell subtypes in the lungs of the Control and COVID-19 groups. i, Gene-set core analysis of pro- (left) and anti-coagulation (right) pathways in individual cells of distinct endothelial cell subtypes. j, Diagram of the coagulation (left) and fibrinolysis (right) pathways (top). The values below the gene names indicate the log2FC value at the RNA (left) and protein (right) levels. Heatmap showing the expression levels of the indicated genes in the lungs of patients with COVID-19 (bottom). k, Schematic showing the vascular pathological changes in the lungs of patients with COVID-19. AM.M1, M1 alveolar macrophage; AM.M2, M2 alveolar macrophage; IM.M1, M1 interstitial macrophage; IM.M2, M2 interstitial macrophage; Pro.mono, proliferative monocyte; Mono.macro, mononuclear macrophage; and the remaining cell-type abbreviations as per Fig. 2a.
Extended Data Fig. 7. Transcriptomic signatures of endothelial cells and molecular hints for lung fibrosis in COVID-19.
(a) Left, pseudotime scores of capillary endothelial cells in human lung tissues. Middle, pseudotime trajectory of different capillary endothelial cell subtypes. Right, pseudotime trajectory of capillary endothelial cells from Control and COVID-19 samples. Cells are coloured by different cell types (middle) and groups (right). (b) Boxplot showing cell proportions of Cap.EC.i from Control (n = 4 donors) and COVID-19 (n = 5 donors) lungs. Box shows the median (centre line) and the quartile range (25-75%) and the whiskers extend from the quartiles to the minimum and maximum values. P values by Wilcoxon test are indicated. (c) Left, heatmap showing the gene expression signatures of the top 30 marker genes corresponding to each capillary endothelial cell type in human lungs. Right, bar plot showing the GO-term enrichment analysis of marker genes for Cap.EC.i. (d) Pseudotime scores of epithelial cells and stromal cells in human lung tissues. (e) Distributions of different epithelial cells and stromal cells in human lung tissues in pseudotime trajectory. (f) The relative gene expression patterns of the indicated genes over pseudotime of cell fate 1 (AT1) and cell fate 2 (myofib) in Control and COVID-19 lungs. Cells are coloured by groups (top) and different cell types (bottom). (g) Heatmap showing the expression signatures of collagen-related DEGs between COVID-19 and Control groups in different cell types. (h) Transcriptional network showing the core TFs identified in snRNA-seq from myofibroblasts by SCENIC analysis. (i) Pseudotime trajectory analysis of AT2 and myofibroblast in human lung coloured by pseudotime score, cell type and sample group. (j) Heatmap showing differentially expressed genes (q-value < 0.01) along the trajectory from AT2 to myofibroblast. (k) The relative gene expression patterns of the indicated genes along the pseudotime.
Apoptosis pathways were highly activated in all of the examined endothelial cell subtypes, underscoring the high vulnerability of endothelial cells in COVID-19 (Fig. 7c). Concomitantly, endothelial-damage markers, including VWF, ICAM1 and VCAM1, were upregulated in most endothelial cell types, reflecting massive endothelial injury (Fig. 7d)38,39. We also observed that a panel of interleukins, chemokines, interferon and other inflammatory factors along with upregulated inflammation-related transcription factors, such as NFKB1 and STAT3, were highly expressed in SARS-CoV-2-infected endothelial cells (Fig. 7e). Specifically, SCENIC analysis pinpointed NFKB1, REL and CEBPD as master regulators underlying SARS-CoV-2 vascular damage (Fig. 7f). Analysis of the cell–cell interactions revealed the interactions between VEGFA and its receptors FLT1 (VEGFR1), NRP1 and NRP2—essential for angiogenesis and vascular permeability-to be enhanced in endothelial and myeloid cells40,41 (Fig. 7g), delineating how SARS-CoV-2 leads to dysregulated angiogenesis of endothelial cells, a signature feature of COVID-19 (ref. 42).
Endothelial inflammation is associated with an increased risk of triggering excessive activation of coagulation43. Here we found increased VWF production in damaged endothelial cells (Fig. 7d), thereby probably activating and mediating platelet adhesion and thus triggering coagulation cascades and the formation of blood clots44. When we evaluated the expression of coagulation- and fibrinolysis-related genes in endothelial cells, we found that the coagulation pathway-associated genes were highly activated in all vascular endothelial cell types derived from the lungs of patients with COVID-19 (Fig. 7h–j), in accordance with the occurrence of systemic microangiopathy in COVID-19 pneumonia45. These data point to a working model of how SARS-CoV-2 infection progressively causes endothelial injury and widespread endotheliopathy (Fig. 7k).
Accumulation of myofibroblasts in the lungs of patients with COVID-19
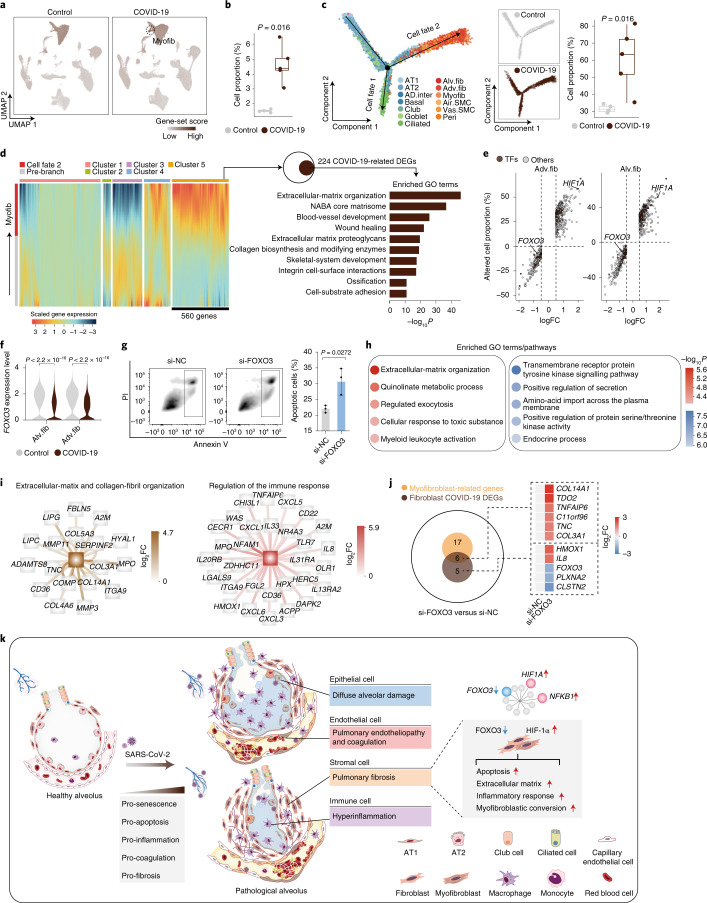
The cellular and molecular mechanisms that cause severe pulmonary fibrosis in COVID-19 infection are largely unknown. Our joint analysis of bulk-RNA-seq and snRNA-seq data suggest that fibroblasts and myofibroblasts at least partially increase the pro-fibrotic response in the lungs of patients with COVID-19 (Extended Data Fig. 3d,e). Furthermore, a larger number of fibroblasts produce extracellular matrix (Fig. 8a) and similarly, myofibroblasts-known to drive lung fibrosis-increased by about threefold and were also more proliferative in the lungs of patients with COVID-19 (Fig. 8b). Pseudotime analysis predicted that the majority of myofibroblasts originated from fibroblasts, with fewer arising from smooth muscle cells, pericytes and AT2 cells (Fig. 8c and Extended Data Fig. 7d–k). The fate 2 cells represent pulmonary cells that could possibly convert into myofibroblasts, following a differentiation trajectory from epithelial cells, stromal cells and fibroblasts (with relatively low collagen expression) to myofibroblasts (with relatively high collagen expression). The number of fate 2 cells doubled in the lungs of patients with COVID-19 compared with the controls (Fig. 8c and Extended Data Fig. 7f,g). By employing trajectory-based differential expression analysis, we identified 560 upregulated genes related to myofibroblast formation, 224 of which were also upregulated in the lungs of patients with COVID-19 (Fig. 8d). These genes included key fibrogenic factors (TIMP1 and PDLIM5) and 16 collagen genes known as molecular drivers underlying myofibroblast formation (Extended Data Fig. 7f–h). In addition, HIF-1α was identified as a top upregulated transcription factor in the lung fibroblasts of patients with COVID-19 (Fig. 8e and Extended Data Fig. 8a)46.
Fig. 8. Activation of myofibroblasts eliciting the pathobiology of pulmonary fibrosis.
a, UMAP plots showing the gene-set scores of extracellular matrix-related genes in Control (left) and COVID-19 (right) lungs. b, Proportions of myofibroblasts in the lungs of individuals in the Control and COVID-19 groups. c, Pseudotime trajectory analysis of epithelial and stromal cells in Control and COVID-19 samples (left). Proportions of cells in cell fate 2 (except for myofibroblasts) from the Control and COVID-19 groups (right). b,c, Cell-type abbreviations as per Fig. 2a. Controls; n = 4 donors; and COVID-19; n = 5 donors. The boxes in the box-and-whisker plots show the median (centre line) and the quartile range (2575%) and the whiskers extend from the quartile to the minimum and maximum values. P values, determined using a Wilcoxon signed-rank test, are indicated. d, Heatmap showing the top 2,000 DEGs in cell fate 2 during pseudotime trajectory (left). GO analysis of the genes that overlap between upregulated DEGs implicated in myofibroblast formation (cluster 5) and COVID-19 DEGs. e, Relative cell proportions and gene expression levels of Adv. fib (left) and Alv. fib (right) in the lungs of patients with COVID-19 compared with those in the Control group. TFs, transcription factors. f, Expression levels of FOXO3 in the lung fibroblasts of the Control and COVID-19 groups. P values, determined using a Wilcoxon signed-rank test, are indicated. g, Apoptosis analysis of human fibroblasts following FOXO3 knockdown (si-FOXO3) by flow cytometry. Quantitative data are shown as the mean ± s.e.m. of n = 3 biologically independent samples per condition. The two-tailed t-test P value is indicated; si-NC, siRNA to a negative control duplex. h, GO term and pathway enrichment analysis of DEGs following FOXO3 knockdown in human fibroblasts. Red denotes upregulation and blue denotes downregulation. i, Network plots showing DEGs related to the indicated terms and pathways following FOXO3 knockdown in human fibroblasts. j, Venn diagram showing the genes shared by the DEGs following FOXO3 knockdown in human fibroblasts, COVID-19 DEGs in fibroblasts and myofibroblast-related genes (left). Myofibroblast-related genes were defined as myofibroblast-marker genes and upregulated genes implicated in myofibroblast formation based on pseudotime analysis. Heatmap showing the relative expression levels of the indicated genes (right). k, Schematic showing the systemic pathological changes in the lung tissues of patients with COVID-19.
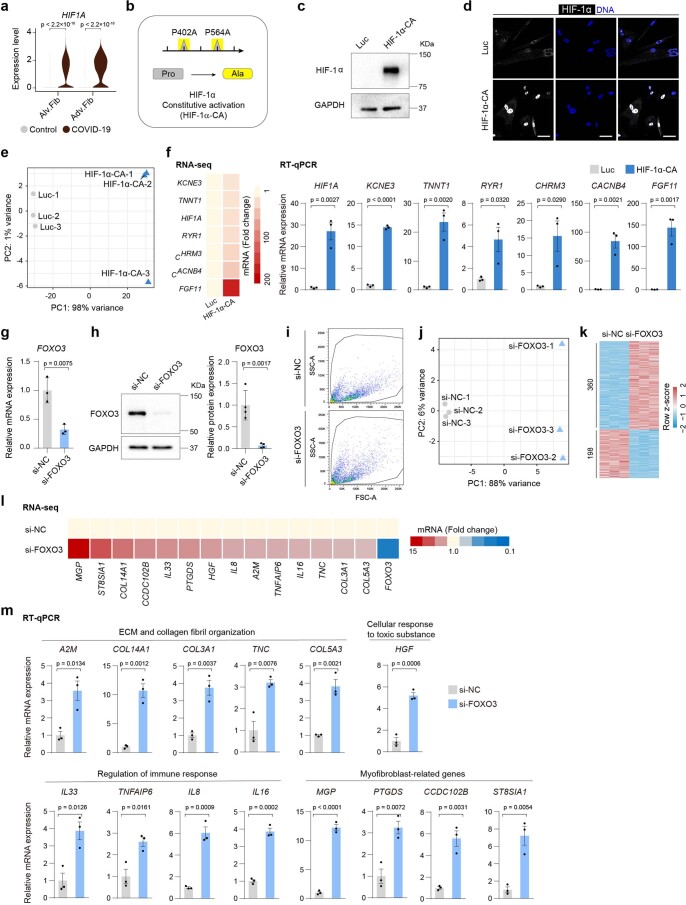
Extended Data Fig. 8. Constitutive activation of HIF-1α and knockdown of FOXO3 in human lung fibroblasts.
(a) Violin plot showing the gene expression levels of HIF1Α in fibroblasts from Control and COVID-19 lungs. P values by Wilcoxon test are indicated. (b) Schematic illustration showing the strategy of constitutive activation of HIF-1α. (c) Western blot showing the increased protein levels of HIF-1α after lentiviral transduction of HIF-1α-CA expressing vectors in human fibroblasts for three days. The experiment was repeated three times independently with similar results. (d) Immunofluorescence analysis of HIF-1α in human fibroblasts upon HIF-1α-CA overexpression. Scale bars, 50 μm. The experiment was repeated three times independently with similar results. (e) PCA of samples of human fibroblasts upon the transduction with Luc or HIF-1α-CA lentiviral vectors for six days. (f) Heatmap (left) and bar plots (right) showing the expression levels of indicated genes in human fibroblasts after lentiviral transduction of HIF-1α-CA for six days by RNA-seq (left) and RT-qPCR (right). Quantitative data are shown as mean ± s.e.m. n = 3 biologically independent samples per condition. Two-tailed t-test P values are indicated. (g) RT-qPCR analysis of FOXO3 in human fibroblasts upon FOXO3 knockdown. Cells were transfected with indicated siRNAs for three days. Quantitative data are shown as mean ± s.e.m. n = 3 biologically independent samples per condition. Two-tailed t-test P values are indicated. (h) Left, western blot showing the decreased protein levels of FOXO3 upon FOXO3 knockdown with siRNA. Right, the quantitative data are shown as mean ± s.e.m, n = 4 biologically independent samples per condition. Two-tailed t-test P values are indicated. (i) Gating strategy for the apoptosis analysis for human fibroblasts upon FOXO3 knockdown. (j) PCA of samples of human fibroblasts transfected with si-Negative Control (si-NC) and si-FOXO3 duplex for six days. (k) Heatmap showing the numbers and expression levels of DEGs upon FOXO3 knockdown identified by RNA-seq. (l) Heatmap showing the transcript levels of indicated DEGs by RNA-seq analysis. (m) Transcript level analysis of indicated genes in human fibroblasts upon FOXO3 knockdown by RT-qPCR. Quantitative data are shown as mean ± s.e.m, n = 3 biologically independent samples per condition. Two-tailed t-test P values are indicated.
Next, we employed gain-of-function and loss-of-function experiments in fibroblasts to manipulate transcriptional programmes accounting for the pathology of the lungs of patients with COVID-19. When profiling primary human lung fibroblasts expressing constitutively active HIF-1α (Extended Data Fig. 8b–d), we found that some of the DEGs were related to COVID-19 pathology (Extended Data Fig. 8e,f and Supplementary Table 6), suggesting that excessively activated HIF-1α is an upstream contributing factor to driving fibroblast malfunction in COVID-19. We also observed decreased levels of FOXO3 expression in COVID-19 fibroblasts (Fig. 8e,f), a molecular phenotype implicated in idiopathic pulmonary fibrosis47. When we used short interfering RNA (siRNA) to knock down FOXO3 in primary human lung fibroblasts, we observed increased cell apoptosis (Fig. 8g and Extended Data Fig. 8g-i). Genes that were upregulated following FOXO3 repression included those related to extracellular-structure organization, collagen-fibril organization and regulation of the immune response (Fig. 8h,i and Extended Data Fig. 8j–m). Notably, a series of myofibroblast-marker genes (COL14A1 and COL3A1) were induced in FOXO3-deficient fibroblasts (Fig. 8j, Extended Data Fig. 8l,m and Supplementary Table 6). These findings support the role of FOXO3 silencing in mediating pro-fibrotic and pro-inflammatory effects in the lungs of patients with COVID-19.
Discussion
Here we combined single-nucleus transcriptomics, bulk transcriptomics, proteomics and a battery of verification experiments to generate a comprehensive reference chart for studying the pathobiology of COVID-19 (Fig. 8k). In addition, we defined parenchymal lung senescence as a marked feature of COVID-19 pathology. Notably, the accumulation of SASP factors may also account for COVID-19-related cytokine storms and long-term lung sequelae, such as pulmonary fibrosis. Together, these relationships suggest that the alleviation of lung senescence might have potential as an intervention approach in patients infected with COVID-19 (ref. 48). Recent studies indeed indicate that senolytic drugs (compounds that eliminate senescent cells) may reduce both macrophage infiltration and inflammation, thereby alleviating COVID-19 syndrome49–51.
At the inception of our study, with both the limited number of available donors and the previously identified relevance of ageing-related changes to COVID-19 pathology considered, we selected COVID-19 samples based on age range rather than virus exposure time, length of hospital stay or other medical conditions. Given the demarcated differences, we were able to delineate the cellular and molecular changes associated with the lung pathology at the single-cell resolution, despite the existing heterogeneity between the COVID-19 samples. Thus, our study remains a valuable resource for understanding the disease mechanisms underlying SARS-CoV-2 infection of the human lung and lays a foundation for discovering biomarkers and developing treatment strategies for COVID-19.
Methods
Ethics statement
This research was executed in line with the Ethical Principles and was approved in advance by the Biomedical Research Ethics Committee of the Institute of Zoology of the Chinese Academy of Sciences, Southwest Hospital of Third Military Medical University (TMMU). The human lung tissues were obtained under the approval given by the Research Ethics Committee of Huoshenshan Hospital, Southwest Hospital of TMMU and the First Hospital of Kunming Medical University. The donors (or their relatives) of the lung samples used in this study provided written informed consent. Detailed information on the samples used can be found in Supplementary Table 1.
Human samples
The lung specimens of patients with COVID-19 were derived from autopsies of five patients with COVID-19 from Huoshenshan Hospital2. The autopsy materials were collected shortly after the death of the decedents. Exclusion criteria included a post-mortem interval > 18 h. Tissues of three lung lobes (right lower lobe, right middle lobe and left lower lobe) from each patient were either snap-frozen and stored at −80 °C or immediately fixed in 4% (wt/vol) formaldehyde solution. All of the decedents met the diagnostic criteria for COVID-19, and the presence of SARS-CoV-2 in all cases was confirmed by digital droplet PCR (ddPCR) tests and immunohistochemistry staining of spike glycoprotein (Supplementary Table 1). Basic patient information and clinical data are summarized in Supplementary Table 1. As controls, human lung tissues were collected from young and old (Control-Y and Control) patients with pulmonary bulla or lung cancer. All of the samples were evaluated by pathological examination to confirm their absence of obvious disease features such as inflammation before downstream analyses. The Control individuals were selected to match the gender and age distribution of patients with COVID-19 involved in this study.
Haematoxylin-and-eosin staining
Haematoxylin-and-eosin staining was conducted as previously described52. Tissues were dehydrated using an ethanol gradient, paraffin-embedded and then sectioned at a thickness of 5 μm. The sections were deparaffinized using xylene, hydrated using an ethanol gradient (100, 100, 95, 85, 75 and 50%), stained with haematoxylin for 2 min, differentiated with 1% hydrochloric acid ethanol for 3 s, stained with eosin for 2 min and rinsed with running water. Finally, the tissues were dehydrated in an ethanol gradient and xylene before being fixed with cytoseal-60 (Stephens Scientific).
Artificial intelligence-based automatic assessment platform for lung pathology analysis
We used datasets that manually label each category of lung slices of the lungs of patients with COVID-19 (mucus, serous, blood vessel, bronchus and cell exudation) to train a semantic segmentation algorithm based on deep learning, which establishes an automatic quantitative model of lung digital pathology. The percentage of each category of the target slice in the slice area was calculated by the model. The slice was binarized to delete the blank area of the slice. The proportion of interstitial components in the slice was obtained by subtracting each area category from the slice area after binarization treatment. The proportion of fibrosis was obtained by subtracting the proportion of normal lung tissue from the proportion of interstitial components in the target slice. The results of the lung pathology analysis are shown in Supplementary Table 1.
Immunofluorescence
Immunofluorescence staining was performed as previously described53. Paraffin-embedded sections were deparaffinized and rehydrated. After being rinsed in distilled water, the sections were microwaved five times, 5 min each time, in 10 mM sodium citrate buffer (pH 6.0). Once the sections had cooled down to room temperature (RT), they were permeabilized with 0.4% Triton X-100 (Sigma) in PBS for 60 min and then blocked with 5% donkey serum in PBS for 1 h at RT, followed by overnight incubation with primary antibodies at 4 °C and fluorescence-labelled secondary antibodies for 1 h at RT. The nuclei were counterstained with Hoechst 33342 (Thermo Fisher Scientific) before the sections were mounted in VECTERSHIELD anti-fading mounting medium (Vector Laboratories, h-1000). Images were captured using a confocal laser scanning microscope (IXplore SpinSR, Olympus). The antibodies used are listed in Supplementary Table 8.
Immunohistochemistry
Immunohistochemistry staining was performed as previously described10. Briefly, paraffin-embedded sections were deparaffinized and rehydrated, followed by antigen retrieval as described in the ‘Immunofluorescence’ section. After the sections had cooled down to RT, they were penetrated with 0.4% Triton X-100 and incubated with 3% H2O2 for 20 min for the inactivation of endogenous peroxidase. The sections were then blocked with 5% donkey serum in PBS for 1 h and incubated with primary antibodies at 4 °C overnight. The sections were then incubated with horseradish peroxidase-conjugated secondary antibodies for 1 h at RT, followed by colorimetric detection using DAB and counterstaining with haematoxylin. Finally, the sections were dehydrated before being mounted in neutral resinous mounting medium. Images were captured using an Olympus VS200 system. The antibodies used are listed in Supplementary Table 8.
TUNEL staining
Terminal deoxynucleotidyl transferase dUTP nick end labelling (TUNEL) staining was performed as previously described54. Briefly, paraffin-embedded sections were deparaffinized and rehydrated, and then TUNEL staining was performed following the manufacturer’s protocol using a one-step TUNEL apoptosis assay kit (C1088, Beyotime).
Cell culture
Human lung fibroblasts (2BS) were provided by T.-J. Tong and Z.-Y. Zhang from Peking University in China55. The cells were cultured in RPMI 1640 medium (Thermo Fisher Scientific) supplemented with 10% fetal bovine serum (Gibco), 100 U ml−1 penicillin and 10 mg ml−1 streptomycin (Thermo Fisher Scientific) in 5% CO2 at 37 °C. When they reached 80% confluency, the cells were collected with 0.25% trypsin and then passaged at a ratio of 1:2. All of the cell cultures tested negative for mycoplasma contamination.
FOXO3 knockdown in human lung fibroblasts
Short interfering RNAs targeting FOXO3 messenger RNA were purchased from RIBOBIO. The sequences are listed in Supplementary Table 7. The negative control duplex (RIBOBIO) was not homologous to any known mammalian genes52. Cells were transfected with the negative control duplex or siRNAs against FOXO3 using Lipofectamine RNAiMAX transfection reagent (Thermo Fisher Scientific) following the manufacturer’s instructions. At 72 h after the transfection, the cells were collected for reverse transcription-quantitative PCR (RT-qPCR) and western blotting. At six days after the transfection, the cells were collected for either RNA-seq or apoptosis analysis.
Construction of an expression vector encoding constitutively active HIF-1α
The PLE4-HIF-1α overexpression vector was constructed by replacing the green fluorescence protein (GFP) sequence of the origin vector (PLE4-GFP, a gift from T. Hishida) with the HIF-1α complementary DNA sequence. Next, a site-directed mutagenesis kit (TRAN, FM111-01) was used to generate the constitutively active mutant of HIF-1α (HIF-1α-CA) containing two mutation sites, P402A and P564A, following the manufacturer’s instructions56. The primers used for cloning the HIF-1α cDNA sequence and introduction of HIF-1α mutations are listed in Supplementary Table 7.
Lentivirus production
Lentiviruses were produced as previously described57. HEK293T cells (originating from the American Type Culture Collection) were transfected with lentiviral vectors for protein overexpression along with the packing plasmids psPAX2 and pMD2.G. The supernatant containing the lentiviral particles was collected at 48 and 60 h after the transfection and mixed before ultracentrifugation at 19,400g for 2.5 h at 4 °C.
RNA isolation and analyses
Total RNA was extracted from tissues or cells using TRIzol (Thermo Fisher Scientific, 15596018). The GoScript reverse transcription system (Promega) was then used to reverse-transcribe cDNA. RT-qPCR was conducted using the iTaq Universal SYBR Green SuperMix (Bio-Rad) on a CFX384 real-time PCR system (Bio-Rad). For each gene, the relative mRNA expression level was normalized to the expression level of GAPDH (Extended Data Fig. 8g,m) or 18S (Extended Data Fig. 8f), as appropriate, calculated using the ∆∆Cq method. The ddPCR examination for virus from tissue biopsies was performed as previously described4. Briefly, ddPCR assays were performed on an QX200 AutoDG droplet digital PCR system (Bio-Rad) with a One-step RT-ddPCR advanced kit (Bio-Rad, 186-4021) according to the manufacturer’s instructions. The primer and probe sequences of SARS-CoV-2 were obtained from the National Institute for Viral Disease Control and Prevention (http://nmdc.cn/#/nCoV). All of the primers and probes that were used are listed in Supplementary Table 7. For the bulk RNA-seq, sequencing libraries were prepared using a NEBNext UltraTM RNA library prep kit for Illumina and individually indexed. The resulting libraries were analysed on an Illumina paired-end sequencing platform by 150-base-pair read length by Novogene Bioinformatics Technology Co. Ltd.
Western blot analysis
Western blotting was performed as previously described10. Briefly, the protein concentrations were determined using a BCA kit. The protein lysates were subjected to SDS-PAGE and electrotransferred to a polyvinylidene fluoride membrane (Millipore). The membrane was blocked in blocking buffer, incubated overnight with primary antibodies at 4 °C and then with horseradish peroxidase-conjugated secondary antibodies before visualization on a ChemiDoc XRS system (Bio-Rad). Band quantification was performed using the Image Lab software. The antibodies used are listed in Supplementary Table 8.
Flow-cytometry analysis
Apoptosis analysis was performed according to the manufacturer’s protocol. Briefly, after transfection with siRNA for 6 d, the cells were collected and stained with propidium iodide and annexin V-EGFP for 10-15 min at 37 °C using an Apoptosis detection kit (Vigorous Biotechnology). The samples were then analysed using a BD LSRFortesa flow cytometer.
Protein extraction and digestion for LC–MS/MS
Lung tissues were individually homogenized and lysed in lysis buffer (1% SDS containing 1× protease inhibitor cocktail); the protein concentrations were then determined by BCA assay. For digestion, the protein solutions were precipitated with 20% tricarboxylic acid for 2 h at 4 °C. The supernatant was removed via centrifugation at 4,500g for 4 min and the precipitates were washed three times with pre-cooled acetone. The precipitates were resuspended in 200 mM triethylammonium bicarbonate and incubated with trypsin at a trypsin-to-protein mass ratio of 1:50 for overnight digestion. Finally, the precipitates were incubated with 5 mM dithiothreitol for 30 min at 56 °C and alkylated with 11 mM iodoacetamide for 15 min at RT in the dark.
Peptide fractionation for LC–MS/MS
For the construction of the DIA spectral library, digested peptides were fractionated using high-pH reverse-phase HPLC with an Agilent 300 extend C18 column (5 μm particles, 4.6 mm internal diameter, 250 mm length). Briefly, the peptides were separated into 60 fractions with a gradient of 8-32% acetonitrile in 10 mM ammonium bicarbonate (pH 9) and then combined into 12 fractions and dried by vacuum centrifugation.
Nuclei isolation and snRNA-seq on the 10x Genomics platform
The isolation of nuclei was performed using a previously published protocol58. All sample handling steps were performed on ice. Briefly, the frozen tissues were ground using a pestle and mortar, and solubilized in 1.5 ml lysis buffer containing 250 mM sucrose, 25 mM KCl, 5 mM MgCl2, 10 mM Tris buffer, 1 μM dithiothreitol, 1×protease inhibitor, 0.4 U μl−1 RNaseIn, 0.2 U μl−1 Superasin and 0.1% Triton X-100 in nuclease-free water. The samples were filtered several times through a 40 μm cell strainer (BD Falcon), centrifuged at 1,000g for 8 min at 4 °C and resuspended in PBS supplemented with 0.3% BSA, 0.4 U μl−1 RNaseIn and 0.2 U μl−1 Superasin. The nuclei were stained with acridine orange and propidium iodide, and then counted using a dual-fluorescence cell counter (Luna-FL, Logos Biosystems). Mononuclear capture was conducted using a 10x Genomics single-cell 3′ system. Approximately 9,000 nuclei were captured for each sample following the standard 10x capture and library preparation protocol (10x Genomics) and then sequenced in a NovaSeq 6000 sequencing system (Illumina, 20012866).
Bulk RNA-seq data processing
Raw reads were trimmed using TrimGalore (version 0.4.4_dev; https://github.com/FelixKrueger/TrimGalore). The trimmed reads were mapped to the hg19 genome using HISAT2 (version 2.0.4)59, generating sam files, which were then converted to bam files by SAMtools (version 1.6; http://www.htslib.org/). HTSeq was used to calculate the read count of each gene (version 0.11.0)60. Differentially expressed genes were identified using the R package DESeq2 (version 1.26.0)61, with a cutoff of adjusted P < 0.05 and |log2FC| > 1.5.
Ingenuity pathway analysis of upstream regulators
The upstream regulators of DEGs from bulk-seq were identified using ingenuity pathway analysis (Qiagen; https://www.qiagenbioinformatics.com/products/ingenuitypathway-analysis). Only regulators with an activation z-score showing either an increased or a decreased activation state for the implicated biological function and those with a P value less than 0.05 were kept for downstream analyses. Network plots were generated using Cytoscape (version 3.7.2)62.
Proteomics data analysis
Spectral libraries were generated following a previously published protocol63. Briefly, data-dependent acquisition and DIA data were processed using the Pulsar search engine in Spectronaut (v14.6) and default settings. Tandem mass spectra were searched against the human SwissProt database (20,366 entries) concatenated with a decoy database. The false discovery-rate thresholds of the total numbers of identified peptide sequences (PSMs), peptides and proteins were set to less than 1%. All of the DIA data were analysed in Spectronaut (v14.6) against the spectral library and the retention times were recalibrated by nonlinear calibration. The identification settings were set as follows: the maximum number of decoys was set to a fraction of 0.1 of the library size and the q-value cutoff was set to 0.01 on the precursor and protein levels. Relative protein quantification was performed using the MSstats package. Differentially expressed proteins were defined as those with a cutoff of |log2FC| > 1.5 and adjusted P < 0.05.
Processing of snRNA-seq data
Sequences from the NovaSeq analysis were de-multiplexed using bcl2fastq (version 2.20.0.422) to convert BCL files to FASTQ files. A pre-mRNA reference of hg19 was created following the Cell Ranger (version 3.1.0) protocol (https://support.10xgenomics.com/single-cell-gene-expression/software/pipelines/latest/advanced/references). Gene expression matrices for downstream analyses were calculated using the ‘count’ function of Cell Ranger and the default parameters.
Filtering of low-quality cells, clustering and identification of cell types
The output h5 file from Cell Ranger was calculated using CellBender (version 0.2.0) to reduce ambient RNA bias using default parameters, which was applied to every sample before the count matrices were merged64. The filtered matrixes were further analysed using Seurat (version 3.1.3)65. Cells with ≤ 200 genes or with a mitochondrial gene ratio ≥ 5% were regarded as low-quality cells and excluded. Possible doublets were detected using DoubletFinder (version 2.0.2)66. The data of each sample were then normalized using the function ‘SCTransfrom’ by Seurat. Features and anchors for downstream integration were selected using ‘PrepSCTIntegration’ and ‘FindIntegrationAnchors’. Nineteen post-mortem interval-related genes67 of human lung tissues were obtained to set up a gene set and regress them out using the ‘ScaleData’ function of Seurat. After data integration and scaling, the principle component analysis and clustering was performed using the ‘RunPCA’ and ‘FindClusters’ functions of Seurat. Dimensionality reduction was performed using the ‘RunUMAP’ function. Marker genes for each cluster were identified using the ‘FindAllMarkers’ function (adjusted P < 0.05 and |logFC| > 0.5). In addition, four clusters in the lung snRNA-seq data were excluded due to low quality, which was defined as having no specific marker genes, relatively low gene numbers or high mitochondrial gene ratios. In the end, a total of 141,152 cells considered to be of high quality were further analysed. The cell types were identified according to the expression of canonical marker genes for each cluster (Supplementary Table 3).
Analysis of DEGs from snRNA-seq data
Differential gene expression analysis between the COVID-19 and Control groups (COVID-19 DEGs) or between the Control and Control-Y (ageing DEGs) groups was performed using the ‘FindMarkers’ function of Seurat using the Wilcoxon signed-rank test. LogFC of DEGs in snRNA-seq data was calculated by natural logarithm. Genes with adjusted P < 0.05 and |logFC| > 0.5 were identified as DEGs. For a given cell type, if the total number of cells were 5 in any group, they were excluded from downstream analyses.
Module analysis of DEGs
We used the ‘AverageExpression’ function to calculate the averaged gene expression levels of upregulated/downregulated DEGs across 28 different cell types in the Control and COVID-19 groups, and clustered and classified these DEGs into six modules using the ‘hcluster’ and ‘kmeans_k’ functions of pheatmap R packages (version 1.0.12).
Transcription factor regulatory network analysis
Transcription factor regulatory network analysis was performed using SCENIC workflow (version 1.1.2.2)68 with default parameters. The transcription factor database based on the hg19 genome were downloaded using RcisTarget (version 1.6.0) to be used as a reference. Gene regulatory networks were inferred using GENIE3 (version 1.6.0) based on the COVID-19 DEGs across 28 cell types of the lung. Enriched transcription factor-binding motifs, predicted candidate target genes (regulons) and regulon activity were inferred using RcisTarget. The transcription regulatory network was visualized using Cytoscape (version 3.7.2)62.
GO term and pathway enrichment analysis of DEGs
GO term and pathway enrichment analysis of DEGs was performed using Metascape (version 3.5; http://metascape.org/gp/index.html). The results were visualized using the ggplot2 R package (version 3.2.1; https://ggplot2.tidyverse.org/).
Pseudotime analysis
Pseudotime analysis was performed on epithelial (AT1, AT2, AD.inter, basal, goblet, club and ciliated cells) and stromal (alveolar fibroblasts, adventitial fibroblasts, myofibroblasts, airway smooth muscle cells, Vas.SMC and pericytes) cells from the lung atlas data using the Monocle2 R package69. Gene ordering was performed using a cutoff of expression in at least ten cells and a combination of intercluster differential expression and dispersion with a q-value cutoff of < 0.01. The structure of the trajectory was plotted in two-dimensional space using the DDRTree dimensionality reduction algorithm and the cells were ordered in pseudotime.
Cell–cell communication analysis
Cell-cell communication analysis was conducted with the snRNA-seq data using the CellPhoneDB software (version 1.1.0)70. Only receptors and ligands expressed in more than 10% of cells of any type from the Control or COVID-19 groups were further evaluated and a cell-cell communication was considered non-existent if the ligand or the receptor was unmeasurable. The average expression of each ligand-receptor pair was analysed in various cell types and only those with P < 0.01 were used for the prediction of cell-cell communication between any two cell types.
Gene-set score analysis
Gene sets were obtained from GSEA (https://www.gsea-msigdb.org/) and DisGeNET (https://www.disgenet.org/home/). For the snRNA-seq data, gene sets were used for scoring each input cell using the Seurat function ‘AddModuleScore’. For the RNA-seq and proteomics data, the sum of all genes in a gene set was calculated and the score was defined as the log10-transformed sum. Changes in the scores between the COVID-19 and Control groups were analysed using the ggpubr package and the Wilcoxon signed-rank test (version 0.2.4; https://github.com/kassambara/ggpubr).
Statistics and reproducibility
No statistical methods were used to predetermine the sample size. The experiments were not randomized and the investigators were not blinded to allocation during experiments and outcome assessment. All data were statistically analysed using a one-tailed t-test, two-tailed t-test, Wilcoxon signed-rank test or analysis of variance to compare differences between groups, assuming equal variance, using the PRISM software (GraphPad 8 software) or R packages. P < 0.05 was considered statistically significant. P values are presented in the figures, as appropriate. The numbers of experimental repeats are indicated in the figure legends.
Reporting Summary
Further information on research design is available in the Nature Research Reporting Summary linked to this article.
Online content
Any methods, additional references, Nature Research reporting summaries, source data, extended data, supplementary information, acknowledgements, peer review information; details of author contributions and competing interests; and statements of data and code availability are available at 10.1038/s41556-021-00796-6.
Supplementary information
Supplementary Table 1. Information on the human lung samples used in this study. Supplementary Table 2. DEGs identified in the RNA-seq analyses, DEPs identified in the proteomics analyses, and all of the proteins identified using mass spectrometry. The DEGs and DEPs were identified using a cutoff of adjusted P < 0.05 and |log2FC| > 1.5. The P values were determined using a Wilcoxon test and adjusted P values using the Benjamini-Hochberg correction. Supplementary Table 3. Transcription factors in DEGs from the RNA-seq and snRNA-seq data. The P values were determined using a Wilcoxon test and adjusted P values using the Benjamini-Hochberg correction. Supplementary Table 4. Marker genes and DEGs of different cell types identified in the snRNA-seq. Marker genes were identified using a cutoff of adjusted P < 0.05 and |logFC| > 0.5. The DEGs were identified using a cutoff of adjusted P < 0.05 and |logFC| > 0.25. The P values were determined using a Wilcoxon test and adjusted P values using the Benjamini-Hochberg correction. Supplementary Table 5. COVID-19- and Control-specific cell-cell interaction pairs. The P values were determined using a Wilcoxon test. Supplementary Table 6. Genes that were differentially expressed between human fibroblasts with constitutive HIF-1α activation or FOXO3 knockdown and control human fibroblasts. The DEGs were identified using a cutoff of adjusted P < 0.05 and |log2FC| > 1.5. The P values were determined using a Wilcoxon test and adjusted P values using the Benjamini–Hochberg correction. Supplementary Table 7. List of primers, siRNAs and probes used in this study. Supplementary Table 8. List of antibodies used in this study.
Acknowledgements
We thank the patients and their families for their dedication. We thank L. Bai, Q. Chu, R. Bai, S. Ma, J. Lu and Y. Yang for their administrative assistance; T.-J. Tong and Z.-Y. Zhang for providing human lung fibroblasts; J. Lei for his help in vector construction and S. Li for her help with imaging. We also thank the clinician staff (W. Li, Department of Critical Care Medicine, PLA Key Laboratory of Emergency and Critical Care Research, Jinling Hospital, Nanjing University; X. Zhou, Department of Pulmonary and Critical Care Medicine, Southwest Hospital, TMMU (Army Medical University); D. Jiang, Wound Trauma Medical Center, State Key Laboratory of Trauma, Daping Hospital, TMMU; Q. Mao, Department of Infectious Diseases, Southwest Hospital, TMMU) and biosafety personnel (J. Qi, Z. Zhang and Institute of Medical Support Technology, Academy of System Engineering, Tianjin) for their contributions to the autopsy procedures. This work was supported by the Strategic Priority Research Program of the Chinese Academy of Sciences (grant no. XDA16000000 (G.-H.L., J.Q., W.Z., M.S., Y.Y., W.L., H.W., and B.H.)), National Key Research and Development Program of China (grant nos. 2018YFC2000100 (J.Q. and S.M.), 2020YFA0804000 (G.-H.L. and S.W.), 2020YFA0112201 (G.-H.L.), 2017YFA0103304 (W.Z.), 2017YFA0102802 (W.Z.), 2018YFA0107203 (J.Q.) and 2020YFA0113400 (M.S.)), National Natural Science Foundation of China (grant nos. 81921006 (G.-H.L., J.Q., and M.S.), 81625009 (G.-H.L.), 91749202 (G.-H.L.), 81861168034 (G.-H.L.), 91949209 (J.Q.), 92049304 (J.Q.), 81822018 (W.Z.), 82071588 (S.W.), 92049116 (W.Z.), 32000510 (Y.F.), 31900523 (S.S.), 32000500 (S.M.), 81870228 (M.S.), 81922027 (M.S.), 82125011 (J.Q.), 82122024 (S.W.), 32121001 (W.Z.) and 91849132 (L.S.)), COVID-19 project from Chongqing Science and Technology Commission (grant no. cstc2020jscx-fyzxX0037 (X.-W.B.)), Program of the Beijing Natural Science Foundation (grant nos. Z190019 (G.-H.L. and W.Z.) and JQ20031 (M.S.)), Key Research Program of the Chinese Academy of Sciences (grant no. KFZD-SW-221 (J.Q. and G.-H.L.)), K. C. Wong Education Foundation (grant nos. GJTD-2019-06 (J.Q. and G.-H.L.) and GJTD-2019-08 (W.Z)), CAS Project for Young Scientists in Basic Research YSBR-012 (W.Z.), Youth Innovation Promotion Association of CAS (grant nos. E1CAZW0401 (W.Z.) and 2021078 (S.W.)), Priority Union Foundation of Yunnan Provincial Science and Technology Department (grant no. 202001AY070001-011 (L.S.)), the 14th Five-year Network Security and Informatization Plan of Chinese Academy of Sciences (WX145XQ07-18), State Key Laboratory of Stem Cell and Reproductive Biology, State Key Laboratory of Membrane Biology, and Milky Way Research Foundation (MWRF; G.-H.L.).
Extended data
Source data
Statistical source data.
Statistical source data.
Statistical source data.
Statistical source data.
Statistical source data.
Statistical source data.
Unprocessed western blots.
Statistical source data.
Statistical source data.
Unprocessed western blots.
Author contributions
G.-H.L, X.-W.B, W.Z, J.Q. and S.W. conceived and supervised the project. G.-H.L, X.-W.B, W.Z, J.Q., S.W., X.Y., S.M., Y.P., Y.F., S.S., Z.H., Y.S., L.S., S.X. and M.S. wrote the paper. S.W., X.Y., Y.P., Y.F., S.S., Z.H., Y.S., L.S., S.X., Liyun Zhao., H.H. and G.S. generated the data. M.S., J.L., S.W., X.Y., Y.P., Y.F. and S.S. analysed the data. J.C., R.T., C.W., Q.W., Lei Zhao., X.L., L.C., G.P., H.C, Q.L., P.Z., Y.X., H.F., G.-G.Z., T.W., Y.Y., X.H., W.L., Z.L., H.Wang, H.Wu, B.H., Y.R., X.Y. and Q.Z. interpreted the data. All authors read the manuscript, offered feedback and approved it before submission.
Data availability
The accession numbers for the raw snRNA-seq and bulk RNA-seq data reported in this paper have been deposited in Genome Sequence Archive for Human (https://ngdc.cncb.ac.cn/gsa-human/) under the following accession numbers: HRA000615, HRA000646 and HRA001136. Mass spectrometry data have been deposited in iProX with the primary accession code IPX0003571000. All other data supporting the findings of this study are available from the corresponding author on reasonable request. Source data are provided with this paper.
Code availability
Original scripts used for the bioinformatics analysis in this study are available at GitHub (https://github.com/Jiam1ng/COVID-19_Lung_Atlas).
Competing interests
The authors declare no competing interests.
Footnotes
Peer review information Nature Cell Biology thanks Charles Dela Cruz and the other, anonymous, reviewer(s) for their contribution to the peer review of this work.
Publisher’s note Springer Nature remains neutral with regard to jurisdictional claims in published maps and institutional affiliations.
These authors contributed equally: Si Wang, Xiaohong Yao, Shuai Ma, Yifang Ping, Yanling Fan, Shuhui Sun, Zhicheng He, Yu Shi, Liang Sun, Shiqi Xiao, Moshi Song.
Contributor Information
Jing Qu, Email: qujing@ioz.ac.cn.
Weiqi Zhang, Email: zhangwq@big.ac.cn.
Guang-Hui Liu, Email: ghliu@ioz.ac.cn.
Xiu-Wu Bian, Email: bianxiuwu@263.net.
Extended data
is available for this paper at 10.1038/s41556-021-00796-6.
Supplementary information
The online version contains supplementary material available at 10.1038/s41556-021-00796-6.
References
- 1.Travaglini KJ, et al. A molecular cell atlas of the human lung from single-cell RNA sequencing. Nature. 2020;587:619–625. doi: 10.1038/s41586-020-2922-4. [DOI] [PMC free article] [PubMed] [Google Scholar]
- 2.Liu Q, et al. Pathological changes in the lungs and lymphatic organs of 12 COVID-19 autopsy cases. Natl Sci. Rev. 2020;7:1868–1878. doi: 10.1093/nsr/nwaa247. [DOI] [PMC free article] [PubMed] [Google Scholar]
- 3.Carsana L, et al. Pulmonary post-mortem findings in a series of COVID-19 cases from northern Italy: a two-centre descriptive study. Lancet Infect. Dis. 2020;20:1135–1140. doi: 10.1016/S1473-3099(20)30434-5. [DOI] [PMC free article] [PubMed] [Google Scholar]
- 4.Yao X-H, et al. Pathological evidence for residual SARS-CoV-2 in pulmonary tissues of a ready-for-discharge patient. Cell Res. 2020;30:541–543. doi: 10.1038/s41422-020-0318-5. [DOI] [PMC free article] [PubMed] [Google Scholar]
- 5.Xu Z, et al. Pathological findings of COVID-19 associated with acute respiratory distress syndrome. Lancet Respir. Med. 2020;8:420–422. doi: 10.1016/S2213-2600(20)30076-X. [DOI] [PMC free article] [PubMed] [Google Scholar]
- 6.Melms JC, et al. A molecular single-cell lung atlas of lethal COVID-19. Nature. 2021;595:114–119. doi: 10.1038/s41586-021-03569-1. [DOI] [PMC free article] [PubMed] [Google Scholar]
- 7.Wang G, et al. C-reactive protein level may predict the risk of COVID-19 aggravation. Open Forum Infect. Dis. 2020;7:ofaa153. doi: 10.1093/ofid/ofaa153. [DOI] [PMC free article] [PubMed] [Google Scholar]
- 8.Li H, et al. Serum amyloid a is a biomarker of severe coronavirus disease and poor prognosis. J. Infect. 2020;80:646–655. doi: 10.1016/j.jinf.2020.03.035. [DOI] [PMC free article] [PubMed] [Google Scholar]
- 9.Shen B, et al. Proteomic and metabolomic characterization of COVID-19 patient sera. Cell. 2020;182:59–72. doi: 10.1016/j.cell.2020.05.032. [DOI] [PMC free article] [PubMed] [Google Scholar]
- 10.Ma S, et al. Single-cell transcriptomic atlas of primate cardiopulmonary aging. Cell Res. 2020;31:415–432. doi: 10.1038/s41422-020-00412-6. [DOI] [PMC free article] [PubMed] [Google Scholar]
- 11.Sungnak W, et al. SARS-CoV-2 entry factors are highly expressed in nasal epithelial cells together with innate immune genes. Nat. Med. 2020;26:681–687. doi: 10.1038/s41591-020-0868-6. [DOI] [PMC free article] [PubMed] [Google Scholar]
- 12.Berlin DA, Gulick RM, Martinez FJ. Severe Covid-19. N. Engl. J. Med. 2020;383:2451–2460. doi: 10.1056/NEJMcp2009575. [DOI] [PubMed] [Google Scholar]
- 13.Yan P, et al. FOXO3-engineered human ESC-derived vascular cells promote vascular protection and regeneration. Cell Stem Cell. 2019;24:447–461. doi: 10.1016/j.stem.2018.12.002. [DOI] [PubMed] [Google Scholar]
- 14.Zhang W, et al. A single-cell transcriptomic landscape of primate arterial aging. Nat. Commun. 2020;11:2202. doi: 10.1038/s41467-020-15997-0. [DOI] [PMC free article] [PubMed] [Google Scholar]
- 15.Zheng Y, et al. A human circulating immune cell landscape in aging and COVID-19. Protein Cell. 2020;11:740–770. doi: 10.1007/s13238-020-00762-2. [DOI] [PMC free article] [PubMed] [Google Scholar]
- 16.De Biasi S, et al. Marked T cell activation, senescence, exhaustion and skewing towards TH17 in patients with COVID-19 pneumonia. Nat. Commun. 2020;11:3434. doi: 10.1038/s41467-020-17292-4. [DOI] [PMC free article] [PubMed] [Google Scholar]
- 17.De Cecco M, et al. L1 drives IFN in senescent cells and promotes age-associated inflammation. Nature. 2019;566:73–78. doi: 10.1038/s41586-018-0784-9. [DOI] [PMC free article] [PubMed] [Google Scholar]
- 18.Geng L, et al. Chemical screen identifies a geroprotective role of quercetin in premature aging. Protein Cell. 2019;10:417–435. doi: 10.1007/s13238-018-0567-y. [DOI] [PMC free article] [PubMed] [Google Scholar]
- 19.Liu, X. et al. Resurrection of human endogenous retroviruses during aging reinforces senescence. Preprint at bioRxiv10.1101/2021.02.22.432260 (2021).
- 20.Parikh P, et al. Cellular senescence in the lung across the age spectrum. Am. J. Physiol. Lung Cell. Mol. Physiol. 2019;316:L826–L842. doi: 10.1152/ajplung.00424.2018. [DOI] [PMC free article] [PubMed] [Google Scholar]
- 21.Aging Atlas C. Aging Atlas: a multi-omics database for aging biology. Nucleic Acids Res. 2021;49:D825–D830. doi: 10.1093/nar/gkaa894. [DOI] [PMC free article] [PubMed] [Google Scholar]
- 22.Choi J, et al. Inflammatory signals induce AT2 cell-derived damage-associated transient progenitors that mediate alveolar regeneration. Cell Stem Cell. 2020;27:366–382. doi: 10.1016/j.stem.2020.06.020. [DOI] [PMC free article] [PubMed] [Google Scholar]
- 23.Delorey, T. M. et al. COVID-19 tissue atlases reveal SARS-CoV-2 pathology and cellular targets. Nature595, 107–113 (2021). [DOI] [PMC free article] [PubMed]
- 24.Zuo, Y. Y., Veldhuizen, R. A. W., Neumann, A. W., Petersen, N. O. & Possmayer, F. Current perspectives in pulmonary surfactant—inhibition, enhancement and evaluation. Biochimica Biophys. Acta1778, 1947–1977 (2008). [DOI] [PubMed]
- 25.Giamarellos-Bourboulis, E. J. et al. Complex immune dysregulation in COVID-19 patients with severe respiratory failure. Cell Host Microbe27, 992–1000 (2020). [DOI] [PMC free article] [PubMed]
- 26.Lucas C, et al. Longitudinal analyses reveal immunological misfiring in severe COVID-19. Nature. 2020;584:463–469. doi: 10.1038/s41586-020-2588-y. [DOI] [PMC free article] [PubMed] [Google Scholar]
- 27.Liao M, et al. Single-cell landscape of bronchoalveolar immune cells in patients with COVID-19. Nat. Med. 2020;26:842–844. doi: 10.1038/s41591-020-0901-9. [DOI] [PubMed] [Google Scholar]
- 28.Ren X, et al. COVID-19 immune features revealed by a large-scale single-cell transcriptome atlas. Cell. 2021;184:1895–1913. doi: 10.1016/j.cell.2021.01.053. [DOI] [PMC free article] [PubMed] [Google Scholar]
- 29.Zhu L, et al. Single-cell sequencing of peripheral mononuclear cells reveals distinct immune response landscapes of COVID-19 and influenza patients. Immunity. 2020;53:685–696. doi: 10.1016/j.immuni.2020.07.009. [DOI] [PMC free article] [PubMed] [Google Scholar]
- 30.Merad M, Martin JC. Pathological inflammation in patients with COVID-19: a key role for monocytes and macrophages. Nat. Rev. Immunol. 2020;20:355–362. doi: 10.1038/s41577-020-0331-4. [DOI] [PMC free article] [PubMed] [Google Scholar]
- 31.Tay, M. Z., Poh, C. M., Rénia, L., MacAry, P. A. & Ng, L. F. P. The trinity of COVID-19: immunity, inflammation and intervention. Nat. Rev. Immunol.20, 363–374 (2020). [DOI] [PMC free article] [PubMed]
- 32.Ma S, et al. Caloric restriction reprograms the single-cell transcriptional landscape of rattus norvegicus aging. Cell. 2020;180:984–1001. doi: 10.1016/j.cell.2020.02.008. [DOI] [PubMed] [Google Scholar]
- 33.Ohtsubo K, Marth JD. Glycosylation in cellular mechanisms of health and disease. Cell. 2006;126:855–867. doi: 10.1016/j.cell.2006.08.019. [DOI] [PubMed] [Google Scholar]
- 34.Leng L, et al. Pathological features of COVID-19-associated lung injury: a preliminary proteomics report based on clinical samples. Signal Transduct. Target. Ther. 2020;5:240. doi: 10.1038/s41392-020-00355-9. [DOI] [PMC free article] [PubMed] [Google Scholar]
- 35.Wichmann D, et al. Autopsy findings and venous thromboembolism in patients with COVID-19. Ann. Intern. Med. 2020;173:268–277. doi: 10.7326/M20-2003. [DOI] [PubMed] [Google Scholar]
- 36.Nie X, et al. Multi-organ proteomic landscape of COVID-19 autopsies. Cell. 2021;184:775–791. doi: 10.1016/j.cell.2021.01.004. [DOI] [PMC free article] [PubMed] [Google Scholar]
- 37.Gillich A, et al. Capillary cell-type specialization in the alveolus. Nature. 2020;586:785–789. doi: 10.1038/s41586-020-2822-7. [DOI] [PMC free article] [PubMed] [Google Scholar]
- 38.Lip, G. Y. H. & Blann, A. von Willebrand factor: a marker of endothelial dysfunction in vascular disorders? Cardiovasc. Res.34, 255–265 (1997). [DOI] [PubMed]
- 39.Jang Y, Lincoff AM, Plow EF, Topol EJ. Cell adhesion molecules in coronary artery disease. J. Am. Coll. Cardiol. 1994;24:1591–1601. doi: 10.1016/0735-1097(94)90162-7. [DOI] [PubMed] [Google Scholar]
- 40.Shibuya M. Vascular endothelial growth factor (VEGF) and its receptor (VEGFR) signaling in angiogenesis: a crucial target for anti- and pro-angiogenic therapies. Genes Cancer. 2011;2:1097–1105. doi: 10.1177/1947601911423031. [DOI] [PMC free article] [PubMed] [Google Scholar]
- 41.Plein A, Fantin A, Ruhrberg C. Neuropilin regulation of angiogenesis, arteriogenesis, and vascular permeability. Microcirculation. 2014;21:315–323. doi: 10.1111/micc.12124. [DOI] [PMC free article] [PubMed] [Google Scholar]
- 42.Ackermann M, et al. Pulmonary vascular endothelialitis, thrombosis, and angiogenesis in COVID-19. N. Engl. J. Med. 2020;383:120–128. doi: 10.1056/NEJMoa2015432. [DOI] [PMC free article] [PubMed] [Google Scholar]
- 43.Tang N, Li D, Wang X, Sun Z. Abnormal coagulation parameters are associated with poor prognosis in patients with novel coronavirus pneumonia. J. Thromb. Haemost. 2020;18:844–847. doi: 10.1111/jth.14768. [DOI] [PMC free article] [PubMed] [Google Scholar]
- 44.Swieringa F, Spronk HMH, Heemskerk JWM, van der Meijden PEJ. Integrating platelet and coagulation activation in fibrin clot formation. Res. Pract. Thrombosis Haemost. 2018;2:450–460. doi: 10.1002/rth2.12107. [DOI] [PMC free article] [PubMed] [Google Scholar]
- 45.McGonagle D, O’Donnell JS, Sharif K, Emery P, Bridgewood C. Immune mechanisms of pulmonary intravascular coagulopathy in COVID-19 pneumonia. Lancet Rheumatol. 2020;2:E437–E445. doi: 10.1016/S2665-9913(20)30121-1. [DOI] [PMC free article] [PubMed] [Google Scholar]
- 46.Philip K, et al. HIF1A up-regulates the ADORA2B receptor on alternatively activated macrophages and contributes to pulmonary fibrosis. FASEB J. 2017;31:4745–4758. doi: 10.1096/fj.201700219R. [DOI] [PMC free article] [PubMed] [Google Scholar]
- 47.Al-Tamari HM, et al. FoxO3 an important player in fibrogenesis and therapeutic target for idiopathic pulmonary fibrosis. EMBO Mol. Med. 2018;10:276–293. doi: 10.15252/emmm.201606261. [DOI] [PMC free article] [PubMed] [Google Scholar]
- 48.Lee, S. et al. Virus-induced senescence is driver and therapeutic target in COVID-19. Nature 10.1038/s41586-021-03995-1 (2021). [DOI] [PubMed]
- 49.Lu S, et al. Effective treatment of SARS-CoV-2-infected rhesus macaques by attenuating inflammation. Cell Res. 2021;31:229–232. doi: 10.1038/s41422-020-00414-4. [DOI] [PMC free article] [PubMed] [Google Scholar]
- 50.Camell Christina D, et al. Senolytics reduce coronavirus-related mortality in old mice. Science. 2021;373:eabe4832. doi: 10.1126/science.abe4832. [DOI] [PMC free article] [PubMed] [Google Scholar]
- 51.Di Pierro, F. et al. Potential clinical benefits of quercetin in the early stage of COVID-19: results of a second, pilot, randomized, controlled and open-label clinical trial. Int. J. Gen. Med. 14, 2807-2816 (2021). [DOI] [PMC free article] [PubMed]
- 52.Wang S, et al. Single-cell transcriptomic atlas of primate ovarian aging. Cell. 2020;180:585–600. doi: 10.1016/j.cell.2020.01.009. [DOI] [PubMed] [Google Scholar]
- 53.Zhang, H. et al. Single-nucleus transcriptomic landscape of primate hippocampal aging. Protein Cell12, 695–716 (2021). [DOI] [PMC free article] [PubMed]
- 54.Lei, J. et al. FOXO3-engineered human mesenchymal progenitor cells efficiently promote cardiac repair after myocardial infarction. Protein Cell12, 145–151 (2020). [DOI] [PMC free article] [PubMed]
- 55.Han, X.-l., Wu, F.-g., Zhang, Z.-y. & Tong, T.-j. Posttranscriptional induction of p21Waf1 mediated by ectopic p16INK4 in human diploid fibroblast. Chin. Med. J.120, 405–409 (2007). [PubMed]
- 56.Masson N, Willam C, Maxwell PH, Pugh CW, Ratcliffe PJ. Independent function of two destruction domains in hypoxia-inducible factor-α chains activated by prolyl hydroxylation. EMBO J. 2001;20:5197–5206. doi: 10.1093/emboj/20.18.5197. [DOI] [PMC free article] [PubMed] [Google Scholar]
- 57.Zou, Z. et al. A single-cell transcriptomic atlas of human skin aging. Dev. Cell56, 383–397 (2020). [DOI] [PubMed]
- 58.Krishnaswami SR, et al. Using single nuclei for RNA-seq to capture the transcriptome of postmortem neurons. Nat. Protoc. 2016;11:499–524. doi: 10.1038/nprot.2016.015. [DOI] [PMC free article] [PubMed] [Google Scholar]
- 59.Kim D, Langmead B, Salzberg SL. HISAT: a fast spliced aligner with low memory requirements. Nat. Methods. 2015;12:357–360. doi: 10.1038/nmeth.3317. [DOI] [PMC free article] [PubMed] [Google Scholar]
- 60.Anders S, Pyl PT, Huber W. HTSeq—a Python framework to work with high-throughput sequencing data. Bioinformatics. 2015;31:166–169. doi: 10.1093/bioinformatics/btu638. [DOI] [PMC free article] [PubMed] [Google Scholar]
- 61.Love MI, Huber W, Anders S. Moderated estimation of fold change and dispersion for RNA-seq data with DESeq2. Genome Biol. 2014;15:550. doi: 10.1186/s13059-014-0550-8. [DOI] [PMC free article] [PubMed] [Google Scholar]
- 62.Shannon P, et al. Cytoscape: a software environment for integrated models of biomolecular interaction networks. Genome Res. 2003;13:2498–2504. doi: 10.1101/gr.1239303. [DOI] [PMC free article] [PubMed] [Google Scholar]
- 63.Bruderer R, et al. Extending the limits of quantitative proteome profiling with data-independent acquisition and application to acetaminophen-treated three-dimensional liver microtissues. Mol. Cell. Proteomics. 2015;14:1400–1410. doi: 10.1074/mcp.M114.044305. [DOI] [PMC free article] [PubMed] [Google Scholar]
- 64.Fleming, S. J., Marioni, J. C. & Babadi, M. CellBender remove-background: a deep generative model for unsupervised removal of background noise from scRNA-seq datasets. Preprint at bioRxiv10.1101/791699 (2019).
- 65.Butler A, Hoffman P, Smibert P, Papalexi E, Satija R. Integrating single-cell transcriptomic data across different conditions, technologies, and species. Nat. Biotechnol. 2018;36:411–420. doi: 10.1038/nbt.4096. [DOI] [PMC free article] [PubMed] [Google Scholar]
- 66.McGinnis CS, Murrow LM, Gartner ZJ. DoubletFinder: doublet detection in single-cell RNA sequencing data using artificial nearest neighbors. Cell Syst. 2019;8:329–337. doi: 10.1016/j.cels.2019.03.003. [DOI] [PMC free article] [PubMed] [Google Scholar]
- 67.Ferreira PG, et al. The effects of death and post-mortem cold ischemia on human tissue transcriptomes. Nat. Commun. 2018;9:490. doi: 10.1038/s41467-017-02772-x. [DOI] [PMC free article] [PubMed] [Google Scholar]
- 68.Aibar S, et al. SCENIC: single-cell regulatory network inference and clustering. Nat. Methods. 2017;14:1083–1086. doi: 10.1038/nmeth.4463. [DOI] [PMC free article] [PubMed] [Google Scholar]
- 69.Trapnell C, et al. The dynamics and regulators of cell fate decisions are revealed by pseudotemporal ordering of single cells. Nat. Biotechnol. 2014;32:381–386. doi: 10.1038/nbt.2859. [DOI] [PMC free article] [PubMed] [Google Scholar]
- 70.Efremova M, Vento-Tormo M, Teichmann SA, Vento-Tormo R. CellPhoneDB: inferring cell–cell communication from combined expression of multi-subunit ligand–receptor complexes. Nat. Protoc. 2020;15:1484–1506. doi: 10.1038/s41596-020-0292-x. [DOI] [PubMed] [Google Scholar]
Associated Data
This section collects any data citations, data availability statements, or supplementary materials included in this article.
Supplementary Materials
Supplementary Table 1. Information on the human lung samples used in this study. Supplementary Table 2. DEGs identified in the RNA-seq analyses, DEPs identified in the proteomics analyses, and all of the proteins identified using mass spectrometry. The DEGs and DEPs were identified using a cutoff of adjusted P < 0.05 and |log2FC| > 1.5. The P values were determined using a Wilcoxon test and adjusted P values using the Benjamini-Hochberg correction. Supplementary Table 3. Transcription factors in DEGs from the RNA-seq and snRNA-seq data. The P values were determined using a Wilcoxon test and adjusted P values using the Benjamini-Hochberg correction. Supplementary Table 4. Marker genes and DEGs of different cell types identified in the snRNA-seq. Marker genes were identified using a cutoff of adjusted P < 0.05 and |logFC| > 0.5. The DEGs were identified using a cutoff of adjusted P < 0.05 and |logFC| > 0.25. The P values were determined using a Wilcoxon test and adjusted P values using the Benjamini-Hochberg correction. Supplementary Table 5. COVID-19- and Control-specific cell-cell interaction pairs. The P values were determined using a Wilcoxon test. Supplementary Table 6. Genes that were differentially expressed between human fibroblasts with constitutive HIF-1α activation or FOXO3 knockdown and control human fibroblasts. The DEGs were identified using a cutoff of adjusted P < 0.05 and |log2FC| > 1.5. The P values were determined using a Wilcoxon test and adjusted P values using the Benjamini–Hochberg correction. Supplementary Table 7. List of primers, siRNAs and probes used in this study. Supplementary Table 8. List of antibodies used in this study.
Data Availability Statement
The accession numbers for the raw snRNA-seq and bulk RNA-seq data reported in this paper have been deposited in Genome Sequence Archive for Human (https://ngdc.cncb.ac.cn/gsa-human/) under the following accession numbers: HRA000615, HRA000646 and HRA001136. Mass spectrometry data have been deposited in iProX with the primary accession code IPX0003571000. All other data supporting the findings of this study are available from the corresponding author on reasonable request. Source data are provided with this paper.
Original scripts used for the bioinformatics analysis in this study are available at GitHub (https://github.com/Jiam1ng/COVID-19_Lung_Atlas).


