

Summary
Leveraging systems biologic approaches, we illustrate how metabolically distinct species of Clostridia protect against or worsen Clostridioides difficile infection in mice by modulating the pathogen’s colonization, growth, and virulence to impact host survival. Gnotobiotic mice colonized with the amino acid fermenter Paraclostridium bifermentans survive infection with reduced disease severity, while mice colonized with the butyrate-producer, Clostridium sardiniense, more rapidly succumb. Systematic in vivo analyses revealed how each commensal alters the gut nutrient environment to modulate the pathogen’s metabolism, gene regulatory networks, and toxin production. Oral administration of P. bifermentans rescues conventional, clindamycin-treated mice from lethal C. difficile infection in a manner like that of monocolonized animals, thereby supporting the therapeutic potential of this commensal species. Our findings lay the foundation for mechanistically informed therapies to counter C. difficile disease using systems biologic approaches to define host-commensal-pathogen interactions in vivo.
eTOC Blurb:
Girinathan, et al. defines complex mechanisms by which individual gut commensals limit or worsen Clostridioides difficile pathogenicity. Integrated, high-resolution analyses of metabolomic, meta-transcriptomic and phenotypic outcomes identify complex inter-microbe interactions in vivo to delineate how commensals uniquely shape the intestinal environment to impact microbial programs, which may enlighten bacteriotherapeutic approaches.
Graphical Abstract

Introduction
Clostridioides difficile infections cause substantial morbidity and mortality (Allegretti et al., 2019; Worley et al., 2020). Fecal microbiota transplant (FMT) has become standard of care for recurrent infections by reconstituting a protective microbiota (Leslie et al., 2019). Mechanisms of commensal protection have included conversion of host primary to secondary bile acids which inhibit C. difficile spore germination (Buffie et al., 2015), production of anti-microbial peptides (Mills et al., 2018; Valdes-Varela et al., 2016; Zheng et al., 2018), and promiscuous commensal bacteriophage that can disrupt pathogen growth (Baktash et al., 2018). However, we know little about the molecular mechanisms by which specific microbes modulate the pathogen’s virulence in vivo. Given FMT-related deaths in immunocompromised patients (Marcella et al., 2021), therapies informed by molecular mechanisms of action will enable options with improved safety and efficacy.
C. difficile’s pathogenicity locus (PaLoc) contains the TcdA and TcdB toxins and TcdE holin involved in toxin release. TcdR encodes a sigma factor specific for the toxin gene promoters (Bouillaut et al., 2015; Mani and Dupuy, 2001). C. difficile, like other cluster XI Clostridia, utilizes diverse carbon sources in vivo including carbohydrates, amino acids fermented via Stickland reactions, and ethanolamine (Dubois et al., 2016). Stickland metabolism can drive rapid pathogen growth, particularly with abundant proline, glycine or leucine, which serve as electron acceptors for the prd, grd and had enzyme systems, respectively (Bouillaut et al., 2015; Hofmann et al., 2018; Neumann-Schaal et al., 2015). The pathogen also fixes carbon through the Wood-Ljungdhal pathway to generate acetate for metabolism (Nawrocki et al., 2018; Neumann-Schaal et al., 2019). C. difficile’s conditional regulatory networks closely integrate its cellular metabolism and virulence programs, particularly through the CodY and CcpA metabolic repressors that repress PaLoc expression under nutrient sufficiency (Martin-Verstraete et al., 2016) and promote toxin expression with starvation to extract nutrients from the host. CodY and CcpA co-regulate additional gene systems in cellular metabolism, sporulation, and stress responses by sensing host and commensally-produced factors including inflammatory ROS and antimicrobial peptides (Kint et al., 2017; Neumann-Schaal et al., 2018).
Host and microbiota can thus influence the pathogen’s virulence via multiple mechanisms. Among Stickland-fermenting Cluster XI Clostridia, Paraclostridium bifermentans preferentially uses Stickland fermentations for energy. In contrast, Clostridium sardiniense, a glycolytic Cluster I species, produces abundant butyrate through anaerobic carbohydrate fermentation (Moore, 1993). Both species colonize the human gut yet have very different metabolic capabilities.
Using defined colonization and infection experiments in gnotobiotic mice (Reeves et al., 2012; Wilson et al., 1986) with Environmental and Gene Regulatory Influence Network (EGRIN) and Phenotype of Regulatory Influences integrated with Metabolism and Environment (PRIME) models of C. difficile’s conditional regulatory networks (Arrieta-Ortiz ML, et al. In revision), we show how individual species of commensal Clostridia affect host survival of C. difficile infection, to the level of the microbial pathways and small molecules that modulate C. difficile’s regulatory networks to drive pathogen growth and virulence. Findings promoted development of a defined bacteriotherapeutic able to rescue an infected conventional host from lethal infection. By defining how individual commensals systematically modulate C. difficile’s physiology we enable mechanistically informed approaches for this disease.
Results
Single commensals dramatically alter host outcomes from C. difficile infection.
C. difficile infection of 6-week old germfree mice caused rapid demise (Figs. 1A–B). Symptoms developed at 20h post-challenge with weight loss and diarrhea. Animals demonstrated focal epithelial damage with neutrophilic infiltrates at 24h (Figs. 1C vs D) that by 32h showed widespread erosions and worsening symptomatic disease.
Figure 1: P. bifermentans protects germfree mice from lethal C. difficile infection while C. sardiniense promotes more severe disease.
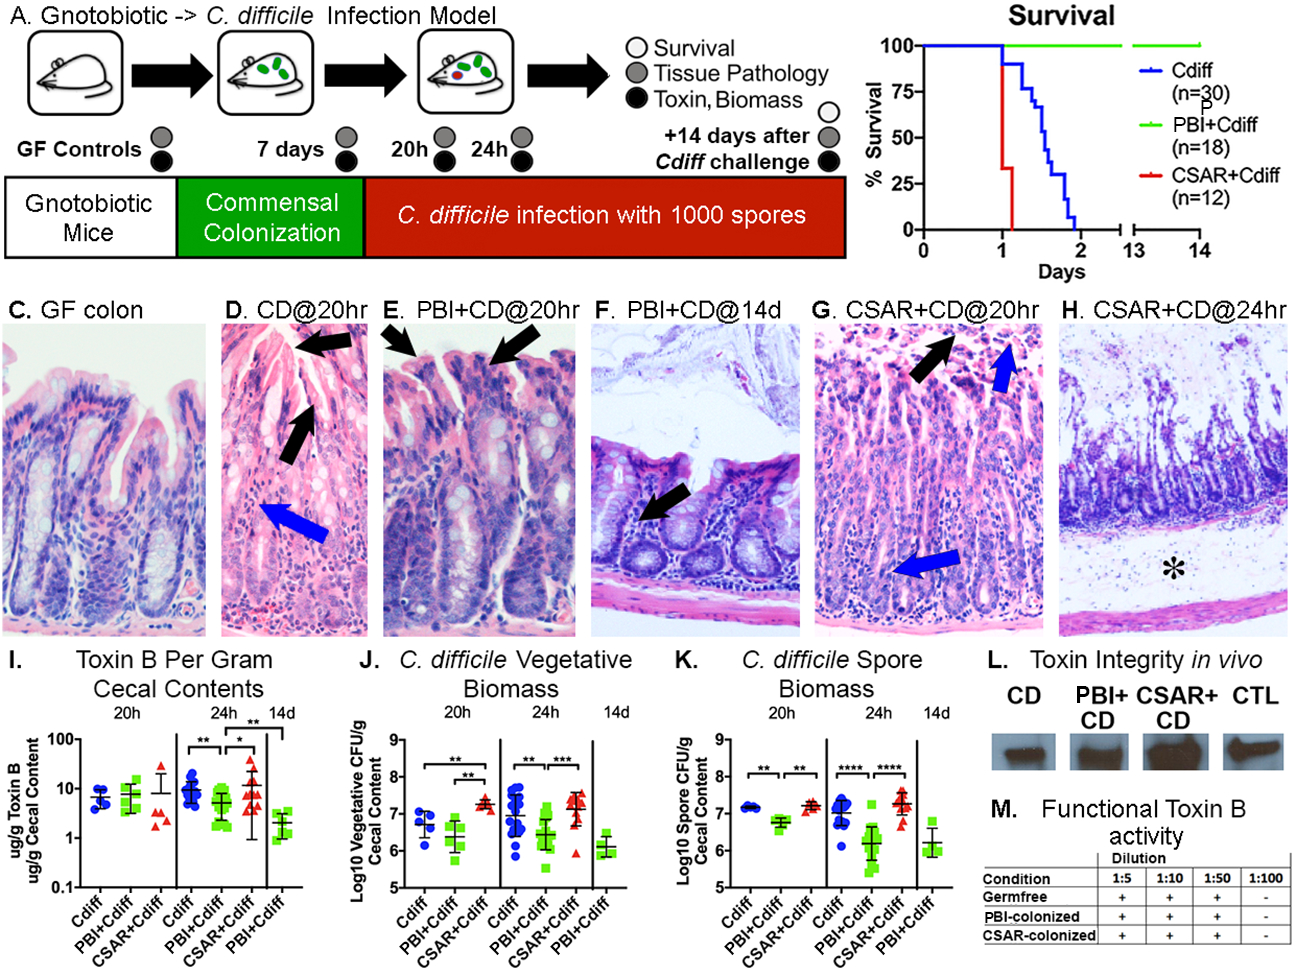
A: Experimental overview. B: Survival curves. C-H: Colonic H&E stains; C-E: 200X, F-G: 100X and H: 40X magnification. C: Normal germfree mucosa. D: C. difficile-infected mice at 20h, showing epithelial stranding and vacuolation (black arrows) and neutrophil infiltrates (blue arrow). E: P. bifermentans co-colonzied mice at 20h of infection showing vacuolization of apical colonocytes (black arrows) but nominal inflammation. F: P. bifermentans and C. difficile-infected mice at 14d showing intact epithelium and lymphocytic infiltrates (black arrow). G: C. sardiniense and C. difficile-infected mice at 20h of infection showing surface epithelial loss and pseudomembrane formation (black arrow) and transmural neutrophilic infiltrates entering the lumen (blue arrows). H: C. sardiniense co-colonized mice at 24h of infection showing epithelial denudation and severe submucosal edema (asterisk). I: Log10 ug/g of extracellular cecal ToxinB. Mann-Whitney significance values: *0.01<p≤0.05; **0.001<p≤0.01; ***0.0001<p≤0.001; ****p≤0.0001. J. Log10 C. difficile vegetative CFU, K: spore biomass/gram of cecal contents. L. Western blot of cecal contents showing intact toxinB in C. difficile infected (CD), P. bifermentans + C. difficile, or C. sardiniense + C. difficile co-colonized mice; CTL = control toxoidB. M. Effects of GF, P. bifermentans or C. sardiniense-monocolonized cecal contents on the toxicity of exogenously added toxinB, no differences were noted in toxinB cytopathic effect against human fibroblasts. Supplemental Figure 1: P. bifermentans protects germfree mice from lethal C. difficile infection while C. sardiniense promotes worse disease, Related to Figure 1, shows additional data regarding host responses and in vivo commensal biomass.
In contrast, mice pre-colonized with P. bifermentans prior to C. difficile challenge survived (Fig. 1B; p<0.0001) with milder symptoms and colonic damage (Figs. 1E vs D). Fourteen days post-infection animals regained lost weight and demonstrated intact intestinal epithelium with lymphocytic infiltrates having replaced acute neutrophilic infiltrates (Fig. 1F).
Mice pre-colonized with C. sardiniense developed more rapidly lethal infection (Fig 1B; p<0.0001), with epithelial sloughing and neutrophils entering the lumen at 20h of infection (Fig. 1G) followed by widespread mucosal denudation and rapid demise (Figs. 1H).
Toxin levels (Fig 1I) at 20h, the first point of symptoms, were comparable among cohorts though pathogen vegetative and spore biomass in C. sardiniense co-colonized mice were 3-fold higher (Fig. 1J–K). However, by 24h C. difficile monocolonized and C. sardiniense co-colonized mice demonstrated 2–3-fold higher toxin levels, vegetative biomass, and neutrophilic infiltrates than P. bifermentans-co-colonized mice (Fig. 1I–J). After 14 days toxin levels in surviving P. bifermentans-co-colonized mice fell >80% from acute levels (Fig. 1I).
While C. sardiniense biomass rose 10-fold in C. difficile-infected mice, P. bifermentans biomass did not change acutely. Commensal colonization also did not alter toxin integrity or cytotoxic activity (Fig. 1L–M).
Commensals condition the gut nutrient environment prior to C. difficile’s introduction.
Given commensal effects on pathogen biomass, carbon source enrichment analyses of the gut metabolomic environment evaluated the nutrient content available for C. difficile growth and metabolism (Figs. 2A–B).
Figure 2: Commensal alteration of cecal carbon sources.

A: Significantly enriched carbon source groups in germfree (LH side) versus monocolonized mice (RH side), showing groups with a Benjamini-Hochberg corrected p value≤0.05. Horizontal bars indicate %biochemicals enriched in each carbon source group comparing germfree cecal contents with C. sardiniense-monocolonized mice (CSAR) at 7d (top), P. bifermentans monocolonized mice (PBI) at 7d (middle), or C. difficile monocolonized for 20h (bottom). B. Significantly enriched carbon sources between C. difficile monocolonized mice at 20h of infection (RH side) vs C. sardiniense monocolonized for 7d + 20h of C. difficile infection (top) or P. bifermentans monocolonized for 7d + 20h of C. difficile infection (bottom). C-H and J-L: Specifically enriched compounds (Y-axis) across colonization states (X-axis). Z-axis shows original scale mass spectrometry counts. Error bars indicate standard deviation. Values for a given compound are comparable across experimental groups. C. Carbohydrates. D: Stickland donor amino acids. E. Stickland acceptor and other fermentable amino acids. F: Hypoxanthine and uracil metabolites. G: Cecal SCFAs. Z-axis shows mM of SCFA per gram of cecal contents, H. Proline Stickland metabolite 5-aminovalerate.. I: Heatmap of C. difficile and P. bifermentans-specific Stickland aromatic amino acid and histidine metabolites in cecal contents at 24h of infection. Color scale shows glog transformed MassSpec metabolite counts. Hierarchical clustering by Pearson similarity and minimum-distance linkage are shown by metabolite on the left Y axis. J: Muricholate, K: Chenodeoxycholate, and L: Cholate and Ursodeoxycholate bile acids among conditions. Additional supporting information is found in supplemental files Data S1: Carbon Source Enrichment Studies in Specifically-associated Mice, and Data S5: Carbon Source Enrichment Analyses in Specifically-associated Mice.
Germfree cecal contents were enriched for multiple classes of carbohydrates (Fig 2A, 2C) including hexoses, pentoses, and sugar alcohols of dietary origin that have poor absorption from the gut (Pruss and Sonnenburg, 2021; Theriot et al., 2014). Gut contents were also enriched for multiple fermentable amino acids (Figs. 2D–E) including the Stickland acceptor amino acid proline (Fig. 2E), and multiple purines and pyrimidines (Fig. 2A, 2F). In the absence of colonizing microbiota SCFA were not detected (Fig. 2G).
Colonization with C. sardiniense or with P. bifermentans markedly altered luminal conditions prior to C. difficile’s introduction. C. sardiniense monocolonization enriched multiple amine-containing carbon sources (Fig 2A, top) including Stickland-fermentable amino acids (Figs. D-E), γ-glutamyl-amino acids (Griffith et al., 1979), and polyamines. Branched chain amino acids increased 2–3-fold (Fig. 2D) and ornithine >16-fold over germfree levels (Fig. 2E).
C. sardiniense depleted luminal fructose, left mannitol/sorbitol unchanged, and enriched amino sugars, including ones originating from host glycoconjugates (Fig. 2C). C. sardiniense monocolonization produced >5-fold increases in hypoxanthines, metabolites produced by other purinolytic Clostridia (Bradshaw, 1960) (Fig. 2F), and >10-fold increases in the uracil metabolites 3-ureidopropionate and beta-alanine (Vogels and Van der Drift, 1976) (Fig 2F). SCFA fermentation metabolites acetate and butyrate were produced (Fig. 2G).
In contrast, P. bifermentans monocolonization depleted polyamines, Stickland acceptor and other fermentable amino acids (Fig. 2A, middle), consuming >70% of proline, >50% of glycine, >50% of threonine, and 80% of 4-hydroxyproline, a host collagen degradation product which many Stickland fermenters convert to proline (Fig. 2E; (Huang et al., 2018)). P. bifermentans produced abundant 5-aminovalerate (Fig. 2H) from proline, isocaproate from reductive leucine Stickland metabolism (Kim et al., 2006), and isobutyrate, isovalerate and 2-methylbutyrate from Stickland oxidative fermentation of branched-chain amino acids (Fig. 2G). Stickland aromatic amino acid metabolites including 3-phenylpropionate from phenylalanine, 3-(4-hydroxy-phenylpropionate) from tyrosine, and indole lactate from tryptophan were also produced (Fig. 2I).
P. bifermentans consumed >50% of fructose, left sugar alcohol levels unchanged (Fig 2C) and produced acetate and propionate (Fig 2G). P. bifermentans monocolonization enriched hypoxanthines (Fig 2F). 3-ureidopropionate increased to a lesser extent than in C. sardiniense monocolonized mice, and without increased beta-alanine (Fig 2F).
C. difficile monocolonized mice demonstrated the broadest depletion of carbohydrate and amine-containing carbon sources (Fig 2A, bottom). The pathogen depleted Stickland acceptor amino acids consuming >50% of glycine, >70% of proline and >85% of 4-hydroxyproline (Fig. 2E), with concomitant increase in 5-aminovalerate (Fig. 2H). γ-glutamyl-amino acids, other fermentable amino acids including cysteine and threonine, and N-acetyl conjugates of proline, branched-chain amino acids, and polyamines were also depleted. Hexoses, pentoses and sugar alcohols were depleted, including >99% of mannitol/sorbitol and >80% of fructose (Fig. 2C).
C. difficile monocolonization produced acetate (Fig. 2G) and Stickland branched-SCFA metabolites isobutyrate, isovalerate, 2-methylbutyrate and isocaproate (Fig. 2G). Aromatic amino acid metabolites specific to the pathogen’s Stickland metabolism were also produced, including phenylacetate and phenyllactate from phenylalanine, indole acetate from tryptophan, and p-cresol from the p-hydroxyphenylacetate metabolite of tyrosine metabolism (Passmore et al., 2018; Steglich et al., 2018) (Fig. 2I). C. difficile has unique capacity to metabolize histidine producing imidazole lactate and 4-imidazole acetate (Neumann-Schaal et al., 2019) (Fig. 2I).
By 24h of infection, with deteriorating mucosal conditions (Figs. 1G–H), C. sardiniense and C. difficile co-colonized mice (Fig. 2B, top) further enriched Stickland and other fermentable amino acids (Fig. 2D–E) as gross blood, known to be abundant in Stickland-fermentable amino acids (Takach et al., 2014), entered the gut lumen (Fig. 1H). Uracil levels increased >8-fold and 3-ureidopropionate increased >40-fold compared to C. difficile monocolonized mice (Fig. 2F). In contrast, P. bifermentans and C. difficile-co-colonized mice showed nominal differences in amine-containing carbon sources compared to C. difficile-monocolonized mice (Fig. 2D–E). P. bifermentans-specific aromatic amino acid metabolites predominated in the co-colonized state, with reduced levels of C. difficile-specific histidine metabolites, suggesting a dominance of P. bifermentans’s Stickland metabolism (Figs. 2I). These findings illustrated C. sardiniense’s capacity to create a nutrient enriched environment for C. difficile while P. bifermentans depleted preferred nutrients.
Microbial colonization altered additional host and microbial-origin metabolites. All three species enriched primary bile acids capable of inhibiting C. difficile germination, including β-muricholate (Fig 2J), and chenodeoxycholate (Fig 2L), and others with germination-stimulatory effects including cholate and taurocholate (Fig 2K) (Francis et al., 2013; Sorg and Sonenshein, 2009). All three species deconjugated host taurine-conjugated bile acids per detectable cholate, ursodeoxycholate (Fig 2L) and chenodeoxycholate (Fig 2K). In contrast, only C. difficile demonstrated 7α-hydroxysterol dehydrogenase activity (Bakonyi and Hummel, 2017) per detectable 7-ketodeoxycholate in mono- and co-colonized states (Fig. 2L). P. bifermentans increased host-origin compounds with anti-inflammatory and neuro-transmitter activities including ethanolamide endocannabinoids, sphingosine-containing compounds, and metabolites of amino acid fermentations (Fig. 2B, middle) (Lee et al., 2016).
P. bifermentans and C. sardiniense differentially modulate C. difficile gene expression in vivo.
The commensal alterations in gut nutrients drove global perturbations in C. difficile gene expression (Figs. 3A–D). C. difficile in monocolonized mice induced transport and metabolic systems for glucose, fructose, ribose and disaccharides (Figs. 3A, 3C), dipeptides and oligopeptides, and Wood-Ljungdahl pathway genes for CO2 fixation to acetate. By 24h the pathogen up-regulated ethanolamine utilization genes, enabling capacity to use ethanolamine and amino-alcohol lipids from damaged mucosa (Nawrocki et al., 2018).
Figure 3: C. difficile-expressed pathways enriched in vivo.

Horizontal bars indicate the %genes enriched within the pathway in C. difficile monocolonized mice (LH side) or in mice co-colonized with C. sardiniense or P. bifermentans prior to C. difficile infection (RH side). Pathways with a Benjamini-Hochberg adjusted p value≤0.05 are shown. A: C. difficile monocolonized mice at 20h of infection vs. C. sardiniense and C. difficile co-colonized mice. B: Same comparison as panel A at 24h of infection. C. Same comparison as panel A comparing C. difficile monocolonized with P. bifermentans-co-colonized mice. D: Same comparison as panel D. at 24h of infection. Panels E-H: DESeq-normalized reads for the PaLoc genes. X-axis indicates the colonization condition; Y-axis the Log10 DESeq read counts normalized for biomass differences. Brackets indicate significant DESeq2 adjusted p values: *0.01<p≤0.05; **0.001<p≤0.01; ***0.0001<p≤0.001; ****p≤0.0001 E. tcdA, F. tcdB, G. tcdR and H. tcdE. Additional supporting information is found in supplemental files Data S2: Metatranscripome analyses: Heatmaps of C. difficile Enrichment Analyses, Related to Figure 3, and Data S8: Metaranscriptome Enrichment Analyses, Related to Figures 3, 4 and STAR Methods section: Metatranscriptome Enrichment Analyses.
With C. sardiniense’s enrichment of amino acids and polyamines, C. difficile up-regulated amino acid and polyamine transporters, pathways to convert C. sardiniense-enriched ornithine to Stickland-fermentable substrates (Fonknechten et al., 2009), and its Stickland proline reductase and reductive leucine pathway genes (Fig. 4A–B).
Figure 4: Commensal transcriptome analyses.

Significantly enriched pathways in C. sardiniense and P. bifermentans monocolonized mice and with C. difficile infection. Pathways with Benjamini-Hochberg adjusted p values ≤0.05 are shown. The LH Y-axis shows enriched pathways; X-axis indicates the %enriched genes per category. A: C. sardiniense monocolonized mice at 7d prior to C. difficile infection vs. after 20h of C. difficile infection. B: C. sardiniense and C. difficile co-colonized mice at 20 vs 24h of infection. C: P. bifermentans monocolonized mice at 7d vs after 20h of C. difficile infection. D: P. bifermentans and C. difficile co-colonized mice at 20 vs 24h of infection. Additional supporting information is found in supplemental files Data S3: Metatranscriptome Analyses: Heatmaps of C. sardiniense enrichment analyses, Related to Figure 4, Data S4: Metatranscriptome Analyses: Heatmaps of P. bifermentans enrichment analyses, Related to Figure 4, and Data S8: Metaranscriptome Enrichment Analyses, Related to Figures 3, 4 and STAR Methods section: Metatranscriptome Enrichment Analyses.
With P. bifermentans co-colonization (Fig. 3C–D), C. difficile adapted its metabolism to available nutrients, up-regulating genes to utilize sugar alcohols, particularly for mannitol and galactitol transport, followed by sorbitol, disaccharides, and polysaccharides, carbon sources not utilized by P. bifermentans (Moore, 1993). C. difficile also upregulated genes for the transport and metabolism of xanthines (Bradshaw, 1960) concomitant with P. bifermentans’ enrichment of these compounds.
In the presence of either commensal, C. difficile downregulated cobalamin (Figs. 3A–D), and folate biosynthesis genes when co-colonized with C. sardiniense (Fig. 3A), suggesting commenal-C. difficle cross-feeding with these nutrients.
Commensal colonization profoundly altered the pathogen’s cellular machinery. With C. sardiniense co-colonization C. difficile up-regulated genes associated with transcription and DNA replication (Fig. 3A–B). In contrast, by 20h in P. bifermentans co-colonized mice, the pathogen significantly down-regulated translation, ribosome production, and ATP synthesis (Fig. 4C–D).
C. difficile expressed stress response genes as host inflammation evolved (Costa et al., 2016; Knippel et al., 2020), responses altered with commensal co-colonization. By 20h of infection C. difficile monocolonized mice enriched CRISPR-gene expression and two temperate bacteriophage (Arndt et al., 2019) with homology to phiMMP01 (locus 3; Fig. 3A), and phiCDHM19 (locus 2; Fig. 3A). Diffocin lytic genes (Gebhart et al., 2015), a phage-origin locus induced by quorum sensing that can lyse other C. difficile, and cell wall turnover enzymes were also enriched. In C. sardiniense-co-colonized mice, C. difficile induced sporulation pathways and oxidative stress responses including nitroreductases, spore-associated superoxide dismutase (sodA), catalase (cotG), and genes for terpenoid backbone synthesis, peptidoglycan and spore coat components with anti-oxidant activities (Bosak et al., 2008). Two additional bacteriophage loci with homology to phiMMP03 (loci 1 and 5; Fig 3B) were induced. In contrast, none of these systems showed up-regulation with P. bifermentans co-colonization (Fig. 3C–D).
Each commensal differentially affected C. difficile’s PaLoc expression which, in combination with alterations in pathogen biomass, impacted toxin levels and host disease (Fig 1I–J). The biomass-adjusted expression of tcdB, tcdA and tcdE in C. difficile monocolonized and P. bifermentans co-colonized mice remained comparable at 20 and 24h of infection (Figs. 3E–G), in spite of a 12-fold increase in tcdR expression in P. bifermentans-co-colonized mice (Fig. 3H). While C. sardiniense co-colonized mice showed reduced tcdB, tcdA and tcdE expression at 20 and 24h of infection, these effects occurred in the context of higher pathogen vegetative biomass and released toxin in cecal contents (Fig. 1I–J).
C. difficile infection profoundly alters commensal gene expression.
C. difficile infection also systematically altered each commensal’s gene expression, metabolism and stress responses (Figs. 4A–D). C. sardiniense-monocolonized mice expressed systems involved in mucin degradation and metabolism and the biosynthesis of cobalamin and folate (Fig. 4A). Three bacteriophage loci, two with homology to Clostridial bacteriophage vB_CpeS_CP51 (loci 3 and 1), and one with homology to phiCT19406B (locus 4; Fig. 4A, bottom), were also induced (Arndt et al., 2019).
By 20h of infection, concomitant with evolving mucosal damage, C. sardiniense profoundly downregulated its mucin degradation machinery (Fig 4A) while inducing genes for ascorbate transport and metabolism (Fig 4A), systems that protect against oxidative stress. Multiple peptide and amino acid transport systems, and genes involved in the transport and metabolism of xanthines, were enriched. By 24h C. sardiniense had profoundly down-regulated ribosome production and sporulation. Energy generation and transport by 24h of infection were also significantly affected with down-regulation of multiple electron transport systems and C. sardiniense’s nickel-based hydrogenase (Fig 4B) while up-regulating expression of F-type ATP synthesis genes (Fig 4B).
In monocolonized mice P. bifermentans showed high expression of its Stickland reductase systems (Fig 4C) in addition to protein translation and export, and energy generation. As with C. sardiniense, P. bifermentans up-regulated cobalamin synthesis genes. By 20h of infection these processes showed reduced gene expression compared to the monocolonized state (Fig 4C) with enrichment of multiple amino acid transport systems and a putative bacteriophage with homology to phiCT19406A (Arndt et al., 2019). By 24h of infection, P. bifermentans induced expression of genes for ethanolamine utilization (Fig 4D), suggesting a re-tooling of its metabolism for newly available carbon sources from damaged mucosa, in addition to genes for riboflavin transport and biosynthesis. Multiple stress response systems including lexA, relA and CSP-family cold shock proteins were down-regulated by 24h of infection, in addition to genes involved in ribosome production, cell division and flagellar motility (Fig 4D).
Differential contributions of commensal arginine fermentation on C. difficile virulence.
C. sardiniense and P. bifermentans can each ferment arginine to ornithine via the arginine deiminase (ADI) pathway, a system that C. difficile lacks (Pols et al., 2020). However, C. difficile P. bifermentans, and other Stickland fermenters can convert ornithine to Stickland-fermentable substrates (Fonknechten et al., 2009). The species-level context of the ADI pathway demonstrated very different outcomes on C. difficile growth and host survival (Fig 5).
Figure 5: Commensal-pathogen ornithine cross-feeding.

A: C. sardiniense’s arginine deiminase pathway genes. Panels B-E: Log10 DESeq2 normalized ADI gene expression. B: arcA, arginine deiminase (****p=0.0001; *p=0.0387), C: arcB, ornithine carbamoyltransferase, D: arcD, arginine:ornithine antiporter (****p=0.0008), and E: arcC, carbamate kinase (*p=0.0259). F: C. difficile ornithine to alanine conversion genes (operon_0246) and unlinked ornithine cyclodeaminase (UAB_RS0203800). Panels G-O: DESeq2 normalized expression for operon_0246 genes, *0.01≤p<0.05; **0.001≤p<0.01; ***0.0001<p≤0.001; ****p≤0.0001. G: ord, 2,4-diaminopentanoate dehydrogenase, H: ortA, 2-amino-4-ketopentanoate thiolase α subunit and I: ortB, β subunit, J: oraS, D-ornithine aminomutase S component, K: oraE, D-ornithine aminomutase E component, L: ora_ARF, reactivating factor for adenosylcobalamine-dependent D-ornithine aminomutase, M: orr, ornithine racemace, N: nhaC, Na+/H+ antiporter. O: ornithine cyclodeaminase (OCD) expression. P: Schematic of P. bifermentans ADI and OCD genes. Q: arcA, arginine deiminase, R: arcB, ornithine carbamoyltransferase, S: arcC, carbamate kinase T: arcD, arginine:ornithine antiporter (*p=0.0227), and U: OCD. V: Schematic showing differing effects of the ADI arginine fermentation in C. sardiniense and P. bifermentans on C. difficile metabolism.
By 20h of infection, C. sardiniense upregulated expression of its arcA arginine deiminase (Fig. 5B), arcC carbamate kinase (Fig. 2E), and arcD arginine:ornithine antiporter (Fig. 2D) which imports arginine and exports the ornithine product, identifying a cause for the elevated ornithine in C. sardiniense monocolonized mice (Fig. 2E). In C. difficile the most strongly enriched genes with C. sardiniense co-colonization converted ornithine to alanine (Fig 5F–N), a product able to support oxidative Stickland metabolism, cell wall and protein synthesis, and other growth-promoting pathways (Peltier et al., 2011; Shrestha et al., 2017). C. difficile’s OraSE D-ornithine aminomutase (Fig. 5J–K) requires cobalamin (Chen et al., 2001), another factor for which C. sardiniense induced biosynthetic gene expression prior to C. difficile’s introduction (Fig. 4A). The pathogen’s ornithine cyclodeaminase (Fig. 5F) which converts ornithine to the Stickland acceptor proline remained constitutively expressed (Fig. 5O).
In contrast to C. sardiniense, at 20h of infection P. bifermentans down-regulated its arcD arginine:ornithine antiporter (Fig. 5P, 5T) while maintaining constitutive expression of its ornithine cyclodeaminase (Fig. 5U) conserving a proline-convertible carbon source for its Stickland metabolism (Fig. 5D).
Figure 5V illustrates putative inter-species effects of ADI fermentation on C. difficile in vivo. While the non-Stickland fermenter C. sardiniense enriched luminal ornithine for C. difficile’s use, P. bifermentans’s combined ADI and Stickland pathways supported its own metabolism and growth, depriving C. difficile of these growth-promoting carbon sources.
Systems biologic models predict epistatic effects of C. difficile’s CodY and CcpA PaLoc metabolic repressors on pathogen phenotypes in vivo.
CcpA and CodY repress C. difficile toxin expression when sufficient GTP, Stickland-fermentable substrates and carbohydrates support metabolism (Dubois et al., 2016). Their absence supports toxin gene de-repression. PRIME model predictions inferred additional epistatic effects of codY and ccpA on the pathogen’s ability to grow in vivo (Arrieta-Ortiz ML, et al. In revision). Using recently optimized genetic manipulation systems to create serial deletion mutants in C. difficile (Star Methods) we evaluated effects of these regulators in the gnotobiotic and P. bifermentans-co-colonized states (Figs. 6).
Figure 6: Combinatorial effects of C. difficile’s CodY and CcpA PaLoc metabolic repressors on infection in mono- and P. bifermentans co-colonzied mice.

A. Survival curves of GF and P. bifermentans co-colonized mice infected with C. difficile wild-type (WT) or mutant strains; n=at least 6 mice/group. All P. bifermentans co-colonized mice survived and differed significantly from monocolonized controls (p<0.0001). ΔcodY-infected mice declined more rapidly than WT-infected mice (p=0.01), while lethality in ΔccpA-infected mice was delayed (p=0.0002). B-D: Cecal biomass and extracellular toxinB levels. Blue: C. difficile-associated mice; Green: mice monocolonized with P. bifermentans and infected with C. difficile. Asterisks indicate Mann-Whitney p values: *0.01<p≤0.05; **0.001<p≤0.01; *** 0.0001<p≤0.001; ****p≤0.0001. B: Log10 of ug toxinB levels per gram of cecal contents. C: Cecal Log10 of C. difficile vegetative cells and D: spores at 16, 24h, and at 14d in surviving P. bifermentans co-colonized mice. E-F: Ratio of acutal mutant:WT strain growth at 24h of infection (grey bars) versus PRIME model predictions in monocolonized (blue bars; E) and P. bifermentans co-colonized mice (green bars; F). Asterix indicate significant t test p values in comparisons of mutant vs. wild-type C. difficile strain growth at 24h of infection; *<0.05, **<0.01, ***<0.001. Dashed red lines indicate the PRIME threshold below which a given mutant is predicted to limit in vivo growth relative to WT. Additional supporting information of host body mass changes and P. bifermentans biomass is found in Supplemental Figure 2: Infection with ΔcodY, ΔccpA, and ΔcodY ΔccpA mutant strains, Related to Figure 6.
ΔcodY, ΔccpA, and double ΔcodYΔccpA C. difficile mutants were each lethal in monocolonized mice while P. bifermentans-co-colonized mice survived (Figs. 6A). Pathogen cecal biomass and toxin levels identified P. bifermentans’s effects on toxin production among strains (Figs. 6B–D). P. bifermentans-co-colonized mice infected with the ΔccpA mutant demonstrated reduced C. difficile vegetative biomass and toxin at 16h (Figs. 6B–C). At 24h of infection, toxin levels were comparable between colonization states with the mutant and fell >80% by 14 days in surviving P. bifermentans-co-colonized mice (Figs. 6C).
In contrast, ΔcodY-infected mice had better growth with P. bifermentans-co-colonization, while the double mutant grew poorly (Fig. 6B). At 16h of infection the ΔcodY mutant showed comparable vegetative biomass in monocolonized and co-colonized states, and elevated spore biomass in P. bifermentans-co-colonized mice (Fig. 6D). Toxin levels with the ΔcodY mutant were elevated at 16h as compared to wild-type controls, though levels in P. bifermentans-co-colonized mice were 70% lower than in ΔcodY monocolonized controls (Fig. 6C). However, from 16 to 24h, toxin levels fell >40-fold in P. bifermentans-co-colonized mice (Fig. 6D), in spite of the ΔcodY mutant’s higher vegetative biomass at 24h in co-colonized mice (Figs. 6B).
In C. difficile monocolonized mice PRIME model predictions inferred single and double mutant strain dysregulation of central carbon metabolism, and lipid and nucleotide biosynthesis, limiting growth in this nutrient-rich state as compared to wild-type (Fig. 6E) (Arrieta-Ortiz ML, et al. In revision). In contrast, in the P. bifermentans nutrient-depleted state (Fig. 6F), PRIME predicted single CodY or CcpA deletion to be non-essential for mutant growth relative to wild-type, but severe growth repression in the double mutant per epistatic interactions of CodY and CcpA on genes supporting metabolism of remaining gut-available carbon sources, namely sugar alcohols, polysaccharides and supporting electron transport systems, combined with dysregulation of essential genes in lipid, cell wall and nucleotide biosynthesis (Arrieta-Ortiz ML, et al. In revision). These findings illustrated P. bifermentans’s continued protection in the absence of the CodY and CcpA metabolic PaLoc repressors and predicted putative targets within these regulons that modulate the pathogen’s adaptations to diverse in vivo environments.
P. bifermentans bacteriotherapy rescues infected conventional mice.
To assess P. bifermentans’ use as a therapeutic, clindamycin-treated conventional mice were orally challenged with 1,000 C. difficile spores. At the onset of symptomatic infection mice received 108 CFU of P. bifermentans or vehicle-only control by gavage (Fig. 7A). All P. bifermentans-treated mice survived while control-treated mice demonstrated 40% lethality (Fig. 7B, p=0.0061). At 30h post-C. difficile challenge, at the height of symptomatic infection, P. bifermentans-treated mice demonstrated reduced toxin levels and pathogen vegetative and spore biomass (Fig. 7C–E). By 14 days surviving mice had low to undetectable toxin (Fig 7C) and had largely cleared both species (Figs. 7D–E).
Figure 7: P. bifermentans oral bacteriotherapy protects C. difficile infected conventional mice.

A: Experimental overview. Samples for timed analyses (circles) were taken before and after clindamycin, at 30h post-infection (12h post-treatment), and at 14d in surviving mice. B: Survival curve; blue: C. difficile-infected and vehicle control treated; green: P. bifermentans treated mice showed improved survival (p=0.0081). C-E: Cecal toxin and C. difficile biomass. Horizontal dotted line shows thresholds of detection. C: Log10 ug ToxinB/g in cecal contents (*p=0.026). D: Cecal Log10 C. difficile vegetative (**p=0.0087) and E: spore biomass (p=*0.0411). F: Carbon source enrichment analyses in mice pre- and post-clindamycin treatment show enriched groups with a Benjamini-Hochberg corrected p value ≤0.05. G: Enriched carbon source groups between post-clindamycin treated and mice at 30 hours of infection with C. difficile (top) or with P. bifermentans treatment (bottom). Additional supporting information of host body mass changes and P. bifermentans biomass are found in Supplemental Figure 3: P. bifermentans administered as an oral bacteriotherapeutic protects C. difficile infected conventional mice, Related to Figure 7. Supporting data for carbon source enrichment results are found in Data S5: Cabon Source Enrichment Analyses in Conventional Mice, Related to Figure 7, and Data S9: Carbon Source Enrichment Analyses in Conventional Mice, Related to Figure 7 and STAR Methods section: Carbon Source Enrichment Analyses.
Clindamycin treatment enriched multiple carbon sources able to support C. difficile and P. bifermentans growth including Stickland acceptor amino acids, polyamines, and γ-glutamyl-amino acids (Fig. 7F–G), nutrients also enriched in C. sardiniense-monocolonized mice (Fig. 2A). In control infected mice, the pathogen depleted oligosaccharides, pentoses, Stickland acceptor- and γ-glutamyl-amino acids (Fig. 7G, top). With P. bifermentans treatment, these and additional compounds were depleted (Fig. 7G, bottom). Clindamycin treatment also depleted host ethanolamine endocannabinoids and sphingosines, compounds with improved recovery in P. bifermentans-treated mice (Fig. 7G). These findings validated P. bifermentans’ therapeutic efficacy in an infected conventional host through reductions in pathogen biomass and toxin.
Discussion
We leveraged systems biologic approaches to understand C. difficile’s in vivo responses to protective versus disease-promoting commensals. Using a tractable gnotobiotic infection model we identified the remarkably protective effects of a single commensal species, P. bifermentans, against C. difficile, and capacity for another Clostridial species, C. sardiniense, to cause worse disease. Findings informed interventional studies in conventional, antibiotic-treated mice where P. bifermentans administration rescued infected mice from lethal infection. These findings have important implications to treat and prevent C. difficile infections, including that residual microbiota and those in uncharacterized FMT preparations can contain protective and disease-exacerbating species that may exhibit different behaviors in antibiotic-depleted versus intact microbiota.
Development and severity of C. difficile infection occurs as a function of the pathogen’s biomass, toxin production, and duration to which host tissues are exposed to toxin. Each commensal modulated C. difficile’s virulence through multiple mechanisms (graphical abstract). Commensal colonization altered the gut nutrient environment per enrichment or depletion of C. difficile-preferred carbon sources and required micronutrients, factors that modulated the pathogen’s growth, stress responses, and toxin production.
Commensal colonization also affected pathways impacting C. difficile’s cellular integrity. C. difficile monocolonized mice up-regulated diffocins, a locus induced through quorum-sensing mechanisms that lyses a portion of the population, releasing toxin to promote mucosal damage and nutrient release to support surviving populations (Gebhart et al., 2015). Multiple temperate bacteriophage harboring lytic peptidoglycan hydrolases were induced in monocolonized and C. sardiniense co-colonized mice (Garneau et al., 2018). Sporulation also induces lytic transglycosylases including UAB_RS0210585 (CD630_18980), a SigK-regulated gene believed to be involved in mother cell lysis (Saujet et al., 2013), that was significantly up-regulated in C. difficile and C. sardiniense co-colonized mice. While these processes have been demonstrated to contribute to toxin release in other toxigenic species including C. perfringens, Shigella and ETEC (Bielaszewska et al., 2012; Duncan, 1973; El Meouche and Peltier, 2018), they warrant further analysis regarding their role in C. difficile pathogenesis.
In response to C. sardiniense’s enrichment of amine-containing carbon sources C. difficile up-regulated multiple amino acid transporters, Stickland fermentation pathways, and genes to convert C. sardiniense enriched ornithine to Stickland metabolizable substrates. C. difficile and C. sardiniense biomass expanded and, with nutrient release from damaged tissues, further stimulated microbial growth and toxin production, resulting in a rapidly lethal infection.
Notably, C. sardiniense and P. bifermentans possess arginine deiminase fermentation pathways, a system that modulated very different effects in vivo with C. difficile infection (Fig. 5E). With C. sardiniense, the commensal’s export of ornithine provided one among many enriched nutrient sources for C. difficile. In contrast, P. bifermentans’s production of ornithine with conversion to proline for its own metabolism, would deprive C. difficile of this nutrient source, while enhancing its ability to compete against the pathogen. This example highlights the importance of the underlying genomic and metabolomic context of pathways shared among commensal species when considering their effects on other microbes and on host phenotypes.
P. bifermentans limited C. difficile’s growth and toxin production through multiple mechanisms including in the absence of C. difficile’s CodY and CcpA PaLoc repressors. As a glycolytic and active Stickland fermenter, P. bifermentans depleted fructose and amino acids preferred by C. difficile, leaving sugar alcohols, complex polysaccharides, and P. bifermentans-enriched hypoxanthines available. C. difficile adjusted its metabolism for these carbon sources but by 24h of infection showed reduced biomass and toxin compared with monocolonized and C. sardiniense-co-colonized mice. P. bifermentans co-colonization also down-regulated pathogen genes supporting translation and ribosome production in addition to cellular lytic systems and oxidative stress pathways, suggesting additional mechanisms by which P. bifermentans could reduce the host’s exposure to toxin (graphical abstract). PRIME model predictions inferred additional combinatorial effects of CodY and CcpA on gene networks for metabolic adaptations, electron transport, and biosynthetic reactions to support growth under the complex nutrient conditions encountered in vivo.
Host symptomatic infection, as evidenced by epithelial damage with neutrophil entry into the gut lumen, induced oxidative stress systems in all 3 species. C. difficile and C. sardiniense strongly induced sporulation responses when co-colonized, including the spore coat proteins superoxide dismutase (sodA) and manganese catalase (cotG), responses that may illustrate how sporulation in the confined space of the gut lumen can benefit vegetative cell populations of the same and other species by detoxifying host-produced ROS. Notably, P. bifermentans can grow in concentrations of up to 10% O2 (STAR methods) (Katarzyna Leja, 2014), conditions under which C. sardiniense and C. difficile cannot survive, an additional factor that may support its ability to compete with C. difficile during gut inflammation. P. bifermentans colonization also reduced the severity of the host’s acute inflammatory responses (Fig. 1E, graphical abstract), in part from reduced host exposure to high levels of C. difficile toxin (Fig 1I).
Interventional studies in antibiotic-treated conventional mice illustrated P. bifermentans’ efficacy as an oral bacteriotherapeutic. Clindamycin treatment enriched multiple amino acid and carbohydrate sources, including ones enriched in GF and C. sardiniense monocolonized mice, illustrating relevance of findings from germfree infection studies to complex microbiota. These findings support a broader systems-level view for perturbations that create complex nutrient states conducive to C. difficile colonization and rapid growth in vivo given the pathogen’s diverse carbon source metabolism and adaptation to different gut environments. Notably, nutrient conditions enhancing C. difficile growth can also enhance the growth of commensal Stickland fermenters. Within the colon, unabsorbed dietary and host factors, mucins in particular, provide fermentable carbohydrates and amino acids, including the Stickland acceptors proline, glycine and leucine (Wesley et al., 1985). However, disease-triggering antimicrobials to which C. difficile often harbors innate resistance, such as clindamycin, beta-lactams and fluoroquinolones, rapidly ablate competing Stickland fermenters, opening preferred nutrient sources for C. difficile’s rapid growth (Battaglioli et al., 2018; Peng et al., 2017) with risks for population crashes that can abruptly release toxin.
Stickland fermentation is a hallmark of Cluster XI Clostridial metabolism and occurs in other Clostridial species, notably Clostridium scindens (Cluster XIVa) which carries the proline and glycine reductases but lacks orthologous reductive leucine pathway genes (STAR methods). While conversion of pro-germination primary bile acids to germination-inhibitory secondary bile acids mediates aspects of C. scindens’ protection against C. difficile (Buffie et al., 2015; Thanissery et al., 2017) we show capacity for commensals, singly or in aggregate, to rapidly change the gut nutrient environment to modulate C. difficile’s virulence. Notably, the P. bifermentans and C. sardiniense strains used did not demonstrate 7α-hydroxysterol-dehydrogenase activity in mice, while C. difficile did through its production of 7-ketodeoxycholate (Bakonyi and Hummel, 2017).
Stickland fermenters represent <1% of the human gut microbiota. Our findings highlight the importance of these low-abundance species to consume C. difficile growth-promoting nutrients and identify complex conditions that other commensals, singly or in aggregate, could create to modulate C. difficile’s virulence. These conditions act in concert with the host’s digestive and immune functioning. Host and commensal effects may also explain why C. difficile phenotypes identified in vitro do not necessarily reflect behaviors seen in vivo. Armed with refined mechanistic knowledge, findings establish a robust framework in which to develop therapeutics with enhanced efficacy and improved safety for this disease.
STAR METHODS
Resource availability
Lead Contact:
Lynn Bry, MD, PhD, lbry@bwh.harvard.edu
Materials Availability:
Type collection strains are available from the ATCC (http://www.atcc.org/) and DSMZ strain collections (http://www.dsmz.de).
The pMSR0 plasmid vector used for mutant construction has been deposited into Addgene, ID: 78750.
Mutant strains in C. difficile ATCC43255 may be requested from Dr. Dupuy or Bry’s laboratories or through the Crimson core resource (https://crimson-core.partners.org/). Users requesting infectious C. difficile isolates must provide institutional documentation for strain handling at biohazard level 2.
Chemical reagents and supplies are available as per referenced vendors in the STAR methods.
Gnotobiotic and conventional Swiss-Webster mice are available from Taconic Farms (Taconic, NY) or through the Massachusetts Host-Microbiome Center’s gnotobiotic resource.
Data and Code Availability:
The updated C. difficile ATCC43255 reference genome has been deposited to NCBI under accession# NZ_CP049958.1.
The C. sardiniense genome has been deposited to NCBI under accession# JAIKTU000000000.
Metatranscriptomic datasets are available through NCBI under GEO ID: GSE182613.
Carbon source maps, metabolomic datasets, and statistical results from metabolomic enrichment analyses are available in the supplemental Excel files GF_CarbonSourceEnrichment.xlsx and CONV_CarbonSourceEnrichment.xlsx.
Microbial gene-level content and statistical results from metatranscriptomic analyses are available in the supplemental Excel files TranscriptomeGeneContent.xlsx and RNAseq_TranscriptomeEnrichment.xlsx.
The open source python libraries and code for RNAseq analyses are available from the respective referenced sites in the STAR methods.
EXPERIMENTAL MODEL AND SUBJECT DETAILS
Bacterial strains and culture conditions
Table S1: Strains and Culture Conditions, Related to STAR Methods section: Bacterial strains and culture conditions, shows the bacterial strains and in vitro culture conditions. For quantitation of C. difficile and commensal biomass, mouse cecal contents were collected into pre-weighed Eppendorf tubes with 0.5mL of pre-reduced PBS with 40mM cysteine (Millipore-Sigma, St. Louis, MO) as a reducing agent. Tubes were weighed after adding material and transferred into a Coy anaerobic chamber (Coy Labs, Grass Lake, MI) at 37°C for serial dilutions with plating to selective C. difficile CHROMID® agar (Biomérieux, Durham, NC) or Brucella agar (Becton Dickinson, Canaan, CT) for commensal quantitation. C. difficile colonies were counted at 48 hours of incubation and identified as large black colonies. For the ΔcodY ΔccpA double mutant, colonies were quantitated at 72 hours of incubation. Commensal colonies were counted after 24h of incubation. C. sardiniense were identified as small, round beta-hemolytic colonies, and P. bifermentans as opaque and larger round colonies. Representative colonies were species-confirmed by rapid ANA (Remel, Lenexa, KS). For studies in conventional mice, pre-infection and post-clindamycin fecal pellets showed no positive colonies on C. difficile CHROMID® agar.
For studies of microaerophilic growth, P. bifermentans was cultured in tryptone-yeast (TY) media with resazurin (Moore, 1993), without additional cysteine or other reducing agents, and that had been equilibrated to O2 levels of 0.5%, 1%, 5% and 10% (n=3 cultures per condition). TY media exposed to 0.5% O2 or higher levels of oxygen caused oxidation of the resazurin dye. Control samples were incubated in TY under anaerobic gas mix or ambient air (21% O2) as a negative control. Samples were serially diluted and plated to Brucella agar after 24h of culture at 37°C to quantitate viable CFU.
C. difficile spore preparations and counts were defined by exposing pre-weighed material to 50% ethanol for 60 minutes followed by serial dilution and plating to C. difficile CHROMID® agar, as described (Bucci et al., 2016). Vegetative cell biomass was calculated by subtracting the spore biomass from the total biomass and normalizing to the cecal mass. Data were evaluated in Prism 8.0 (GraphPad, San Diego, CA) for visualization and log-rank tests of significance among groups. A p value <0.05 was considered significant.
Construction of C. difficile mutant strains
Table S2: Plasmids and Oligonucleotides Used, Related to STAR Methods section Construction of C. difficile mutant strains, indicates plasmid vectors and primer sequences (IDTDNA, Redwood City, CA) used to generate gene-deleted mutants in ATCC43255. Mutants were created using the toxin-mediated Allele-Coupled Exchange (ACE) vector (Girinathan BP, 2020). For deletions, allelic exchange cassettes were designed to have approximately 900 bp of homology to the chromosomal sequence in both up- and downstream locations of the sequence to be altered. The homology arms were amplified by PCR from C. difficile strain ATCC43255 genomic DNA and purified PCR products were cloned into the PmeI site of pMSR0 using NEBuilder’s HiFi DNA Assembly. pMSR0-derived plasmids were transformed into E. coli strain NEB10β and inserts verified by sequencing. Plasmids were then transformed into E. coli HB101 (RP4) and transferred by conjugation into C. difficile ATCC43255 after a brief period of heat shock as described (Kirk and Fagan, 2016).
Mouse Studies
All animal studies were conducted under an approved institutional IACUC protocol. Defined-colonization experiments were conducted in negative pressure BL-2 gnotobiotic isolators (Class Biologically Clean, Madison, WI). Conventional studies were conducted in OptiMice containment cages (Animal Care Systems, Centennial, CO) (Lavin et al., 2018). Mice were singly housed for all studies.
Gnotobiotic Mouse Colonization Studies
One week prior to infection with C. difficile equal ratios of 6–7 week old male and female gnotobiotic mice were gavaged with 1×10⁸ CFU of P. bifermentans, C. sardiniense, or sterile vehicle control, and allowed to colonize for 7 days prior to challenge with 1×10³ of wild-type or mutant C. difficile spores. Fecal pellets from mice were cultured prior to infection to confirm association with the defined species, or maintenance of the GF state. Progression of disease was assessed via body condition scoring (Fekete et al., 1996) and body mass measurements taken by ethylene-oxide sterilized, battery powered OHAUS scales (Thermo-Fisher, Waltham, MA). Mice were sacrificed at a BCS of 2-, or at defined timepoints at 7 days of commensal monocolonization or GF controls, and at 20, 24h or 14 days post-C. difficile challenge. For C. difficile mutant infection studies, timepoints at 16h and 24h post-challenge were collected. Cecal contents were collected for functional studies. The GI tract and internal organs were fixed in zinc-buffered formalin (Z-FIX, Thermo-Fisher, Waltham, MA) for histopathologic assessment.
Conventional Mouse Infection Studies
5-week old conventional mice (Taconic Farms, Inc., Taconic, NY) were singly housed and acclimated for a week prior to treatment with USP-grade clindamycin phosphate (10mg/kg; Sigma Chemical, St. Louis, MO) via intraperitoneal (IP) injection. 24 hours post-clindamycin treatment, mice were challenged with 1×10³ wild-type C. difficile spores via oral gavage and treated with 1×10⁸ CFU of P. bifermentans or vehicle control at 12h post C. difficile challenge, the earliest point of symptomatic diarrhea in conventional mice. Progression of disease was assessed via BCS and body mass measurements. Survival studies were followed to 14 days post C. difficile challenge. For C. difficile biomass, toxin B levels and cecal metabolomic studies, 12 mice per group were also sacrificed and cecal contents collected at pre-clindamycin treatment, post-clindamycin treatment just prior to C. difficile challenge, 30 hours post C. difficile challenge (18 hours after receiving P. bifermentans or vehicle control by gavage), and at 14 days following control or P. bifermentans treatment.
METHODS DETAILS
Histopathologic Analyses
Formalin-fixed gut segments from GF or specifically-associated mice were paraffin embedded and 5μm sections cut for staining with hematoxylin and eosin (H&E; Thermo-Fisher, Waltham, MA) as described (Bry and Brenner, 2004). Slides were visualized under a Nikon Eclipse E600 microscope (Nikon, Melville, NY) to assess epithelial damage per cellular stranding and vacuolation, the nature of Inflammatory infiltrates, mucosal erosions, and tissue edema. Lumenal neutrophils were quantified by a Pathologist by evaluating ten 400X high powered fields (HPFs) across at least 3 colonic sections per mouse. Neutrophils were identified by presence of segmented nuclei and pale to finely granular cytoplasm (Belzer et al., 2011). Data were plotted in Prism and comparisons among colonization states by timepoint evaluated by Mann-Whitney log-rank test.
Toxin B ELISA
Cecal toxin B levels were quantified as described (Zarandi et al., 2017). Briefly, microtiter plates were coated with 5 μg/mL of anti-TcdB capture antibody (BBI solutions, Madison, WI). Supernatants of spun cecal contents and standard curve controls of toxin B (ListLabs, Campbell, CA) were assayed in triplicate. After incubation and washing with anti-toxin B biotinylated antibody (mouse-anti-C.difficile TcdB; BBI solutions, Madison, WI) followed by high Sensitivity Streptavidin-HRP conjugate (Thermo-Fisher, Waltham, MA), signal was detected with TMB substrate (Thermo-Fisher, Waltham, MA) at 450nm using a BioTek Synergy H1 plate reader (Biotek Instruments Inc, Winoski, VT). Values were analyzed in Prism 8.0 (GraphPad, San Diego, CA) to calculate μg of toxin B/gram of cecal contents. Significant differences among groups were evaluated by non-parametric Kruskal-Wallis ANOVA and Dunn’s post-test. A p value ≤0.05 was considered significant.
Effects of Colonization on Toxin Function
The Quidel C. difficile cell culture functional toxin assay (Beck et al., 2014) was used to evaluate if commensal colonization altered the functional toxicity of C. difficile toxin. Cecal contents were collected from germfree mice or from mice monocolonized for 7 days with P. bifermentans, or C. sardiniense. 100μL of purified toxin B control solution (Quidel Inc., San Diego, CA) was added to 1 gram of cecal contents and incubated for 30 minutes prior to making 1:10 to 1:500 serial dilutions in the Quidel-provided dilution buffer and adding materials to confluent cultures of human MRC-5 fibroblasts. Fibroblast cells were incubated at 37°C for 48 hours and checked daily by compound microscope for signs of cytopathic effect (CPE) indicated by balling up of cells and loss of adhesion. Additional control samples included cecal contents incubated with toxin B for 30 minutes followed by addition of neutralizing antibody to confirm specificity of CPE by toxin B. Cells where CPE occurred in the presence of toxin B, but not with cecal contents alone or with neutralizing antibody were called positive. All conditions were repeated in triplicate. The highest dilution at which CPE occurred was identified for each condition.
Western blot for Toxin B Integrity
Cecal supernatants from mice at 20h of infection were subjected to SDS-PAGE and transferred to PVDF membrane (PerkinElmer, Waltham, MA) as described (Girinathan et al., 2018). Toxin B was detected by using Sheep Primary Antibody, Donkey Secondary Antibody (R&D Systems, Minneapolis MN), diluted 1:1000 in 5% nonfat dry milk blotting buffer (25mM Tris, pH 7.4, 0.15M NaCl, 0.1% Tween 20), and by chemiluminescence using the SuperSignal West Pico Plus Western Blotting Substrate (part# 34577; Thermo-Scientific, Waltham, MA).
Metabolomic studies
For GF colonization studies cecal contents from 8 mice per group across 2 experimental replicates were harvested from GF mice at baseline, after 7 days of monocolonization with P. bifermentans or C. sardiniense, and at 24h post-infection with C. difficile alone or with each commensal (6 groups, 48 mice total). For conventional studies, cecal contents were collected from 12 mice per group prior to clindamycin treatment, 24h post-clindamycin treatment prior to C. difficile challenge, and at 30h post C. difficile challenge, at the height of symptomatic infection. Materials were snap frozen into pre-weighed tubes and weighed to determine mass of cecal contents. Global metabolomic screen of samples was performed by Metabolon (Raleigh, NC) with sample extraction and MALDI-TOF analyses as described (Fletcher et al., 2018; Ryals et al., 2007). Results were obtained as Original Scale mass spectrometry counts.
Cecal short chain fatty acid measurements
Volatile short chain fatty acids from specifically-associated mice (n=6 mice/group across two experimental replicates) were quantified as described (Moore, 1993). In brief, acidified internal standards with 100 μL of ethyl ether anhydrous or boron trifluoride-methanol was added to 100μl of supernatant from homogenized cecal contents. Chromatographic analyses were carried out on an Agilent 7890B system with flame ionization detector (FID). Chromatogram and data integration were carried out using the OpenLab ChemStation software (Agilent Technologies, Santa Clara, CA). SCFA in samples were identified by comparing their specific retention times relative to the retention time in the standard mix. Concentrations were determined and expressed as mM of each SCFA per gram of sample for the raw cecal/fecal material. The Agilent platform cannot discriminate the isomers isovalerate and 2-methylbutyrate and thus reports these compounds out as a single peak and interpolated value.
Carbon source enrichment analyses
A variation of pathway enrichment analysis (Marco-Ramell et al., 2018) was used to evaluate carbon source availability and consumption in vivo. Curated carbon source groups, optimized to reflect carbon source metabolism of gut commensal species, were developed with review of primarily literature regarding anaerobic metabolism of carbohydrate, amino acid and other amine-containing compounds, lipids, aromatic compounds, purines and pyrimidines, vitamins, micronutrients and other input sources for microbial metabolism and growth. Additional sources of reviewed information included published maps of C. difficile’s biochemical pathways (Janoir et al., 2013; Pettit et al., 2014) and BioCyc and MetaCyc content for C. difficile strain CD630 (Marco-Ramell et al., 2018). A carbon source group required a minimum of 6 biochemicals for evaluation. For studies in GF mice, 506 biochemicals, of 787 identified by the Metabolon panel, 64.3% of the dataset, were curated into carbon source groups. For studies in conventional mice, 667 biochemicals of 858, 77.8% of the dataset, were curated into carbon source groups. The carbon source mappings and results in specifically-associated and conventional mice are available in supplemental files Data S6: Carbon Source Enrichement Analyses in Specifically-associated Mice, Related to Figure 2 and STAR Methods section: Carbon source enrichment analyses, and Data S9: Carbon Source Enrichment Analyses in Conventional Mice, Related to Figure 7 and STAR Methods section: Carbon source enrichment analyses.
Mass spectrometry datasets were filtered to remove biochemicals with values <50,000 counts across all samples (<3% of biochemicals). Remaining zero-value data points were assigned a value of 25,000 to support calculation of Log2 fold-change between comparisons. Datasets were Log2 transformed for significance testing of each biochemical by Welch’s T test and Benjamini-Hochberg multi-hypothesis correction (Benjamini, 1995; van den Berg et al., 2006). Thresholds for enrichment used a Log2 fold-change of ≥0.32192809 (1.25X), and a Log2 fold-change ≤ −0.32192809 (−1.25X) for depletion, and per-biochemical adjusted p value ≤0.05. Biochemicals in pairwise comparisons were ranked by adjusted p value and up to the top 40% of significantly changing biochemicals were used in analyses.
The number of enriched and depleted biochemicals per carbon source group, and total number of enriched and depleted biochemicals in datasets were calculated. Carbon source groups with ≥4 enriched or ≥4 depleted biochemicals underwent hypothesis testing by hypergeometric test, followed by Benjamini-Hochberg multi-hypothesis correction (Benjamini, 1995). An adjusted p value ≤0.05 for enriched or depleted carbon source groups was considered significant. Significantly enriched or depleted groups were plotted using the Python library Matplotlib (Hunter, 2007). Results for biochemicals within enriched groups were plotted in OriginLab (OriginLab, Wellesley Hills, MA) using the 3D XYY function, or with the Metaboanalyst 4.0 visualization tools (Chong et al., 2018).
Cluster analyses of Stickland metabolites
Stickland aromatic amino acid and histidine metabolites with known specificity for C. difficile or P. bifermentans (Mead, 1971; Neumann-Schaal et al., 2019) were clustered by mouse sample using the Metaboanalyst 4.0 clustering tools and Pearson’s correlation matrices (Chong et al., 2018). Similarities among samples were evaluated by amova (Schloss, 2019).
ATCC43255 and C. sardiniense genome annotation
Given discrepancies for multiple genes and bacteriophage loci in the RefSeq genome for C. difficile ATCC43255, a closed, reference genome was generated using Oxford Nanopore GridIon sequencing (Oxford Nanopore Technologies, Oxford, UK) according to the manufacturer’s instructions. The prepared library was sequenced on a MIN106D flow cell (R9.4.1) for 72 hours using the fast calling model. Reads were base called in real-time and demultiplexed using MinKNOW v3.6.5. The genome was de novo assembled using reads >5 kb in size with Flye v2.4.1 (Kolmogorov et al., 2019) to produce one circular contig with 400X coverage and size of 4,313,281 bp. A second hybrid assembly using the nanopore long reads with short reads generated by Miseq sequencing (NCBI SRA ID: SRS5656519) was generated using Unicycler v.0.4.8 (Wick et al., 2017). Mauve (Darling et al., 2011) was used to align and determine the synteny of both assemblies.
To correct potential stop codon and frameshift sequencing errors in coding regions, the hybrid assembly was compared to 26 pre-existing de novo SPAdes assemblies for ATCC43255 generated using Illumina MiSeq data from Worley, et al. (Worley et al., 2020). The corrected genomic data is available in NCBI under Accession#: NZ_CP049958.1.
The updated reference genome was annotated using the NCBI Prokaryotic Genome Automatic Annotation Pipeline (Sayers et al., 2020), PATRIC (Wattam et al., 2017), and PROKKA (Seemann, 2014) to extract gene features for support of transcriptome pathway enrichment analyses. Bacteriophage loci and genes were identified using PHASTER (Arndt et al., 2019).
A genome for C. sardiniense (NCBI SRA ID: SRR15509127) was generated using the methods a in Nudel, et al. by Illimina MiSeq and annotated as described (Nudel et al., 2018). To assess presence of a putative ornithine cyclodeaminase gene, the C. sardiniense genome was subjected to nucleotide and protein BLAST using the ornithine cyclodeaminase nucleotide coding regions and amino acid sequences from C. difficile ATCC43255 (geneID: UAB_RS0202485), P. bifermentans (geneID: fig|1490.7.peg.2150), the cluster I Clostridium, Clostridium botulinum (NCBI GeneID: WP_072587252), and Enterococcus faecalis (NCBI GeneID; WP_002358614.1). No orthologous genes in C. sardiniense were identified.
In vivo bacterial RNA sequencing
RNA was extracted from 15–20mg of flash frozen cecal contents (n=6 mice per group) using the Zymo Direct-zol RNA purification kit (R2081; Zymo, Irvine, CA). The quality of extracted RNA was assessed using an Agilent 2100 Bioanalyzer (Agilent Technologies, Lexington, MA) and samples with RNA Integrity Number (RIN) >= 8.0 were processed through Ribo-Zero Gold rRNA removal kit (MRZH116; Illumina, San Diego, CA) or NEBNext bacterial and rRNA Depletion Kit to deplete prokaryotic and eukaryotic rRNAs, and eukaryotic poly-A mRNAs (New England Biolabs, Ipswich, MA). The transcriptome sequencing libraries were constructed using the Illumina TruSeq mRNA Library Prep kit (20020594, 20020493; Illumina, San Diego, CA) or NEBNext Ultra II Directional RNA library prep kit (New England Biochemical, Ipswich, MA), per the manufacturer’s specifications. Library sizes were checked using a Bioanalyzer DNA High Sensitivity chip and TapeStation and quantified using Qubit dsDNA HS Assay Kit (Q32854; Thermo-Fisher, Waltham, MA). For sequencing runs, 12 libraries were pooled and sequenced on an Illumina Nextseq500 (Illumina, San Diego, CA) in paired-end 150 (PE150) nucleotide runs.
Metatranscriptome Data Processing
To map reads to gene features, the P. bifermentans ATCC638 (DSM14991) reference genome, NZ_AVNC01000001.1, was obtained from PATRIC (Davis et al., 2020) and Mus musculus C57BL6/J genome, GCF_000001635.26, from NCBI. The genomes for C. difficile ATCC43255 and C. sardiniense DSM599 were generated as described. The annotated gene content used in analyses for all three species is in suppelmental file Data S7: Metatranscriptome Gene Content, Related to STAR Methods sections Metatranscriptome Data Processing, and Metatranscriptome Enrichment Analyses.
Paired-end reads were quality filtered and trimmed then mapped to mouse and microbial genomes using Bowtie2 (Langmead B, 2012) using strict requirements for read orientation. The “--no-mixed” and “--no-discordant” flags were used to ensure that paired reads aligned to the same section of the genome in the expected orientation, respectively. Read pairs with a mapping quality <10, a measure of alignment uniqueness, were filtered. Reads aligning to >1 genome was flagged for subsequent analysis to identify potential sites of homology among genomes.
Mapped reads were assigned to gene features using HTSeq (Anders S, 2015) with flags “--nonunique all” to allow reads mapping to multiple features to be called to account for polycistronic RNAs, and “-a 10” to set the minimum mapping quality score at 10, a measure of alignment uniqueness. The identity of unaligned reads was analyzed with Kraken2 (Neves et al., 2017) to confirm association of mice with the expected species.
HTSeq results from each experimental replicate were binned by species and formatted for DESeq2 analyses (Guo et al., 2013). Gene features where no set of experimental replicates averaged more than 10 reads per replicate were filtered from further analysis (<3% of genes). A widely used DESeq2 analysis template was modified for differential expression analysis (https://gist.github.com/stephenturner/f60c1934405c127f09a6). Read data from all experimental replicates of a given organism were included for pairwise DESeq2 analyses to ensure the same adjusted read counts and estimates of dispersion across pairwise comparisons.
Metatranscriptome Enrichment Analyses
For C. difficile, mappings leveraged multiple previously published gene-level and pathway annotations for CD630 (Dembek et al., 2015; Hofmann et al., 2018; Janoir et al., 2013), assignments of gene function in the C. difficile EGRIN model (Arrieta-Ortiz ML, et al. In revision), and the bacterial-based Riley schema (Riley, 1993) to define microbial pathways and super-pathways, with addition of pathways such as “Mucin Degradation” to describe commensal-host categories, or ones that were missing or incompletely annotated in public resources. An operon map of C. difficile genes was created from the BioCyc content for CD630 (Marco-Ramell et al., 2018). Genes present in ATCC43255, but not CD630, were treated as single-cistron operons. PATRIC and PROKKA (Seemann, 2014) annotation of the C. sardiniense and P. bifermentans genomes were used to develop pathway maps for these species. Gene features in the commensals were also subjected to BLAST against the CD630 reference genome to provide additional annotation information. The annotated microbial gene features are shown in supplemental file Data S7: Metatranscriptome Gene Content, Related to STAR Methods sections: Metatranscriptome Data Processing, and Metatranscriptome Enrichment Analyses.
A minimum of 8 genes across at least 2 putative operon structures were required to define a pathway category. Thresholds for gene enrichment or depletion were set at +/−1.5X fold-change (Log2 fold-change of +/− 0.584962501) and with a DESeq2 per-gene adjusted p value ≤0.05. Up to the top 40% of significantly changing genes, ranked by the per-gene adjusted p value, were analyzed in each pairwise comparison. Pathways with a minimum of 5 enriched or of 5 depleted genes underwent hypothesis testing by hypergeometric test. Multi-hypothesis adjusted p values were calculated using the Benjamini-Hochberg method (Benjamini, 1995). Pathways with an adjusted p value ≤0.05 were considered significant. Enriched pathways were plotted using Python library Matplotlib (Hunter, 2007). The results of enrichment analyses are shown in supplemental data file Data S8: Metatranscriptome Enrichment Analyses, Related to Figures 3, 4 and STAR Methods section: Metatranscriptome Enrichment Analyses. Heatmaps of all genes in enriched or depleted pathway categories were visualized using the Metaboanalyst 4.0 tools (Chong et al., 2018), with hierarchical gene-level clustering by Pearson similarity and minimum-distance linkage.
Genomic DNA extraction and qPCR
Genomic DNA was extracted from cecal contents using the Zymo Quick-DNA Fecal/Soil Microbe Miniprep Kit (kit# 11–322; Zymo, Irvine, CA) and qPCR was performed using Taqman primers and probes specific for P. bifermentans, C. sardiniense and C. difficile with the conditions as described (Abdel-Gadir et al., 2019; Bucci et al., 2016) on a QuantStudio 12K Flex Real time PCR system (Applied Biosystems, Beverly, MA). Samples were run in triplicate and compared against standard curves of known biomass of each organism spiked into germfree cecal contents and then extracted to provide normalized CFU counts per gram of cecal contents.
Clostridium scindens Stickland reductase gene analysis.
The genomes of C. scindens ATCC35704 (GenBankID: NZ_CP036170), VE202–05 (GenBankID: GCA_000471845.1), MSK 1.16 (RefSeqID: GCF_013304115.1), and MGYG-HGUT-013–3 (RefSeqID: GCF_902373645.1) were interrogated by protein and nucleotide BLAST with each of the full length coding regions from the C. difficile ATCC43255 and P. bifermentans DSM14991 proline reductase (prd genes) (Bouillaut et al., 2013; Jackson et al., 2006), glycine reductase (grd genes) (Andreesen, 1994; Berges et al., 2018), and reductive leucine pathway genes (had operon genes) (Kim et al., 2006). Putative orthologs with >80% identity and >80% query coverage were evaluated further. C. scindens orthologs, if present, were aligned with the corresponding regions in C. difficile and P. bifermentans using the PATRIC multi-sequence alignment tool (Wattam et al., 2017). Aligned regions are shown in Supplemental Figure 4: Stickland reductase genetic loci in C. difficile, P. bifermentans and C. scindens, Related to STAR Methods section: Clostridium scindens Stickland reductase gene analysis.
QUANTIFICATION AND STATISTICAL ANALYSIS
Numbers of mice or experimental replicates studied are noted in the figures, associated figure legends, and/or STAR methods sections. Complete details of statistical analysis can be found in the associated figure legends and/or STAR methods sections.
Supplementary Material
Supplemental Figure 1: P. bifermentans protects germfree mice from lethal C. difficile infection while C. sardiniense promotes worse disease, Reated to Figure 1.
Supplemental Figure 2: Infection with ΔcodY, ΔccpA, and ΔcodY ΔccpA mutant strains, Related to Figure 6.
Supplemental Figure 3: P. bifermentans administered as an oral bacteriotherapeutic protects C. difficile infected conventional mice, Related to Figure 7.
Supplemental Figure 4: Stickland reductase genetic loci in C. difficile, P. bifermentans and C. scindens, Related to STAR Methods section: Clostridium scindens Stickland reductase gene analysis.
Supplemental Table 1: Strains and Culture Conditions, Related to STAR Methods section: Bacterial strains and culture conditions.
Supplemental Table 2: Plasmids and oligonucleotides used, Related to STAR Methods section: Construction of C. difficile mutant strains.
Data S1: Carbon Source Enrichment Analyses in Specifically-associated Mice, Related to Figure 2.
Data S2: Metatranscriptome Analyses: Heatmaps of C. difficile Enrichment Analyses, Related to Figure 3.
Data S3: Metatranscriptome Analyses: Heatmaps of C. sardiniense Enrichment Analyses, Related to Figure 4.
Data S4: Metatranscriptome Analyses: Heatmaps of P. bifermentans Enrichment Analyses, Related to Figure 4.
Data S5: Carbon Source Enrichment Analyses in Conventional Mice, Related to Figure 7.
Data S6: Carbon Source Enrichment Studies in Specifically-associated Mice, Related to Figure 2 and STAR Methods section: Carbon source enrichment analyses.
Data S7: Metatranscriptome Gene Content, Related to STAR Methods sections: Metatranscriptome Data Processing, and Metatranscriptome Enrichment Analyses.
Data S8: Metatranscriptome Enrichment Analyses, Related to Figures 3 and 4, and STAR Methods section: Metatranscriptome Enrichment Analyses.
Data S9: Cabon Source Enrichment Analyses in Conventional Mice, Related to Figure 7 and STAR Methods section: Carbon source enrichment analyses.
KEY RESOURCES TABLE.
| REAGENT or RESOURCE | SOURCE | IDENTIFIER |
|---|---|---|
| Antibodies | ||
| toxin B ELISA - monoclonal antibody | BBI solutions, Madison, WI, USA | BM347-T4G1 |
| toxin B ELISA - monoclonal antibody | BBI solutions, Madison, WI, USA | BM347-N4A8 |
| Bacterial and Virus Strains | ||
| Clostridioides difficile | ATCC, 10801 University Boulevard, Manassas, VA 20110, USA | ATCC 43255 |
| Clostridium sardiniense | DSMZ, Inhoffenstraße 7B 38124 Braunschweig, Germany |
DSM 599 |
| Paraclostridium bifermentans | DSMZ, Inhoffenstraße 7B 38124 Braunschweig, Germany |
DSM 14991 |
| Chemicals, Peptides, and Recombinant Proteins | ||
| Streptavidin-HRP | Thermo-Fisher, Waltham, MA, USA | N504 |
| Clindamycin phosphate | Millipore-Sigma, St. Louis, MO | PHR1021 |
| C. difficile cell culture toxin assay | Quidel, San Diego, CA 92121, USA | 03–05000 |
| Polyscreen PVDF membrane | Perkin Elmer, Waltham, MA, 02451, USA | NEF1002 |
| SuperSignal West Pico Plus Western Blotting Substrate | Thermo-Fisher, Waltham, MA, 02451, USA | 34577 |
| Ethyl ether | Millipore-Sigma, St. Louis, MO | EX0190–8 |
| Boron trifluoride-methanol | Millipore-Sigma, St. Louis, MO | 15716 |
| Minion sequencing cartridge | Oxford Nanopore | MIN106D |
| Zymo Direct-zol RNA purification kit | Zymo, Irvine, CA | R2081 |
| Ribo-Zero Gold rRNA removal kit | Illumina, San Diego, CA | MRZH116 |
| NEBNext bacterial RNA kit | New England Biolabs, Ipswich, MA | E7850X |
| rRNA Depletion Kit | New England Biolabs, Ipswich, MA | E6310X |
| TruSeq mRNA Library Prep kit | Illumina, San Diego, CA | 20020594, 20020493 |
| NEBNext Ultra II Directional RNA library prep kit | New England Biolabs, Ipswich, MA | E7760L |
| Qubit dsDNA HS Assay Kit | Thermo-Fisher, Waltham, MA | Q32854 |
| Zymo Quick-DNA Fecal/Soil Microbe Miniprep Kit | Zymo, Irvine, CA | 11–322 |
| PBS | Millipore-Sigma, St. Louis, MA | P3813–10PAK |
| Z-FIX | Thermo-Fisher, Waltham, MA | NC9351419 |
| CHROMID® C. difficile | Biomérieux, Durham, NA | CHROMID® C. difficile |
| Brucella agar with 5% sheep’s blood, hemin and vitK1 | Becton Dickinson, Canaan, CT | 8807311 |
| BHI broth | Anaerobe Systems, Morgan Hill, CA | AS-872 |
| Critical Commercial Assays | ||
| Global Metabolomics | Metabolon, Raleigh, NC | Global Metabolomics Screen |
| RNA sequencing | HMS Biopolymers Core, Boston, MA | NextSeq sequencing services |
| Deposited Data | ||
| RNAseq data and CSAR genomic data | NCBI Bioproject https://www.ncbi.nlm.nih.gov/bioproject/ | BioprojectID: PRJNA755661 |
| C. difficile ATCC43255 closed genome | NCBI https://www.ncbi.nlm.nih.gov/genome/?term=NZ_CP049958.1 | AccessionID: NZ_CP049958.1 |
| Experimental Models: Organisms/Strains | ||
| Swiss Webster Gnotobiotic Mice | Massachusetts Host-Microbiome Center | SWGF |
| Swiss Webster Conventional Mice | Taconic Farms, Taconic, NY | SW |
| Oligonucleotides | ||
| Supplemental Table 1 oligonucleotides | IDT DNA http://www.idtdna.com/ | Ordered direct from vendor |
| Recombinant DNA | ||
| pMSR0 | http://www.addgene.org/ | 78750 |
| Software and Algorithms | ||
| Bowtie2 | http://bowtie-bio.sourceforge.net/bowtie2/index.shtml | Bowtie 2.2.2 |
| HTseq | https://pypi.org/project/HTSeq/ | HTseq 0.11.1 |
| Kraken2 | https://ccb.jhu.edu/software/kraken2/ | Kraken2 |
| DESeq2 | https://bioconductor.org/packages/release/bioc/html/DESeq2.html | DESeq2 1.26 |
| Prism | GraphPad, San Diego, CA | Prism 8.0 |
| Metaboanalyst | https://www.metaboanalyst.ca/ | Metaboanalyst 4.0 |
| Python | http://www.python.org/ | Python 3.7.6 |
| Matplotlib python library | https://matplotlib.org/ | Matplotlib 3.4.2 |
| OriginLab | http://www.originlab.com/ | OriginLab 2021 |
| MinKNOW | Oxford Nanopore | MinKNOW v3.6.5 |
| Unicycler | https://github.com/rrwick/Unicycler | Unicycler v.0.4.8 |
| Flye assembler | https://github.com/fenderglass/Flye | Flye 2.4.1 |
| Mauve | http://darlinglab.org/mauve/mauve.html | Mauve 2.4.0 |
| NCBI Prokaryotic Genome Automatic Annotation Pipeline | https://www.ncbi.nlm.nih.gov/genome/annotation_prok/ | NCBI PGAP |
| PATRIC | https://www.patricbrc.org/ | Genome Annotation Service |
| PROKKA | https://github.com/tseemann/prokka | PROKKA 1.13.7 |
| PHASTER | https://phaster.ca | PHASTER bacteriophage annotation service |
Highlights:
Systems biologic models identify complex host-inter-microbe interactions in vivo
P. bifermentans alone protects the murine host against lethal C. difficile disease
C. sardiniense worsens disease through cross-feeding and growth enhancement
Findings inform successful bacteriotherapeutic development against C. difficile
Acknowledgments
We thank Andrea Dubois, Cameron Friedman, Vladimir Yeliseyev, Qing Liu, Rebecca Krinzman and Teri Bowman for technical support, and Peter Sewell for graphic design support. RNA sequencing was performed by the Harvard Medical School Biopolymers Core. Partners Healthcare’s ERIS team supported the Massachusetts Host-Microbiome Center’s high performance computing resources. We also thank Jessica Allegretti, Laurent Bouillaut, Laurie Comstock and Aimee Shen for critical reading of the manuscript and helpful comments.
Funding:
This work was supported by the BWH Precision Medicine Institute, R01AI153605 from the National Institute of Allergy and Infectious Diseases (NIAID) and P30DK034854 from the National Institute of Diabetes, Digestive and Kidney Diseases to LB, R01AI128215, R01AI141953, and U19AI135976 from NIAID and IIBR-2042948 from the National Science Foundation to NSB. BP was supported by T32 HL007627; the work of JW was supported by the Intramural Research Program of the National Library of Medicine, National Institutes of Health. JP received support from the Institut Pasteur (Bourse ROUX). This work was conducted by authors from the FDA working as official U.S. government employees and for which no additional external funding was utilized.
Footnotes
Declaration of interests
LB and GG are co-inventors on patents for C. difficile microbiota therapeutics. LB, GG and AS are SAB members and hold stock in ParetoBio. GG is an SAB member and holds stock in Kaleido, Inc. AS is a co-owner of ExArca Pharmaceuticals, LLC. Remaining authors declare no competing interests.
Publisher's Disclaimer: This is a PDF file of an unedited manuscript that has been accepted for publication. As a service to our customers we are providing this early version of the manuscript. The manuscript will undergo copyediting, typesetting, and review of the resulting proof before it is published in its final form. Please note that during the production process errors may be discovered which could affect the content, and all legal disclaimers that apply to the journal pertain.
REFERENCES
- Abdel-Gadir A, Stephen-Victor E, Gerber GK, Noval Rivas M, Wang S, Harb H, Wang L, Li N, Crestani E, Spielman S, et al. (2019). Microbiota therapy acts via a regulatory T cell MyD88/RORgammat pathway to suppress food allergy. Nat Med 25, 1164–1174. [DOI] [PMC free article] [PubMed] [Google Scholar]
- Allegretti JR, Marcus J, Storm M, Sitko J, Kennedy K, Gerber GK, and Bry L (2019). Clinical Predictors of Recurrence After Primary Clostridioides difficile Infection: A Prospective Cohort Study. Dig Dis Sci. [DOI] [PMC free article] [PubMed] [Google Scholar]
- Anders S PP, Huber W (2015). HTSeq—a Python framework to work with high-throughput sequencing data. Bioinformatics 31, 166–169. [DOI] [PMC free article] [PubMed] [Google Scholar]
- Andreesen JR (1994). Glycine metabolism in anaerobes. Antonie Van Leeuwenhoek 66, 223–237. [DOI] [PubMed] [Google Scholar]
- Arndt D, Marcu A, Liang Y, and Wishart DS (2019). PHAST, PHASTER and PHASTEST: Tools for finding prophage in bacterial genomes. Brief Bioinform 20, 1560–1567. [DOI] [PMC free article] [PubMed] [Google Scholar]
- Arrieta-Ortiz ML SR, Turkarslan S, Wu WJ, Girinathan BP, Worley JN, DiBenedetto N, Soutourina O, Peltier J, Dupuy B, Bry L, Baliga NS. (2021). Predictive regulatory and metabolic network models for systems analysis of Clostridioides difficile. Cell Host Microb. In Revision. [DOI] [PMC free article] [PubMed] [Google Scholar]
- Bakonyi D, and Hummel W (2017). Cloning, expression, and biochemical characterization of a novel NADP(+)-dependent 7alpha-hydroxysteroid dehydrogenase from Clostridium difficile and its application for the oxidation of bile acids. Enzyme Microb Technol 99, 16–24. [DOI] [PubMed] [Google Scholar]
- Baktash A, Terveer EM, Zwittink RD, Hornung BVH, Corver J, Kuijper EJ, and Smits WK (2018). Mechanistic Insights in the Success of Fecal Microbiota Transplants for the Treatment of Clostridium difficile Infections. Frontiers in microbiology 9, 1242. [DOI] [PMC free article] [PubMed] [Google Scholar]
- Battaglioli EJ, Hale VL, Chen J, Jeraldo P, Ruiz-Mojica C, Schmidt BA, Rekdal VM, Till LM, Huq L, Smits SA, et al. (2018). Clostridioides difficile uses amino acids associated with gut microbial dysbiosis in a subset of patients with diarrhea. Science translational medicine 10. [DOI] [PMC free article] [PubMed] [Google Scholar]
- Beck ET, Buchan BW, Riebe KM, Alkins BR, Pancholi P, Granato PA, and Ledeboer NA (2014). Multicenter evaluation of the Quidel Lyra Direct C. difficile nucleic acid amplification assay. Journal of clinical microbiology 52, 1998–2002. [DOI] [PMC free article] [PubMed] [Google Scholar]
- Belzer C, Liu Q, Carroll MC, and Bry L (2011). THE ROLE OF SPECIFIC IgG AND COMPLEMENT IN COMBATING A PRIMARY MUCOSAL INFECTION OF THE GUT EPITHELIUM. Eur J Microbiol Immunol (Bp) 1, 311–318. [DOI] [PMC free article] [PubMed] [Google Scholar]
- Benjamini YH, Yosef (1995). Controlling the false discovery rate: a practical and powerful approach to multiple testing. Journal of the Royal Statistical Society, Series B 57, 289–300. [Google Scholar]
- Berges M, Michel AM, Lassek C, Nuss AM, Beckstette M, Dersch P, Riedel K, Sievers S, Becher D, Otto A, et al. (2018). Iron Regulation in Clostridioides difficile. Frontiers in microbiology 9, 3183. [DOI] [PMC free article] [PubMed] [Google Scholar]
- Bielaszewska M, Idelevich EA, Zhang W, Bauwens A, Schaumburg F, Mellmann A, Peters G, and Karch H (2012). Effects of antibiotics on Shiga toxin 2 production and bacteriophage induction by epidemic Escherichia coli O104:H4 strain. Antimicrobial agents and chemotherapy 56, 3277–3282. [DOI] [PMC free article] [PubMed] [Google Scholar]
- Bosak T, Losick RM, and Pearson A (2008). A polycyclic terpenoid that alleviates oxidative stress. Proceedings of the National Academy of Sciences of the United States of America 105, 6725–6729. [DOI] [PMC free article] [PubMed] [Google Scholar]
- Bouillaut L, Dubois T, Sonenshein AL, and Dupuy B (2015). Integration of metabolism and virulence in Clostridium difficile. Res Microbiol 166, 375–383. [DOI] [PMC free article] [PubMed] [Google Scholar]
- Bouillaut L, Self WT, and Sonenshein AL (2013). Proline-dependent regulation of Clostridium difficile Stickland metabolism. Journal of bacteriology 195, 844–854. [DOI] [PMC free article] [PubMed] [Google Scholar]
- Bradshaw W, Barker HA. (1960). Purification and properties of xanthine dehydrogenase from Clostridium cylindrosporum. Journal of Biological Chemistry 235, 3620–3629. [Google Scholar]
- Bry L, and Brenner MB (2004). Critical role of T cell-dependent serum antibody, but not the gut-associated lymphoid tissue, for surviving acute mucosal infection with Citrobacter rodentium, an attaching and effacing pathogen. J Immunol 172, 433–441. [DOI] [PubMed] [Google Scholar]
- Bucci V, Tzen B, Li N, Simmons M, Tanoue T, Bogart E, Deng L, Yeliseyev V, Delaney ML, Liu Q, et al. (2016). MDSINE: Microbial Dynamical Systems INference Engine for microbiome time-series analyses. Genome biology 17, 121. [DOI] [PMC free article] [PubMed] [Google Scholar]
- Buffie CG, Bucci V, Stein RR, McKenney PT, Ling L, Gobourne A, No D, Liu H, Kinnebrew M, Viale A, et al. (2015). Precision microbiome reconstitution restores bile acid mediated resistance to Clostridium difficile. Nature 517, 205–208. [DOI] [PMC free article] [PubMed] [Google Scholar]
- Chen HP, Wu SH, Lin YL, Chen CM, and Tsay SS (2001). Cloning, sequencing, heterologous expression, purification, and characterization of adenosylcobalamin-dependent D-ornithine aminomutase from Clostridium sticklandii. J Biol Chem 276, 44744–44750. [DOI] [PubMed] [Google Scholar]
- Chong J, Soufan O, Li C, Caraus I, Li S, Bourque G, Wishart DS, and Xia J (2018). MetaboAnalyst 4.0: towards more transparent and integrative metabolomics analysis. Nucleic Acids Res 46, W486–W494. [DOI] [PMC free article] [PubMed] [Google Scholar]
- Costa CL, Lopez-Urena D, de Oliveira Assis T, Ribeiro RA, Silva RO, Rupnik M, Wilcox MH, de Carvalho AF, do Carmo AO, Dias AA, et al. (2016). A MLST Clade 2 Clostridium difficile strain with a variant TcdB induces severe inflammatory and oxidative response associated with mucosal disruption. Anaerobe 40, 76–84. [DOI] [PubMed] [Google Scholar]
- Darling AE, Tritt A, Eisen JA, and Facciotti MT (2011). Mauve assembly metrics. Bioinformatics 27, 2756–2757. [DOI] [PMC free article] [PubMed] [Google Scholar]
- Davis JJ, Wattam AR, Aziz RK, Brettin T, Butler R, Butler RM, Chlenski P, Conrad N, Dickerman A, Dietrich EM, et al. (2020). The PATRIC Bioinformatics Resource Center: expanding data and analysis capabilities. Nucleic Acids Res 48, D606–D612. [DOI] [PMC free article] [PubMed] [Google Scholar]
- Dembek M, Barquist L, Boinett CJ, Cain AK, Mayho M, Lawley TD, Fairweather NF, and Fagan RP (2015). High-throughput analysis of gene essentiality and sporulation in Clostridium difficile. MBio 6, e02383. [DOI] [PMC free article] [PubMed] [Google Scholar]
- Dubois T, Dancer-Thibonnier M, Monot M, Hamiot A, Bouillaut L, Soutourina O, Martin-Verstraete I, and Dupuy B (2016). Control of Clostridium difficile Physiopathology in Response to Cysteine Availability. Infection and immunity 84, 2389–2405. [DOI] [PMC free article] [PubMed] [Google Scholar]
- Duncan CL (1973). Time of enterotoxin formation and release during sporulation of Clostridium perfringens type A. Journal of bacteriology 113, 932–936. [DOI] [PMC free article] [PubMed] [Google Scholar]
- El Meouche I, and Peltier J (2018). Toxin release mediated by the novel autolysin Cwp19 in Clostridium difficile. Microbial cell (Graz, Austria) 5, 421–423. [DOI] [PMC free article] [PubMed] [Google Scholar]
- Fekete S, Szakall I, Andr ofszky E, Kosa E, and Hullar I (1996). Body composition of mice of different body condition score and sex. Acta Vet Hung 44, 399–410. [PubMed] [Google Scholar]
- Fletcher JR, Erwin S, Lanzas C, and Theriot CM (2018). Shifts in the Gut Metabolome and Clostridium difficile Transcriptome throughout Colonization and Infection in a Mouse Model. mSphere 3. [DOI] [PMC free article] [PubMed] [Google Scholar]
- Fonknechten N, Perret A, Perchat N, Tricot S, Lechaplais C, Vallenet D, Vergne C, Zaparucha A, Le Paslier D, Weissenbach J, et al. (2009). A conserved gene cluster rules anaerobic oxidative degradation of L-ornithine. Journal of bacteriology 191, 3162–3167. [DOI] [PMC free article] [PubMed] [Google Scholar]
- Francis MB, Allen CA, and Sorg JA (2013). Muricholic acids inhibit Clostridium difficile spore germination and growth. PloS one 8, e73653. [DOI] [PMC free article] [PubMed] [Google Scholar]
- Garneau JR, Sekulovic O, Dupuy B, Soutourina O, Monot M, and Fortier LC (2018). High Prevalence and Genetic Diversity of Large phiCD211 (phiCDIF1296T)-Like Prophages in Clostridioides difficile. Appl Environ Microbiol 84. [DOI] [PMC free article] [PubMed] [Google Scholar]
- Gebhart D, Lok S, Clare S, Tomas M, Stares M, Scholl D, Donskey CJ, Lawley TD, and Govoni GR (2015). A modified R-type bacteriocin specifically targeting Clostridium difficile prevents colonization of mice without affecting gut microbiota diversity. MBio 6. [DOI] [PMC free article] [PubMed] [Google Scholar]
- Girinathan BP DN, Worley J, Peltier J, Arrieta-Ortiz M, Immanuel R, Lavin R, Delaney ML, Cummins C, Onderdonk AB, Gerber GK, Sonenshein AL, Baliga N, IDupuy B, Bry L (2020). The mechanisms of in vivo commensal control of Clostridioides difficile virulence. BioRxiv. [DOI] [PMC free article] [PubMed] [Google Scholar]
- Girinathan BP, Ou J, Dupuy B, and Govind R (2018). Pleiotropic roles of Clostridium difficile sin locus. PLoS Pathog 14, e1006940. [DOI] [PMC free article] [PubMed] [Google Scholar]
- Griffith OW, Bridges RJ, and Meister A (1979). Transport of gamma-glutamyl amino acids: role of glutathione and gamma-glutamyl transpeptidase. Proceedings of the National Academy of Sciences of the United States of America 76, 6319–6322. [DOI] [PMC free article] [PubMed] [Google Scholar]
- Guo Y, Li CI, Ye F, and Shyr Y (2013). Evaluation of read count based RNAseq analysis methods. BMC genomics 14 Suppl 8, S2. [DOI] [PMC free article] [PubMed] [Google Scholar]
- Hofmann JD, Otto A, Berges M, Biedendieck R, Michel AM, Becher D, Jahn D, and Neumann-Schaal M (2018). Metabolic Reprogramming of Clostridioides difficile During the Stationary Phase With the Induction of Toxin Production. Frontiers in microbiology 9, 1970. [DOI] [PMC free article] [PubMed] [Google Scholar]
- Huang YY, Martinez-Del Campo A, and Balskus EP (2018). Anaerobic 4-hydroxyproline utilization: Discovery of a new glycyl radical enzyme in the human gut microbiome uncovers a widespread microbial metabolic activity. Gut microbes 9, 437–451. [DOI] [PMC free article] [PubMed] [Google Scholar]
- Hunter JD (2007). Matplotlib: A 2D Graphics Environment. Computing in Science & Engineering 9, 90–95. [Google Scholar]
- Jackson S, Calos M, Myers A, and Self WT (2006). Analysis of proline reduction in the nosocomial pathogen Clostridium difficile. Journal of bacteriology 188, 8487–8495. [DOI] [PMC free article] [PubMed] [Google Scholar]
- Janoir C, Deneve C, Bouttier S, Barbut F, Hoys S, Caleechum L, Chapeton-Montes D, Pereira FC, Henriques AO, Collignon A, et al. (2013). Adaptive strategies and pathogenesis of Clostridium difficile from in vivo transcriptomics. Infection and immunity 81, 3757–3769. [DOI] [PMC free article] [PubMed] [Google Scholar]
- Katarzyna Leja KM, Mariola Olkowicz, Wojciech Juzwa, Katarzyna Czaczyk (2014). Clostridium bifermentans as an Aero-Tolerant Exponent of Strictly Anaerobe Genera. Advances in Microbiology 4, 216–224. [Google Scholar]
- Kim J, Darley D, Selmer T, and Buckel W (2006). Characterization of (R)-2-hydroxyisocaproate dehydrogenase and a family III coenzyme A transferase involved in reduction of L-leucine to isocaproate by Clostridium difficile. Appl Environ Microbiol 72, 6062–6069. [DOI] [PMC free article] [PubMed] [Google Scholar]
- Kint N, Janoir C, Monot M, Hoys S, Soutourina O, Dupuy B, and Martin-Verstraete I (2017). The alternative sigma factor sigma(B) plays a crucial role in adaptive strategies of Clostridium difficile during gut infection. Environmental microbiology 19, 1933–1958. [DOI] [PubMed] [Google Scholar]
- Kirk JA, and Fagan RP (2016). Heat shock increases conjugation efficiency in Clostridium difficile. Anaerobe 42, 1–5. [DOI] [PMC free article] [PubMed] [Google Scholar]
- Knippel RJ, Wexler AG, Miller JM, Beavers WN, Weiss A, de Crecy-Lagard V, Edmonds KA, Giedroc DP, and Skaar EP (2020). Clostridioides difficile Senses and Hijacks Host Heme for Incorporation into an Oxidative Stress Defense System. Cell Host Microbe 28, 411–421 e416. [DOI] [PMC free article] [PubMed] [Google Scholar]
- Kolmogorov M, Yuan J, Lin Y, and Pevzner PA (2019). Assembly of long, error-prone reads using repeat graphs. Nat Biotechnol 37, 540–546. [DOI] [PubMed] [Google Scholar]
- Langmead B SS (2012). Fast gapped-read alignment with Bowtie 2. Nat Methods 9, 357–359. [DOI] [PMC free article] [PubMed] [Google Scholar]
- Lavin R, DiBenedetto N, Yeliseyev V, Delaney M, and Bry L (2018). Gnotobiotic and Conventional Mouse Systems to Support Microbiota Based Studies. Curr Protoc Immunol 121. [DOI] [PMC free article] [PubMed] [Google Scholar]
- Lee Y, Jo J, Chung HY, Pothoulakis C, and Im E (2016). Endocannabinoids in the gastrointestinal tract. Am J Physiol Gastrointest Liver Physiol 311, G655–G666. [DOI] [PubMed] [Google Scholar]
- Leslie JL, Vendrov KC, Jenior ML, and Young VB (2019). The Gut Microbiota Is Associated with Clearance of Clostridium difficile Infection Independent of Adaptive Immunity. mSphere 4. [DOI] [PMC free article] [PubMed] [Google Scholar]
- Mani N, and Dupuy B (2001). Regulation of toxin synthesis in Clostridium difficile by an alternative RNA polymerase sigma factor. Proceedings of the National Academy of Sciences of the United States of America 98, 5844–5849. [DOI] [PMC free article] [PubMed] [Google Scholar]
- Marcella C, Cui B, Kelly CR, Ianiro G, Cammarota G, and Zhang F (2021). Systematic review: the global incidence of faecal microbiota transplantation-related adverse events from 2000 to 2020. Aliment Pharmacol Ther 53, 33–42. [DOI] [PubMed] [Google Scholar]
- Marco-Ramell A, Palau-Rodriguez M, Alay A, Tulipani S, Urpi-Sarda M, Sanchez-Pla A, and Andres-Lacueva C (2018). Evaluation and comparison of bioinformatic tools for the enrichment analysis of metabolomics data. BMC Bioinformatics 19, 1. [DOI] [PMC free article] [PubMed] [Google Scholar]
- Martin-Verstraete I, Peltier J, and Dupuy B (2016). The Regulatory Networks That Control Clostridium difficile Toxin Synthesis. Toxins (Basel) 8. [DOI] [PMC free article] [PubMed] [Google Scholar]
- Mead GC (1971). The amino acid-fermenting clostridia. J Gen Microbiol 67, 47–56. [DOI] [PubMed] [Google Scholar]
- Mills JP, Rao K, and Young VB (2018). Probiotics for prevention of Clostridium difficile infection. Current opinion in gastroenterology 34, 3–10. [DOI] [PMC free article] [PubMed] [Google Scholar]
- Moore L, Moore WEC (1993). Anaerobe Lab Manual, 4th edn (Blacksburg, VA: VPI; ). [Google Scholar]
- Nawrocki KL, Wetzel D, Jones JB, Woods EC, and McBride SM (2018). Ethanolamine is a valuable nutrient source that impacts Clostridium difficile pathogenesis. Environmental microbiology. [DOI] [PMC free article] [PubMed] [Google Scholar]
- Neumann-Schaal M, Hofmann JD, Will SE, and Schomburg D (2015). Time-resolved amino acid uptake of Clostridium difficile 630Deltaerm and concomitant fermentation product and toxin formation. BMC microbiology 15, 281. [DOI] [PMC free article] [PubMed] [Google Scholar]
- Neumann-Schaal M, Jahn D, and Schmidt-Hohagen K (2019). Metabolism the Difficile Way: The Key to the Success of the Pathogen Clostridioides difficile. Frontiers in microbiology 10, 219. [DOI] [PMC free article] [PubMed] [Google Scholar]
- Neumann-Schaal M, Metzendorf NG, Troitzsch D, Nuss AM, Hofmann JD, Beckstette M, Dersch P, Otto A, and Sievers S (2018). Tracking gene expression and oxidative damage of O2-stressed Clostridioides difficile by a multi-omics approach. Anaerobe 53, 94–107. [DOI] [PubMed] [Google Scholar]
- Neves ALA, Li F, Ghoshal B, McAllister T, and Guan LL (2017). Enhancing the Resolution of Rumen Microbial Classification from Metatranscriptomic Data Using Kraken and Mothur. Frontiers in microbiology 8, 2445. [DOI] [PMC free article] [PubMed] [Google Scholar]
- Nudel K, Zhao X, Basu S, Dong X, Hoffmann M, Feldgarden M, Allard M, Klompas M, and Bry L (2018). Genomics of Corynebacterium striatum, an emerging multidrug-resistant pathogen of immunocompromised patients. Clinical microbiology and infection : the official publication of the European Society of Clinical Microbiology and Infectious Diseases 24, 1016 e1017–1016 e1013. [DOI] [PMC free article] [PubMed] [Google Scholar]
- Passmore IJ, Letertre MPM, Preston MD, Bianconi I, Harrison MA, Nasher F, Kaur H, Hong HA, Baines SD, Cutting SM, et al. (2018). Para-cresol production by Clostridium difficile affects microbial diversity and membrane integrity of Gram-negative bacteria. PLoS Pathog 14, e1007191. [DOI] [PMC free article] [PubMed] [Google Scholar]
- Peltier J, Courtin P, El Meouche I, Lemee L, Chapot-Chartier MP, and Pons JL (2011). Clostridium difficile has an original peptidoglycan structure with a high level of N-acetylglucosamine deacetylation and mainly 3–3 cross-links. J Biol Chem 286, 29053–29062. [DOI] [PMC free article] [PubMed] [Google Scholar]
- Peng Z, Jin D, Kim HB, Stratton CW, Wu B, Tang YW, and Sun X (2017). Update on Antimicrobial Resistance in Clostridium difficile: Resistance Mechanisms and Antimicrobial Susceptibility Testing. Journal of clinical microbiology 55, 1998–2008. [DOI] [PMC free article] [PubMed] [Google Scholar]
- Pettit LJ, Browne HP, Yu L, Smits WK, Fagan RP, Barquist L, Martin MJ, Goulding D, Duncan SH, Flint HJ, et al. (2014). Functional genomics reveals that Clostridium difficile Spo0A coordinates sporulation, virulence and metabolism. BMC genomics 15, 160. [DOI] [PMC free article] [PubMed] [Google Scholar]
- Pols T, Singh S, Deelman-Driessen C, Gaastra BF, and Poolman B (2020). Enzymology of the pathway for ATP production by arginine breakdown. The FEBS journal. [DOI] [PMC free article] [PubMed] [Google Scholar]
- Pruss KM, and Sonnenburg JL (2021). C. difficile exploits a host metabolite produced during toxin-mediated disease. Nature 593, 261–265. [DOI] [PMC free article] [PubMed] [Google Scholar]
- Reeves AE, Koenigsknecht MJ, Bergin IL, and Young VB (2012). Suppression of Clostridium difficile in the gastrointestinal tracts of germfree mice inoculated with a murine isolate from the family Lachnospiraceae. Infection and immunity 80, 3786–3794. [DOI] [PMC free article] [PubMed] [Google Scholar]
- Riley M (1993). Functions of the gene products of Escherichia coli. Microbiological reviews 57, 862–952. [DOI] [PMC free article] [PubMed] [Google Scholar]
- Ryals J, Lawton K, Stevens D, and Milburn M (2007). Metabolon, Inc. Pharmacogenomics 8, 863–866. [DOI] [PubMed] [Google Scholar]
- Saujet L, Pereira FC, Serrano M, Soutourina O, Monot M, Shelyakin PV, Gelfand MS, Dupuy B, Henriques AO, and Martin-Verstraete I (2013). Genome-wide analysis of cell type-specific gene transcription during spore formation in Clostridium difficile. PLoS Genet 9, e1003756. [DOI] [PMC free article] [PubMed] [Google Scholar]
- Sayers EW, Beck J, Brister JR, Bolton EE, Canese K, Comeau DC, Funk K, Ketter A, Kim S, Kimchi A, et al. (2020). Database resources of the National Center for Biotechnology Information. Nucleic Acids Res 48, D9–D16. [DOI] [PMC free article] [PubMed] [Google Scholar]
- Schloss PD (2019). Reintroducing mothur: 10 years later. Appl Environ Microbiol. [DOI] [PMC free article] [PubMed] [Google Scholar]
- Seemann T (2014). Prokka: rapid prokaryotic genome annotation. Bioinformatics 30, 2068–2069. [DOI] [PubMed] [Google Scholar]
- Shrestha R, Lockless SW, and Sorg JA (2017). A Clostridium difficile alanine racemase affects spore germination and accommodates serine as a substrate. J Biol Chem 292, 10735–10742. [DOI] [PMC free article] [PubMed] [Google Scholar]
- Sorg JA, and Sonenshein AL (2009). Chenodeoxycholate is an inhibitor of Clostridium difficile spore germination. Journal of bacteriology 191, 1115–1117. [DOI] [PMC free article] [PubMed] [Google Scholar]
- Steglich M, Hofmann JD, Helmecke J, Sikorski J, Sproer C, Riedel T, Bunk B, Overmann J, Neumann-Schaal M, and Nubel U (2018). Convergent Loss of ABC Transporter Genes From Clostridioides difficile Genomes Is Associated With Impaired Tyrosine Uptake and p-Cresol Production. Frontiers in microbiology 9, 901. [DOI] [PMC free article] [PubMed] [Google Scholar]
- Takach E, O’Shea T, and Liu H (2014). High-throughput quantitation of amino acids in rat and mouse biological matrices using stable isotope labeling and UPLC-MS/MS analysis. J Chromatogr B Analyt Technol Biomed Life Sci 964, 180–190. [DOI] [PubMed] [Google Scholar]
- Thanissery R, Winston JA, and Theriot CM (2017). Inhibition of spore germination, growth, and toxin activity of clinically relevant C. difficile strains by gut microbiota derived secondary bile acids. Anaerobe 45, 86–100. [DOI] [PMC free article] [PubMed] [Google Scholar]
- Theriot CM, Koenigsknecht MJ, Carlson PE Jr., Hatton GE, Nelson AM, Li B, Huffnagle GB, J ,ZL, and Young VB (2014). Antibiotic-induced shifts in the mouse gut microbiome and metabolome increase susceptibility to Clostridium difficile infection. Nat Commun 5, 3114. [DOI] [PMC free article] [PubMed] [Google Scholar]
- Valdes-Varela L, Alonso-Guervos M, Garcia-Suarez O, Gueimonde M, and Ruas-Madiedo P (2016). Screening of Bifidobacteria and Lactobacilli Able to Antagonize the Cytotoxic Effect of Clostridium difficile upon Intestinal Epithelial HT29 Monolayer. Frontiers in microbiology 7, 577. [DOI] [PMC free article] [PubMed] [Google Scholar]
- van den Berg RA, Hoefsloot HC, Westerhuis JA, Smilde AK, and van der Werf MJ (2006). Centering, scaling, and transformations: improving the biological information content of metabolomics data. BMC genomics 7, 142. [DOI] [PMC free article] [PubMed] [Google Scholar]
- Vogels GD, and Van der Drift C (1976). Degradation of purines and pyrimidines by microorganisms. Bacteriol Rev 40, 403–468. [DOI] [PMC free article] [PubMed] [Google Scholar]
- Wattam AR, Davis JJ, Assaf R, Boisvert S, Brettin T, Bun C, Conrad N, Dietrich EM, Disz T, Gabbard JL, et al. (2017). Improvements to PATRIC, the all-bacterial Bioinformatics Database and Analysis Resource Center. Nucleic Acids Res 45, D535–D542. [DOI] [PMC free article] [PubMed] [Google Scholar]
- Wesley A, Mantle M, Man D, Qureshi R, Forstner G, and Forstner J (1985). Neutral and acidic species of human intestinal mucin. Evidence for different core peptides. J Biol Chem 260, 7955–7959. [PubMed] [Google Scholar]
- Wick RR, Judd LM, Gorrie CL, and Holt KE (2017). Unicycler: Resolving bacterial genome assemblies from short and long sequencing reads. PLoS computational biology 13, e1005595. [DOI] [PMC free article] [PubMed] [Google Scholar]
- Wilson KH, Sheagren JN, Freter R, Weatherbee L, and Lyerly D (1986). Gnotobiotic models for study of the microbial ecology of Clostridium difficile and Escherichia coli. The Journal of infectious diseases 153, 547–551. [DOI] [PubMed] [Google Scholar]
- Worley J, Delaney ML, Cummins CK, DuBois A, Klompas M, and Bry L (2020). Genomic determination of relative risks for Clostridioides difficile infection from asymptomatic carriage in ICU patients. Clinical infectious diseases : an official publication of the Infectious Diseases Society of America. [DOI] [PMC free article] [PubMed] [Google Scholar]
- Zarandi ER, Mansouri S, Nakhaee N, Sarafzadeh F, and Moradi M (2017). Toxin production of Clostridium difficile in sub-MIC of vancomycin and clindamycin alone and in combination with ceftazidime. Microbial pathogenesis 107, 249–253. [DOI] [PubMed] [Google Scholar]
- Zheng W, Wang K, Sun Y, and Kuo SM (2018). Dietary or supplemental fermentable fiber intake reduces the presence of Clostridium XI in mouse intestinal microbiota: The importance of higher fecal bacterial load and density. PloS one 13, e0205055. [DOI] [PMC free article] [PubMed] [Google Scholar]
Associated Data
This section collects any data citations, data availability statements, or supplementary materials included in this article.
Supplementary Materials
Supplemental Figure 1: P. bifermentans protects germfree mice from lethal C. difficile infection while C. sardiniense promotes worse disease, Reated to Figure 1.
Supplemental Figure 2: Infection with ΔcodY, ΔccpA, and ΔcodY ΔccpA mutant strains, Related to Figure 6.
Supplemental Figure 3: P. bifermentans administered as an oral bacteriotherapeutic protects C. difficile infected conventional mice, Related to Figure 7.
Supplemental Figure 4: Stickland reductase genetic loci in C. difficile, P. bifermentans and C. scindens, Related to STAR Methods section: Clostridium scindens Stickland reductase gene analysis.
Supplemental Table 1: Strains and Culture Conditions, Related to STAR Methods section: Bacterial strains and culture conditions.
Supplemental Table 2: Plasmids and oligonucleotides used, Related to STAR Methods section: Construction of C. difficile mutant strains.
Data S1: Carbon Source Enrichment Analyses in Specifically-associated Mice, Related to Figure 2.
Data S2: Metatranscriptome Analyses: Heatmaps of C. difficile Enrichment Analyses, Related to Figure 3.
Data S3: Metatranscriptome Analyses: Heatmaps of C. sardiniense Enrichment Analyses, Related to Figure 4.
Data S4: Metatranscriptome Analyses: Heatmaps of P. bifermentans Enrichment Analyses, Related to Figure 4.
Data S5: Carbon Source Enrichment Analyses in Conventional Mice, Related to Figure 7.
Data S6: Carbon Source Enrichment Studies in Specifically-associated Mice, Related to Figure 2 and STAR Methods section: Carbon source enrichment analyses.
Data S7: Metatranscriptome Gene Content, Related to STAR Methods sections: Metatranscriptome Data Processing, and Metatranscriptome Enrichment Analyses.
Data S8: Metatranscriptome Enrichment Analyses, Related to Figures 3 and 4, and STAR Methods section: Metatranscriptome Enrichment Analyses.
Data S9: Cabon Source Enrichment Analyses in Conventional Mice, Related to Figure 7 and STAR Methods section: Carbon source enrichment analyses.
Data Availability Statement
The updated C. difficile ATCC43255 reference genome has been deposited to NCBI under accession# NZ_CP049958.1.
The C. sardiniense genome has been deposited to NCBI under accession# JAIKTU000000000.
Metatranscriptomic datasets are available through NCBI under GEO ID: GSE182613.
Carbon source maps, metabolomic datasets, and statistical results from metabolomic enrichment analyses are available in the supplemental Excel files GF_CarbonSourceEnrichment.xlsx and CONV_CarbonSourceEnrichment.xlsx.
Microbial gene-level content and statistical results from metatranscriptomic analyses are available in the supplemental Excel files TranscriptomeGeneContent.xlsx and RNAseq_TranscriptomeEnrichment.xlsx.
The open source python libraries and code for RNAseq analyses are available from the respective referenced sites in the STAR methods.