Abstract
Exosomes are nano-sized extracellular vesicles that can be released from cancer cells. It has been shown that cancer cell-derived exosomes may be associated with carcinogenesis by transferring signaling proteins from malignant to neighboring non-malignant cells. In addition, annexin A1 (ANXA1) is a well-known oncogene, that can be released from extracellular vesicles by cancer cells. However, the role of exosomal ANXA1 in the cell-to-cell communication of thyroid cancer and thyroid follicular epithelial cells remains unclear. In the present study, the protein expression levels of ANXA1 in thyroid cancer cells and thyroid cancer cell-derived exosomes were analyzed using western blot analysis. In addition, Cell Counting Kit-8 and Transwell assays were used to determine cell viability and invasion, respectively. The protein expression levels of ANXA1 were increased in thyroid cancer tissues and thyroid cancer cell lines. In addition, overexpression of ANXA1 significantly increased the proliferation and invasion of the SW579 cells, while knockdown of ANXA1 expression exerted the opposite results. Furthermore, ANXA1 was transferred from the SW579 cells to the Nthy-ori3-1 cells via exosomes. Exosomal ANXA1 markedly promoted the proliferation, invasion and epithelial-to-mesenchymal transition of the Nthy-ori3-1 cells. In addition, SW579 cell-derived exosomal ANXA1 promoted tumor growth in a xenograft mouse model. Collectively, these findings indicated that SW579 cell-derived exosomal ANXA1 promoted thyroid cancer development and Nthy-ori3-1 cell malignant transformation. Therefore, these findings may aid in the development of effective treatment methods for thyroid cancer.
Keywords: thyroid cancer, malignant transformation, exosome, annexin A1
Introduction
Thyroid cancer is the most common type of endocrine malignancy, with a steadily rising incidence rate over the past few decades worldwide (1). The incidence rates of thyroid cancer in women are three times higher compared with that in men. Thyroid cancer is the fifth most common diagnosed malignancy in women in USA (2,3). There are four main types of thyroid cancer and are described as follows: Papillary thyroid carcinoma (PTC), follicular thyroid carcinoma (FTC), undifferentiated anaplastic thyroid carcinoma (ATC) and medullary thyroid carcinoma (MTC), according to their histological structure (4-6). It is important to note that the majority of thyroid carcinoma cases are derived from thyroid follicular epithelial cells and mainly include PTC, FTC and ATC (7-9). Recently, several traditional treatment methods, including surgery, radiotherapy and chemotherapy, have been used for the treatment of thyroid cancer (10). The overall 5-year survival rates of PTC and FTC are >90%; however, patients with ATC and MTC exhibit a 5-year survival rate of <10 and 70%, respectively (11-13). Therefore, it is of considerable importance to investigate potential molecular targets and determine novel treatment strategies for patients with thyroid cancer.
Exosomes are nano-sized vesicles, with diameters ranging from 40 to 150 nm and a lipid bilayer membrane that allows their release by almost all types of cells (14,15). In addition, exosomes are enriched with various bioactive molecules, such as cell-surface proteins, lipids, RNA and DNA (16). It is important to note that exosomes have been shown to play essential roles in intercellular communications, notably during the development of human cancer (17). It has also been shown that tumor cell-derived exosomes, containing bioactive molecules, are involved in the interaction between tumor and para-carcinoma cells, which contributes to the remodeling of the extracellular environment (18).
It has been shown that annexin A1 (ANXA1) protein expression level was increased in various types of human cancer, such as prostate, breast and liver cancers (19-21). In addition, the gene and protein expression level of ANXA1 was associated with the aggressive behavior of human cancer, such as breast and pancreatic cancers (22,23). Furthermore, Zhao et al (24) found that overexpression of ANXA1 could promote PTC cell migration and invasion. However, the role of ANXA1 in the intercellular communication of thyroid cancer and thyroid follicular epithelial cells remains unknown.
In the present study, the protein expression level of ANXA1, which is a multifunctional protein (25), was examined in the TT MTC and in the SW579 ATC cell lines. In addition, the effects of ANXA1 overexpression and knockdown on the proliferation and invasion of the TT and SW579 cells were also examined. Furthermore, it was investigated whether SW579 cell-derived exosomal ANXA1 could be transferred to the thyroid follicular epithelial cell line, Nthy-ori3-1 and promote its malignant transformation. These findings may aid in the development of specific treatment strategies for thyroid cancer.
Materials and methods
Data collection and differential expression analysis
To identify the differentially expressed genes (DEGs) between thyroid cancer tissues and adjacent normal tissues, their raw gene expression profiles were downloaded from the Gene Expression Omnibus (GEO), including the gene set enrichment (GSE) 33630 dataset (26,27) and The Cancer Genome Atlas (TCGA) databases (TCGA_THCA dataset; https://portal.gdc.cancer.gov/repository). R language (v4.0.3, https://cran.r-project.org/src/base/R-4/) was used to analyze the DEGs that exhibited statistical significance. P<0.05 and |log2 fold change|>2 were set as the threshold. The overlapping DEGs were identified using a Venn diagram from the GSE33630 and TCGA datasets. Functional analysis was performed using gene set enrichment analysis (GSEA; software.broadinstitute.org/gsea/index.jsp) using screening standards, and P<0.05 (28,29).
Human tissues
The thyroid cancer and adjacent normal tissues (2 cm from the tumor tissue) from three patients with thyroid cancer were obtained from Zhongshan Hospital, Fudan University (Shanghai, China) between September 2017 and January 2020. The patients included 1 male and two females (median age, 59 years; range, 49-71 years). Patients who underwent local or systemic treatment prior to surgery were excluded from the study. The inclusion criteria included a diagnosis of thyroid conditions and a diagnosis of carcinoma based on the criteria of histology and pathology. The present study was approved by the Ethics Committee of Zhongshan Hospital, Fudan University (Shanghai, China) and written informed consent was provided by all the patients.
Cell culture
The 293T cell line, the human TT MTC, the SW579 ATC and the human Nthy-ori3-1 thyroid follicular epithelial cell lines were purchased from the American Type Culture Collection and cultured in DMEM, containing 10% FBS (both from Thermo Fisher Scientific, Inc.) and penicillin and streptomycin (100 U/ml) at 37°C in a humidified atmosphere with 5% CO2.
Western blot assay
The Nthy-ori3-1, TT and SW579 cell lines were lysed using RIPA lysis buffer (Thermo Fisher Scientific, Inc.). The total protein was obtained and the protein concentration was quantified using a bicinchoninic acid protein assay kit. A total of 30 µg protein/per lane was separated using 10% SDS-PAGE and subsequently transferred onto a PVDF membrane. Subsequently, the membrane was blocked with 5% skimmed milk at room temperature for 1 h, then incubated overnight at 4°C with the primary antibodies against ANXA1 (cat. no. ab214486; 1:1,000), E-cadherin (cat. no. ab231303; 1:1,000), N-cadherin (cat. no. ab76011; 1:1,000), CD81 (cat. no. ab79559; 1:1,000), CD9 (cat. no. ab236630; 1:1,000), phosphorylated (p)AKT S473 (cat. no. ab81283; 1:1,000), AKT (cat. no. ab89402; 1:1,000), Bax (cat. no. ab182733; 1:1,000), p-SMAD2 (cat. no. ab188334; 1:1,000), SMAD2 (cat. no. ab40855; 1:1,000), β-actin (cat. no. ab8226; 1:1,000), CD63 (cat. no. ab134045; 1:1,000), TSG101 (cat. no. ab125011; 1:1,000) (all from Abcam). Subsequently, the membranes were incubated with the HRP-conjugated goat anti-rabbit secondary antibody (cat. no. ab7090; 1:5,000) or HRP-conjugated goat anti-mouse secondary antibody (cat. no. ab7068; 1:5,000) (both from Abcam) at room temperature for 1 h. Finally, the blots were developed using ECL reagents (Thermo Fisher Scientific, Inc.) and quantified using Image Pro Plus v6.0 (Media Cybernetics, Inc.) software.
Cell transfection
The pLVX-IRES-Puro ANXA1 cDNA lentiviral plasmids [ANXA1-overexpressing (OE) and lentivirus-containing short hairpin (sh)RNA targeting ANXA1 (ANXA1 shRNA1 and ANXA1 shRNA2)] were purchased from Guangzhou RiboBio Co., Ltd. The 293T cells were transfected with the aforementioned lentiviral plasmids (0.5 µg/µl) and the third-generation lentivirus packaging system (0.3 µg/µl pLP/VSVG, 0.5 µg/µl pLP1, 0.5 µg/µl pLP2) using Lipofectamine® 2000 (Thermo Fisher Scientific, Inc.) for 72 h at 37°C. Then, the supernatant containing infectious lentivirus was collected and the lentiviruses were transduced into the TT and SW579 cells for 72 h, at a multiplicity of infection of 10. After 72 h of transduction, the infected cells were selected using puromycin (2 µg/ml) for 1 week. The following shRNA sequences were used: ANXA1 shRNA1, 5′-TCTTTAGTTCT TTGCAAGAAGGTAGTTCAAGAGACTACCTTCTTGCA AAGAACTAAAGATTTTT-3′; ANXA1 shRNA2, 5′-CGCCA TAAGGCATTGATCA GGATTATTCAAGAGATAATCCTG ATCAATGCCTTATGGCGTTTTT-3′ and shRNA NC, 5′-GGGAGATGCAAATGCTTGACACATATTCAAGAGAT ATGTGTCAAGCATTTGCATCTCCCTTTTT-3′. Western blot analysis was used to verify the transfection efficiency of the lentiviruses in the TT and SW579 cell lines, transfected with shRNA NC, ANXA1 shRNA1, ANXA1 shRNA2, ANXA1 OE or OE NC plasmids. The cells in the control group did not receive any treatment.
Cell viability assay
Cell proliferation was determined using a Cell Counting Kit (CCK)-8 (Beyotime Institute of Biotechnology) assay according to the manufacturer's instructions. Briefly, a total of 5×10³ TT and SW579 cells were seeded in 96-well plates and incubated for 24, 48 and 72 h. A total of 10 µl CCK-8 reagent was added into each well and the cells were incubated for a further 2 h. The absorbance values were measured at 450 nm using a Multiskan™ flow cytometer (Thermo Fisher Scientific, Inc.).
Flow cytometry assay
The number of apoptotic cells was detected using a FITC Annexin V apoptosis detection kit (BD Biosciences). Briefly, a total of 1×10⁵ TT and SW579 cells were collected and resuspended in 200 µl binding buffer. Subsequently, the cells were stained with 5 µl Annexin V-FITC and 5 µl PI staining solution for 15 min in the dark. The induction of cell apoptosis was analyzed using a FACSCalibur flow cytometer (BD Biosciences) and the CellQuest™ Pro software (v5.1; BD Biosciences).
Transwell invasion assay
Cell invasive ability was assessed using Transwell chambers (Corning, Inc.) coated with Matrigel (BD Biosciences) for 5 h at 37°C. The TT and SW579 cells (2×10⁴ cells per well) suspended in serum-free DMEM were seeded on the underside of the 24-well plate-sized inserts. Then, 600 µl DMEM supplemented with 10% FBS was plated onto the lower chambers. The cells were incubated for 24 h at 37°C and the invasive cells on the lower surface were stained with 0.1% crystal violet for 30 min at room temperature. A total of 5 fields of view were randomly selected and visualized using light microscopy (Olympus Corporation). The number of chamber-invading cells was calculated using Image-Pro plus v6.0 (Media Cybernetics).
Exosome isolation and characterization
The SW579 and Nthy-ori3-1 cells were collected and the exosomes were isolated from the conditioned media (CM) of SW579 and Nthy-ori3-1 cells using the GETTM Exosome Isolation kit (GeneExosome Technologies). The number of cells was quantified using a Nanoparticle Tracking Analysis instrument (Particle Metrix GmbH). In addition, exosomes were placed on a copper grid for 5 min, which was stained with 2% phosphotungstic acid for 3 min at room temperature. Subsequently, the exosomes were captured using transmission electron microscopy.
The SW579 cells were transfected with ANXA1 shRNA2, shRNA NC, ANXA1 OE or OE NC plasmids. Then, the Nthy-ori3-1 cells were incubated with the exosomes isolated from the CM of the aforementioned transfected SW579 cells. In addition, the Nthy-ori3-1 cells were incubated with the exosomes isolated from the CM of SW579 cells transfected with ANXA1 shRNA2, shRNA NC and treated with 10 ng/ml TGF-β1 at 37°C for 48 h.
Exosome uptake
The SW579 cell-derived exosomes were labeled with PKH26 dye for 30 min in the dark. The labeled exosomes were incubated with the Nthy-ori3-1 cells for 24 h at 37°C. Subsequently, cellular uptake of PKH26-labeled exosomes was observed by fluorescence microscopy. The nuclei were stained with DAPI for 5 min at room temperature. The cytoskeleton of the cells was stained with phalloidin for 1 h at room temperature.
Co-culture system
The fluorescent dye, Cy3 labeled with ANXA1 was synthesized and purified by Guangzhou RiboBio Co., Ltd. Following which, the SW579 cells were transfected with Cy3 labeled-ANXA1 using Lipofectamine® 2000 (Thermo Fisher Scientific, Inc.) for 24 h at 37°C. Then, the transfected SW579 cells suspended in DMEM were plated onto the Transwell® polyester permeable supports, while the Nthy-ori3-1 cells suspended in DMEM were seeded onto the lower chamber for 24 h at 37°C. Subsequently, images of the Nthy-ori3-1 cells were captured using a fluorescence microscope.
Animal study
The animal study protocol was approved by the Ethics Committee of Zhongshan Hospital, Fudan University (Shanghai, China). A total of 30 female BALB/c nude mice (8-weeks-old; 20-25 g) were purchased from the Shanghai SLAC Animal Center. The animals were housed under controlled environmental conditions (12 h dark/light cycle; 20-22°C; humidity, 55±5%), and allowed free access to normal food and water. The SW579 cells (1×10⁷ cells in 200 µl PBS) were subcutaneously injected into the left flank of the nude mice. When the tumors reached ~200 mm3, the animals were randomly divided into the following five groups: PBS, exosome (Exo)-OE NC, Exo-ANXA1 OE, Exo-shRNA NC and Exo-ANXA1 shRNA2. The exosomes were extracted from the SW579 cells transfected with OE-NC (Exo-OE NC), ANXA1-OE (Exo-ANXA1-OE), shRNA NC (Exo-shRNA NC) or ANXA1 shRNA2 (Exo-ANXA1 shRNA2) plasmids. Subsequently, the mice were intravenously injected with PBS, Exo-OE NC, Exo-ANXA1 OE, Exo-shRNA NC, Exo-ANXA1 shRNA2 every 2 days. The tumor volume and size were measured every week. The tumor volume was calculated using the following formula: Volume = (length x width2)/2. Then, the mice were sacrificed on day 21 (40% CO2 volume/min) and the tumors were removed.
Immunohistochemistry (IHC)
Ki67 expression in the tumor tissues was assessed using IHC analysis. Briefly, the tumor tissues were fixed in 4% paraformaldehyde for 24 h at 4°C, embedded in paraffin, then cut into 4-µm thick sections. Following which, the sections were fixed on to a glass slide, then deparaffinized in xylene and rehydrated in a graded alcohol series (100, 100, 90 and 75% for 20 min). Subsequently, the slides were heated in citrate buffer at 80°C and incubated with 3% hydrogen peroxide for 10 min at room temperature. After blocking with 5% BSA (Thermo Fisher Scientific, Inc.) for 40 min at 37°C, the sections were incubated with a rabbit antibody against Ki67 (1:100 dilution; cat. no. 27309-1-AP; ProteinTech Group, Inc.) overnight at 4°C. After washing three times with PBS, the sections were incubated with a secondary antibody (1:100 dilution; cat. no. SA00007-7; ProteinTech Group, Inc.) at 37°C for 1 h. Next, the sections were visualized with DAB reagent for 5 min at room temperature, then counterstained with Mayer's hematoxylin for 40 sec at room temperature. Finally, the slides were examined under a fluorescence microscope. Image Pro Plus v6.0 (Media Cybernetics, Inc.) software was used to analyze the area and intensity of the positive staining field of the tumor tissues.
TUNEL assay
An in situ cell death detection kit [Roche Diagnostics (Shanghai) Co., Ltd.] was used to evaluate cell apoptosis in the tumor tissues. Briefly, the tumor tissues were fixed in 4% paraformaldehyde for 24 h at 4°C, embedded in paraffin, then cut into 4-µm thick sections. The slides were stained with TUNEL reagent for 60 min at 37°C. Cell nucleus was stained with DAPI for 5 min at room temperature in the dark. Following which, the slides were washed with PBS three times (5 min each time), then mounting medium (all from ASPEN Biotechnology LLC) was added to the slides. Then, the TUNEL-positive cells were observed in five random microscopic regions using a fluorescence microscope. Image Pro Plus v6.0 (Media Cybernetics, Inc.) software was used to analyze the area and intensity of the positive staining field of the tumor tissues.
Statistical analysis
All statistical analyses were performed using GraphPad Prism v7.0 (GraphPad Software, Inc.) software. The differences between 2 groups were analyzed using an unpaired Student's t-test. The differences between >3 groups were analyzed using one-way ANOVA followed by Tukey's post hoc test. The data are presented as the mean ± standard deviation. P<0.05 was considered to indicate a statistically significant difference. All experiments were performed in triplicate.
Results
Identification of DEGs in thyroid cancer
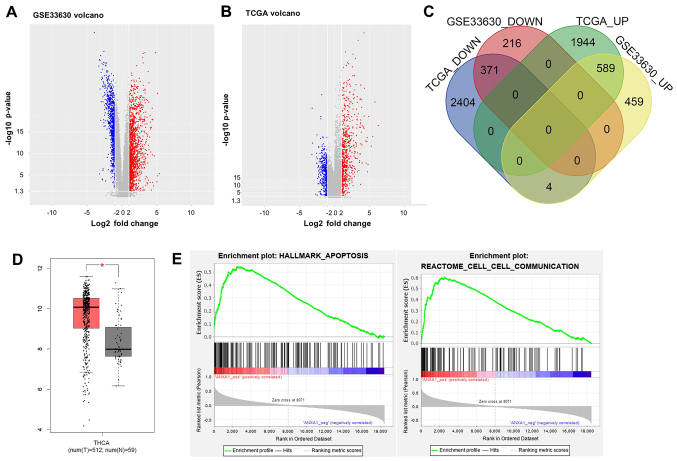
To identify the DEGs between thyroid cancer and adjacent normal tissues, the GSE33630, from the GEO database, and TCGA datasets were analyzed. Volcano plot analysis revealed that a total of 1,635 and 5,312 DEGs were identified in the GSE33630 and TCGA datasets, respectively (Fig. 1A and B). The expression level of ANXA1 was increased in thyroid cancer tissues in the two datasets. In addition, 371 common downregulated DEGs and 589 common upregulated DEGs were identified in two datasets using a Venn diagram (Fig. 1C). Furthermore, the expression levels of ANXA1 in 512 thyroid cancer tissues were higher compared with that in 59 adjacent normal tissues in TCGA dataset (Fig. 1D). Previous studies have shown that ANXA1 expression was upregulated in various types of human cancer, suggesting that this protein may act as an oncogene and promote carcinogenesis (23,24,30). GSEA revealed that the genes associated with ANXA1 expression were markedly enriched in the apoptotic pathway (enrichment score, 0.54; normalized enrichment score, 2.05; P<0.05) and were involved in cell-to-cell communication (enrichment score, 0.60; normalized enrichment score, 2.15; P<0.05) (Fig. 1E). Therefore, ANXA1 was selected for subsequent analysis.
Figure 1.
Identification of DEGs in thyroid cancer. The gene expression profiles of thyroid cancer tissues and normal tissues from (A) GSE and (B) TCGA datasets are presented as a volcano plot. The red dots represent the upregulated DEGs, while the blue dots represented the downregulated DEGs. (C) Overlapping results of the up- and downregulated DEGs from the two datasets. (D) The mRNA expression levels of ANXA1 in thyroid cancer tissues (n=512) and normal tissues (n=59) in TCGA dataset. *P<0.05. (E) Enrichment of ANXA1-regulated genes in apoptosis and cell-cell communication pathways. DEGs, differentially expressed genes, TCGA, The Cancer Genome Atlas; GSE, gene set enrichment; ANXA1, annexin A1.
ANXA1 is overexpressed in thyroid cancer
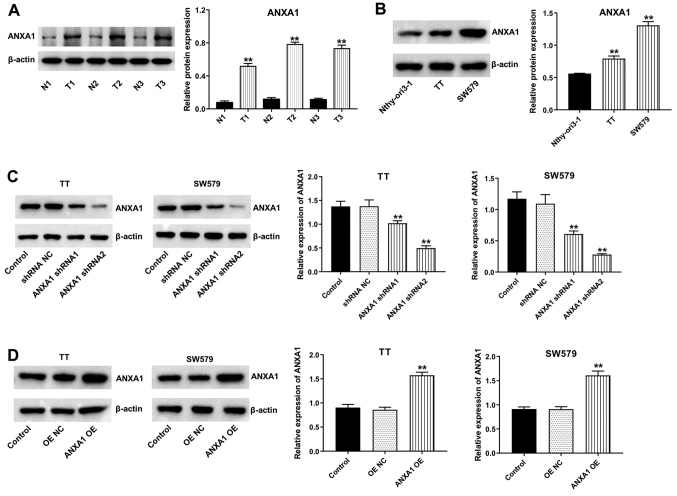
To investigate the role of ANXA1 in thyroid cancer, western blot analysis was used to evaluate the protein expression levels of ANXA1 in thyroid cancer and adjacent normal tissues, and in cell lines. As shown in Fig. 2A, the protein expression level of ANXA1 was increased in thyroid cancer tissues compared with that in matched normal tissues. In addition, the protein expression levels of ANXA1 were significantly increased in the TT and SW579 cell lines compared with that in the Nthy-ori3-1 cell line (Fig. 2B). Furthermore, ANXA1 protein expression levels were markedly downregulated in the TT and SW579 cell lines transfected with ANXA1 shRNA plasmids (Fig. 2C). The data revealed that ANXA1 shRNA2 downregulated ANXA1 more significantly than ANXA1 shRNA1 in the TT and SW579 cell lines; thus, ANXA1 shRNA2 was used in the following experiments. In addition, the protein expression levels of ANXA1 were notably elevated in the TT and SW579 cells transfected with the ANXA1-OE plasmids (Fig. 2D). Collectively, the data indicated that ANXA1 was overexpressed in thyroid cancer.
Figure 2.
ANXA1 is overexpressed in thyroid cancer. (A) The protein expression level of ANXA1 in thyroid cancer tissues and matched normal tissues was detected using western blot analysis. **P<0.01 vs. N group. (B) The protein expression level of ANXA1 in the Nthy-ori3-1, TT and SW579 cell lines were detected using western blot analysis. **P<0.01 vs. Nthy-ori3-1. (C) The TT and SW579 cells were transfected with shRNA NC, ANXA1 shRNA1 and ANXA1 shRNA2, and western blot analysis was used to determine the protein expression level of ANXA1. **P<0.01 vs. shRNA NC. (D) The TT and SW579 cells were transfected with OE NC and ANXA1 OE plasmids, then western blot analysis was used to determine the protein expression level of ANXA1. **P<0.01 vs. OE NC. N, normal tissues; T, tumor tissues; sh, short hairpin; OE, overexpression; NC, negative control; ANXA1, annexin A1.
Downregulation of ANXA1 induces apoptosis and suppresses proliferation and invasion in the thyroid cancer cells
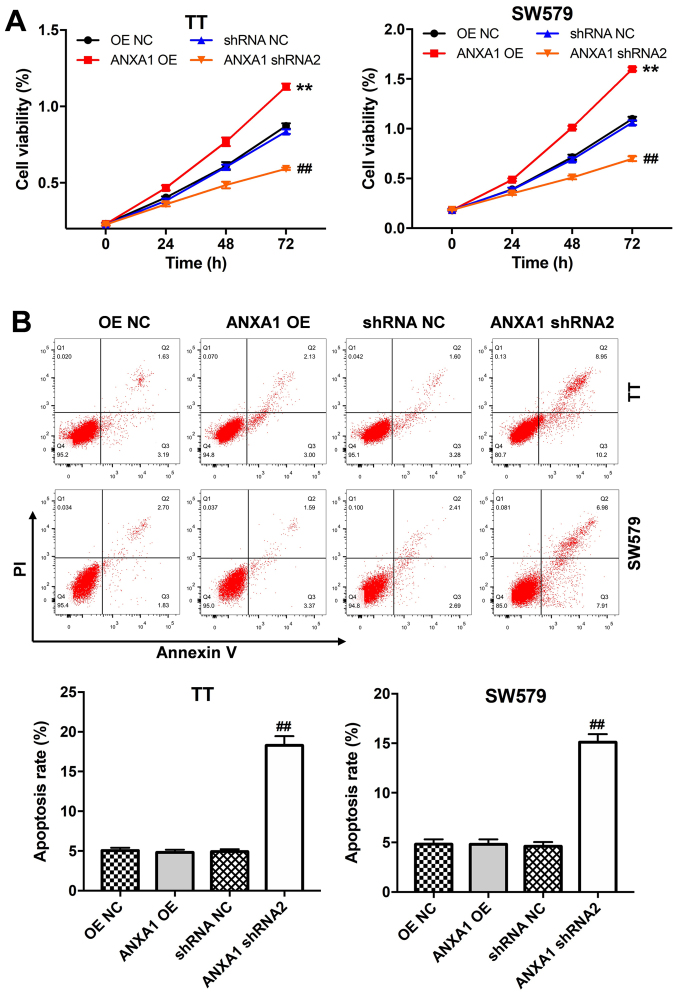
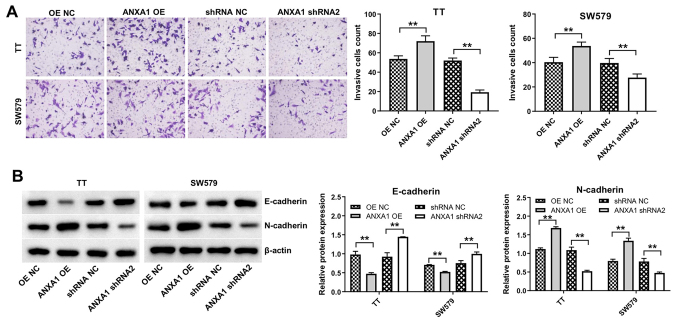
The CCK-8 assay was performed to assess the effects of ANXA1 on the proliferation of the TT and SW579 cells. Overexpression of ANXA1 notably promoted the proliferation of the TT and SW579 cells, while ANXA1 knockdown inhibited cell proliferation (Fig. 3A). In addition, downregulation of ANXA2 induced apoptosis in the TT and SW579 cells (Fig. 3B). Furthermore, the TT or SW579 cells transfected with ANXA1-OE plasmids exhibited increased cell invasive ability compared with that in the cells transfected with OE-NC, while the cells transfected with the ANXA shRNA2 plasmids displayed the opposite result (Fig. 4A). Lastly, overexpression of ANXA1 markedly decreased E-cadherin protein expression levels and increased N-cadherin expression levels in the TT and SW579 cells, while ANXA1 knockdown displayed the opposite result (Fig. 4B). Collectively, the data indicated that downregulation of ANXA1 could induce apoptosis and inhibit proliferation and invasion in the thyroid cancer cells.
Figure 3.
Downregulation of ANXA1 suppresses proliferation and promotes apoptosis in the thyroid cancer cells. (A) Proliferation and (B) apoptosis of the TT and SW579 cells transfected with ANXA1 shRNA2, ANXA1 OE or NC plasmids was measured using a Cell Counting Kit-8 assay and flow cytometry, respectively. **P<0.01 vs. OE NC; ##P<0.01 vs. shRNA NC. sh, short hairpin; OE, overexpression; NC, negative control; ANXA1, annexin A1.
Figure 4.
Downregulation of ANXA1 inhibits the invasion and EMT in the thyroid cancer cells. (A) Proliferation of the TT and SW579 cells transfected with ANXA1 shRNA2, ANXA1 OE or NC plasmids was analyzed using a CCK-8 assay. (B) Western blot analysis was used to analyze the protein expression level of E-cadherin and N-cadherin in the TT and SW579 cells transfected with ANXA1 shRNA2, ANXA1 OE or NC plasmids. **P<0.01. sh, short hairpin; OE, overexpression; NC, negative control; ANXA1, annexin A1.
ANXA1 is transferred from the SW579 to the Nthy-ori3-1 cells via exosomes
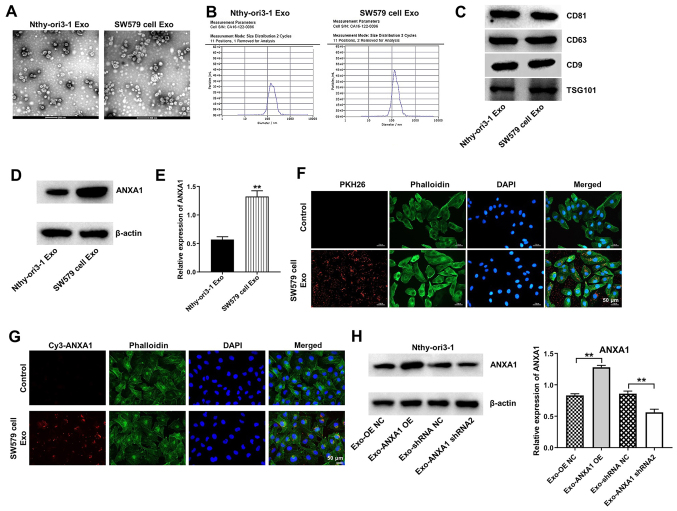
It has been shown that ANXA1 can be transferred from tumor cells to recipient cells via exosomes (31). Therefore, the present study examined whether ANXA1 could be transferred from the SW579 to the Nthy-ori3-1 cells via exosomes. Exosomes were isolated from the CM of SW579 and Nthy-ori3-1 cells. Exosomes secreted from the SW579 and Nthy-ori3-1 cells indicated a typical round-particle structure with a diameter range of 50-150 nm (Fig. 5A and B). In addition, western blot analysis confirmed the presence of the exosome markers, CD81, CD63, CD9 and TSG101 in the exosomes extracted from the SW579 and Nthy-ori3-1 cells (Fig. 5C). Furthermore, the protein expression levels of ANXA1 were upregulated in the SW579 cell-derived exosomes (SW579-exo) compared with that in the Nthy-ori3-1 cell-derived exosomes (Fig. 5D and E).
Figure 5.
ANXA1 is transferred from the SW579 cells to the Nthy-ori3-1 cells via exosomes. Identification of the exosomes derived from the Nthy-ori3-1 cells and SW579 cells using (A) transition electron microscopy, (B) Nanoparticle Tracking Analysis and (C) western blot analysis. (D) The protein expression level of ANXA1 was analyzed using western blot analysis in exosomes isolated from the Nthy-ori3-1 and SW579 cells and the results were (E) statistically analyzed. **P<0.01 vs. Nthy-ori3-1-Exo. (F) SW579 cell-derived exosomes (Red) absorbed by the Nthy-ori3-1 cells were observed under a confocal fluorescence microscope. (G) The SW579 cells transfected with Cy3-tagged ANXA1 were co-cultured with the Nthy-ori3-1 cells for 48 h, then the Cy3-tagged ANXA1 absorbed by the Nthy-ori3-1 cells were observed under a fluorescence microscope. (H) The SW579 cells were transfected with ANXA1 shRNA2 or ANXA1 OE plasmids, then the conditioned medium was co-cultured with the Nthy-ori3-1 cells. The protein expression level of ANXA1 was subsequently analyzed. **P<0.01. sh, short hairpin; OE, overexpression; NC, negative control; ANXA1, annexin A1; Exo, exosomes.
To determine whether the Nthy-ori3-1 cells could uptake SW579-exo, the Nthy-ori3-1 cells were incubated with PKH26-labeleled SW579-exo. The SW579-exo were internalized by the Nthy-ori3-1 cells (Fig. 5F). In addition, the SW579 cells transfected with Cy3 dye-labeled ANXA1 were co-cultured with the Nthy-ori3-1 cells, and Cy3 dye-labeled ANXA1 was observed in the Nthy-ori3-1 cells (Fig. 5G). Subsequently, the Nthy-ori3-1 cells were incubated with exosomes derived from the SW579 cells transfected with the OE-NC (Exo-OE NC), ANXA1-OE (Exo-ANXA1-OE), shRNA NC (Exo-shRNA NC) or ANXA1 shRNA2 (Exo-ANXA1 shRNA2) plasmids. The protein expression levels of ANXA1 were increased in the Nthy-ori3-1 cells incubated with Exo-ANXA1-OE, whereas the Nthy-ori3-1 cells incubated with Exo-ANXA1 shRNA2 displayed the opposite result (Fig. 5H). These results suggested that ANXA1 could be transferred from the SW579 cells to the Nthy-ori3-1 cells via exosomes.
Exosomal ANXA1 promotes malignant transformation of the Nthy-ori3-1 cells
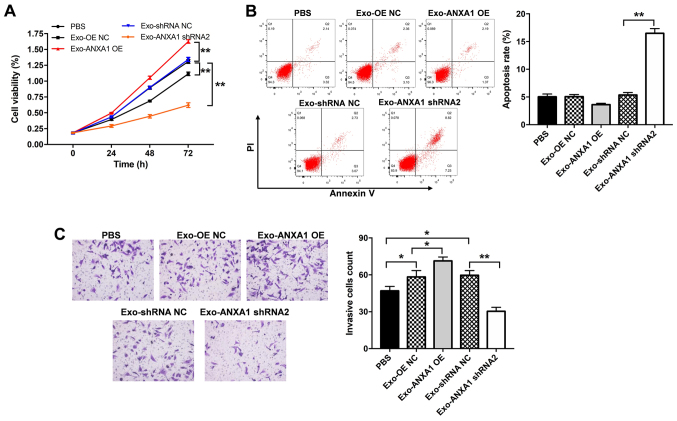
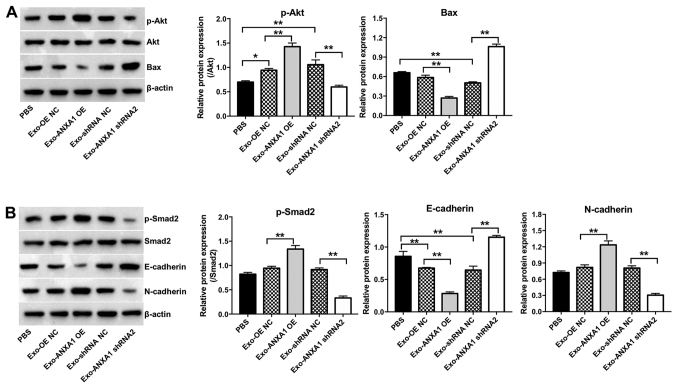
To further investigate the role of Exo-ANXA1-OE or Exo-ANXA1 shRNA2 on the Nthy-ori3-1 cells, CCK-8, flow cytometry and Transwell invasion assays were performed. Exo-ANXA1 shRNA2 induced apoptosis and caused a significant suppression in the proliferation and invasion ability of the Nthy-ori3-1 cells compared with that in the Exo-shRNA NC group (Fig. 6A-C). By contrast, Exo-ANXA1-OE increased the proliferative and invasive abilities of the Nthy-ori3-1 cells compared with that in the cells transfected with Exo-OE NC (Fig. 6A and C, respectively). In addition, Exo-ANXA1-OE notably upregulated the protein expression levels of p-AKT, p-SMAD2 and N-cadherin and downregulated the protein expression levels of Bax and E-cadherin in the Nthy-ori3-1 cells compared with that in cells transfected with Exo-OE NC. However, the Nthy-ori3-1 cells transfected with Exo-ANXA1 shRNA2 exhibited the opposite results (Fig. 7A and B). Furthermore, Exo-ANXA1-shRNA2 significantly decreased the protein expression level of p-Smad2 and N-cadherin and increased the protein expression level of E-cadherin in the Nthy-ori3-1 cells; however, these changes were reversed by TGF-β1 treatment (Fig. S1A and B). Collectively, the data suggested that exosomal ANXA1 could promote malignant transformation of the Nthy-ori3-1 cells via the TGF-β1/Smad2 pathway.
Figure 6.
Exosomal ANXA1 promotes malignant transformation of the Nthy-ori3-1 cells. The SW579 cells were transfected with ANXA1 shRNA2, ANXA1 OE or NC plasmids, then the Nthy-ori3-1 cells were co-cultured with exosomes isolated from the conditioned medium from the transfected SW579 cells. (A) Cell Counting Kit-8 assay, (B) flow cytometry assay and (C) Transwell assay was analyzed to determine proliferation, apoptosis and invasion, respectively. *P<0.05, **P<0.01. sh, short hairpin; OE, overexpression; NC, negative control; ANXA1, annexin A1; Exo, exosomes.
Figure 7.
Exosomal ANXA1 promotes the malignant transformation of the Nthy ori3-1 cells via the activation of TGF-β/Smad2 and Akt signaling. The SW579 cells were transfected with ANXA1 shRNA2, ANXA1 OE or NC plasmids, then the Nthy-ori3-1 cells were co-cultured with exosomes isolated from the conditioned medium from the transfected SW579 cells. The protein expression level of (A) p-Akt and Bax, and (B) p-Smad2, E-cadherin and N-cadherin in the Nthy-ori3-1 cells were determined using western blot analysis. *P<0.05, **P<0.01. sh, short hairpin; OE, overexpression; NC, negative control; ANXA1, annexin A1; Exo, exosomes; p, phosphorylated.
Exosomal ANXA1 promotes the tumorigenesis of thyroid cancer cells in vivo
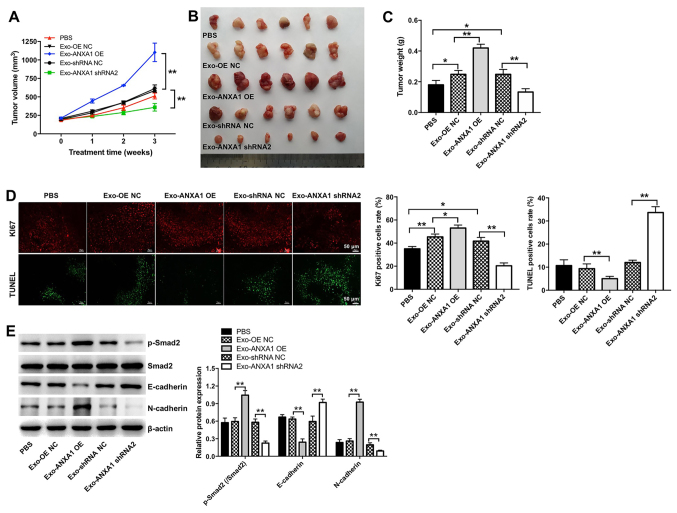
The effects of exosomal ANXA1 on the growth of SW579 xenografts in vivo were investigated. Exo-ANXA1-OE increased tumor volume and weight compared with that in the Exo-OE NC group, while the opposite results were observed in the Exo-ANXA1 shRNA2 group (Fig. 8A-C). In addition, Ki67 IHC and TUNEL assays indicated that Exo-ANXA1-OE markedly promoted the proliferation of thyroid cancer cells and inhibited the induction of their apoptosis in vivo compared with that in the Exo-OE NC group (Fig. 8D). By contrast, Exo-ANXA1 shRNA2 notably suppressed cell proliferation and triggered apoptosis in the thyroid xenografts compared with that in the Exo-shRNA NC group (Fig. 8D). Furthermore, Exo-ANXA1-OE markedly increased the protein expression level of p-Smad2 and N-cadherin and decreased the protein expression level of E-cadherin in thyroid xenografts, whereas the opposite results were observed in the Exo-ANXA1 shRNA2 group (Fig. 8E). Collectively, the data indicated that exosomal ANXA1 could promote tumorigenesis of thyroid cancer cells in vivo.
Figure 8.
Exosomal ANXA1 promotes the tumorigenesis of thyroid cancer cells in vivo. (A) Tumor volume was measured every week. (B) Representative images of the xenograft tumors. (C) The tumor weight was measured. (D) Immunohistochemistry of Ki67 and TUNEL assay was used to analyze proliferation and cell apoptosis in the tumor tissues. (E) The protein expression level of p-Smad2, E-cadherin and N-cadherin in tumor tissues were determined using western blot analysis. *P<0.05, **P<0.01. sh, short hairpin; OE, overexpression; NC, negative control; ANXA1, annexin A1; Exo, exosomes; p, phosphorylated.
Discussion
Exosomes have been shown to participate in cancer progression by transferring bioactive molecules, such as proteins, between tumor and non-malignant cells in the tumor micro-environment (14,15,32). Tumor-derived exosomes were associated with cancer development and progression, as they are critical components of oncogenic transformation (33). The present study investigated whether the exchange of exosomal proteins between thyroid cancer and recipient cells affected cancer progression. The data indicated that ANXA1 protein expression was increased in thyroid cancer tissues and in thyroid cancer cells. In addition, overexpression of ANXA1 significantly promoted thyroid cancer cell proliferation and invasion. ANXA1 could be transferred from the SW579 cells to the Nthy-ori3-1 cells via exosomes. Furthermore, exosomes with upregulated ANXA1 expression markedly promoted the proliferation, invasion and epithelial-to-mesenchymal transition (EMT) in the Nthy-ori3-1 cells, thereby promoting malignant transformation of the Nthy-ori3-1 cells. These data showed that exosomes could serve as mediators for intercellular communication via the delivery of ANXA1. In addition, exosomal ANXA1, derived from SW579 cells, promoted thyroid tumorigenesis in vivo. Therefore, exosomal ANXA1 derived from the SW579 cells promoted thyroid tumorigenesis in vivo.
ANXA1 is a Ca+2-binding protein, which has been shown to be upregulated in various types of human cancer, including thyroid cancer (19,24,30). Evidence has shown that the gene and protein expression level of ANXA1 was associated with the aggressive behavior of human cancers, such as breast and pancreatic cancers (22,23). In addition, Zhao et al (24) found that overexpression of ANXA1 could promote PTC cell migration and invasion. Cheng et al (34) demonstrated that ANXA1 notably promoted gastric cancer cell invasion. The results from the present study indicated that upregulation of ANXA1 protein expression level increased the proliferation, invasion and EMT of the SW579 cells, whereas ANXA1 knockdown displayed the opposite results. These results supported the finding that ANXA1 may act as an oncogene in the development of thyroid cancer (24).
It has been shown that cancer-secreted proteins can be delivered to recipient cells via exosomes. Subsequently, they play an important role in promoting cancer malignancy (35,36). Steinhaeuser et al (37) found that HER2-overexpressing breast cancer cell-secreted extracellular matrix protein 1 could promote breast cancer progression by enhancing cell migration and invasion. Wei et al (38) revealed that gastric cancer cell-derived exosomes could induce the malignant phenotype in the normal GES-1 gastric epithelial cells. Chen et al (39) demonstrated that epithelial ovarian cancer cell-derived exosomes could remodel macrophages to a pro-tumor phenotype. Peinado et al (40) demonstrated that melanoma-derived exosomes could reprogram bone marrow cells toward a pro-vasculogenic phenotype. The present study demonstrated that ANXA1 was directly transferred from the SW579 cells to thyroid follicular epithelial cells via exosomes. In addition, exosomal ANXA1 derived from thyroid cancer cells promoted the proliferation and invasion of thyroid follicular epithelial cells. Furthermore, the Nthy-ori3-1 cells exposed to exosomal ANXA1 exhibited significantly increased protein expression of the EMT marker, N-cadherin and decreased protein expression of the mesenchymal-to-epithelial transition marker, E-cadherin. These results indicated that the Nthy-ori3-1 cells could acquire increased invasiveness via EMT. Furthermore, exosomal ANXA1 increased p-SMAD2 and p-AKT protein expression in the Nthy-ori3 1 cells, indicating that it could induce their pro-survival phenotype via the activation of TGF-β/SMAD2 and AKT signaling. These data suggested that SW579 cell-derived exosomal ANXA1 could promote the malignant transformation of the Nthy-ori3-1 cells. Collectively, exosomes secreted from the SW579 cells could deliver ANXA1 into recipient cells, promoting tumorigenesis and inducing the recipient cells to acquire a malignant phenotype. In the present study, it was only investigated whether exosomal ANXA1-derived from the SW579 cells could affect thyroid tumorigenesis in vivo. However, in future research, the tumorigenic ability of the Nthy-ori3-1 cells, that had been exposed to exosomal ANXA1, requires further investigation in vivo.
Furthermore, it was found that shRNA NC and OE NC plasmids did not affect the protein expression level of ANXA1 in the SW579 cells. Thus, shRNA NC and OE NC plasmids were used as the NC in the experiments. In addition, the protein expression levels of ANXA1 were increased in the Nthy-ori3-1 cells incubated with Exo-ANXA1-OE plasmid, whereas the Nthy-ori3-1 cells incubated with Exo-ANXA1 shRNA2 plasmid displayed the opposite result. These results suggested that ANXA1 shRNA2 and ANXA1-OE could be transferred from the SW579 cells to the Nthy-ori3-1 cells via exosomes. Furthermore, Exo-shRNA NC significantly increased tumor volume and weight compared with that in the PBS group. However, Exo-ANXA1 shRNA2 markedly decreased tumor volume and weight compared with that in the Exo-shRNA NC group. Therefore, exosomes contained the lentiviral plasmids (ANXA1 or shRNA2). However, this was not verified due to limitations in laboratory technology, which can determine whether exosomes contain lentiviral vectors. Thus, further research is required to investigate whether exosomes contain lentiviral vectors in vivo.
The present study indicated a novel molecular mechanism underlying the crosstalk between thyroid cancer cells and thyroid follicular epithelial cells. This interaction may promote thyroid cancer progression and could be investigated therapeutically to develop novel treatment strategies for thyroid cancer.
Supplementary Data
Acknowledgments
Not applicable.
Funding Statement
This work was supported by Scientific and Innovative Action Plan of Shanghai (21ZR1412000).
Availability of data and materials
The datasets used and/or analyzed during the current study are available from the corresponding author on reasonable request.
Authors' contributions
QL, WL and ZW contributed to the conception and design of the study, drafted the manuscript. CW acquired and analyzed the data, and revised the manuscript. ZA contributed to the conception and design of the study, and revised the manuscript. All the authors agreed to be accountable for all aspects of the work. All authors read and approved the final version of the manuscript. All authors confirmed the authenticity of all the raw data.
Ethics approval and consent to participate
All experiments were approved by the Ethics Committee of Zhongshan Hospital, Fudan University (Shanghai, China). Written informed consent was provided by all the patients.
Patient consent for publication
Not applicable.
Competing interests
The authors declare that they have no conflicts of interest.
References
- 1.Ancker OV, Krüger M, Wehland M, Infanger M, Grimm D. Multikinase Inhibitor Treatment in Thyroid Cancer. Int J Mol Sci. 2019;21:21. doi: 10.3390/ijms21010010. [DOI] [PMC free article] [PubMed] [Google Scholar]
- 2.Siegel RL, Miller KD, Jemal A. Cancer Statistics, 2017. CA Cancer J Clin. 2017;67:7–30. doi: 10.3322/caac.21387. [DOI] [PubMed] [Google Scholar]
- 3.Haugen BR. 2015 American Thyroid Association Management Guidelines for Adult Patients with Thyroid Nodules and Differentiated Thyroid Cancer: What is new and what has changed? Cancer. 2017;123:372–381. doi: 10.1002/cncr.30360. [DOI] [PubMed] [Google Scholar]
- 4.Zheng X, Wang S, Hong S, Liu S, Chen G, Tang W, Zhao Y, Gao H, Cha B. CXCR4/RhoA signaling pathway is involved in miR-128-regulated proliferation and apoptosis of human thyroid cancer cells. Int J Clin Exp Pathol. 2017;10:9213–9222. [PMC free article] [PubMed] [Google Scholar]
- 5.Chmielik E, Rusinek D, Oczko-Wojciechowska M, Jarzab M, Krajewska J, Czarniecka A, Jarzab B. Heterogeneity of Thyroid Cancer. Pathobiology. 2018;85:117–129. doi: 10.1159/000486422. [DOI] [PubMed] [Google Scholar]
- 6.Schmid KW. Problem areas of tumour classifications - thyroid carcinomas. Verh Dtsch Ges Pathol. 2007;91:57–65. In German. [PubMed] [Google Scholar]
- 7.Hong CM, Ahn BC, Jeong SY, Lee SW, Lee J. Distant metastatic lesions in patients with differentiated thyroid carcinoma. Clinical implications of radioiodine and FDG uptake Nucl Med (Stuttg) 2013;52:121–129. doi: 10.3413/Nukmed-0541-12-11. [DOI] [PubMed] [Google Scholar]
- 8.Qiu K, Xie Q, Jiang S, Lin T. miR-98-5p promotes apoptosis and inhibits migration and cell growth in papillary thyroid carcinoma through Bax/Caspase-3 by HMGA2. J Clin Lab Anal. 2020;34:e23044. doi: 10.1002/jcla.23044. [DOI] [PMC free article] [PubMed] [Google Scholar]
- 9.Dralle H, Machens A, Basa J, Fatourechi V, Franceschi S, Hay ID, Nikiforov YE, Pacini F, Pasieka JL, Sherman SI. Follicular cell-derived thyroid cancer. Nat Rev Dis Primers. 2015;1:15077. doi: 10.1038/nrdp.2015.77. [DOI] [PubMed] [Google Scholar]
- 10.Guo F, Fu Q, Wang Y, Sui G. Long non-coding RNA NR2F1-AS1 promoted proliferation and migration yet suppressed apoptosis of thyroid cancer cells through regulating miRNA-338-3p/CCND1 axis. J Cell Mol Med. 2019;23:5907–5919. doi: 10.1111/jcmm.14386. [DOI] [PMC free article] [PubMed] [Google Scholar]
- 11.Correa P, Chen VW. Endocrine gland cancer. Cancer. 1995;75(Suppl):338–352. doi: 10.1002/1097-0142(19950101)75:1+<338::AID-CNCR2820751316>3.0.CO;2-F. [DOI] [PubMed] [Google Scholar]
- 12.Paunovic IR, Sipetic SB, Zoric GV, Diklic AD, Savic DV, Marinkovic J, Zivaljevic VR. Survival and prognostic factors of anaplastic thyroid carcinoma. Acta Chir Belg. 2015;115:62–67. doi: 10.1080/00015458.2015.11681068. [DOI] [PubMed] [Google Scholar]
- 13.Stanković V, Borojević N, Dzodić R, Golubicić I. Medullary carcinoma of the thyroid gland: Effect of postoperative transcutaneous radiotherapy on local control and results of treatment. Acta Chir Iugosl. 2003;50:125–130. doi: 10.2298/aci0303125s. In Serbian. [DOI] [PubMed] [Google Scholar]
- 14.Kalluri R. The biology and function of exosomes in cancer. J Clin Invest. 2016;126:1208–1215. doi: 10.1172/JCI81135. [DOI] [PMC free article] [PubMed] [Google Scholar]
- 15.Tai YL, Chen KC, Hsieh JT, Shen TL. Exosomes in cancer development and clinical applications. Cancer Sci. 2018;109:2364–2374. doi: 10.1111/cas.13697. [DOI] [PMC free article] [PubMed] [Google Scholar]
- 16.Kalluri R, LeBleu VS. The biology, function, and biomedical applications of exosomes. Science. 2020;367:367. doi: 10.1126/science.aau6977. [DOI] [PMC free article] [PubMed] [Google Scholar]
- 17.Zhang L, Yu D. Exosomes in cancer development, metastasis, and immunity. Biochim Biophys Acta Rev Cancer. 2019;1871:455–468. doi: 10.1016/j.bbcan.2019.04.004. [DOI] [PMC free article] [PubMed] [Google Scholar]
- 18.Wu F, Li F, Lin X, Xu F, Cui RR, Zhong JY, Zhu T, Shan SK, Liao XB, Yuan LQ, et al. Exosomes increased angiogenesis in papillary thyroid cancer microenvironment. Endocr Relat Cancer. 2019;26:525–538. doi: 10.1530/ERC-19-0008. [DOI] [PubMed] [Google Scholar]
- 19.Bizzarro V, Belvedere R, Migliaro V, Romano E, Parente L, Petrella A. Hypoxia regulates ANXA1 expression to support prostate cancer cell invasion and aggressiveness. Cell Adhes Migr. 2017;11:247–260. doi: 10.1080/19336918.2016.1259056. [DOI] [PMC free article] [PubMed] [Google Scholar]
- 20.Vecchi L, Alves Pereira, Zóia M, Goss Santos T, de Oliveira Beserra A, Colaço Ramos CM, França Matias Colombo B, Paiva Maia YC, Piana de Andrade V, Teixeira Soares Mota S, Gonçalves de Araújo T, et al. Inhibition of the AnxA1/FPR1 autocrine axis reduces MDA-MB-231 breast cancer cell growth and aggressiveness in vitro and in vivo. Biochim Biophys Acta Mol Cell Res. 2018;1865:1368–1382. doi: 10.1016/j.bbamcr.2018.06.010. [DOI] [PubMed] [Google Scholar]
- 21.Zhuang C, Wang P, Sun T, Zheng L, Ming L. Expression levels and prognostic values of annexins in liver cancer. Oncol Lett. 2019;18:6657–6669. doi: 10.3892/ol.2019.11025. [DOI] [PMC free article] [PubMed] [Google Scholar]
- 22.Gibbs LD, Vishwanatha JK. Prognostic impact of AnxA1 and AnxA2 gene expression in triple-negative breast cancer. Oncotarget. 2017;9:2697–2704. doi: 10.18632/oncotarget.23627. [DOI] [PMC free article] [PubMed] [Google Scholar]
- 23.Belvedere R, Novizio N, Pessolano E, Tosco A, Eletto D, Porta A, Campiglia P, Perretti M, Filippelli A, Petrella A. Heparan sulfate binds the extracellular Annexin A1 and blocks its effects on pancreatic cancer cells. Biochem Pharmacol. 2020;182:114252. doi: 10.1016/j.bcp.2020.114252. [DOI] [PubMed] [Google Scholar]
- 24.Zhao X, Ma W, Li X, Li H, Li J, Li H, He F. ANXA1 enhances tumor proliferation and migration by regulating epithelial-mesenchymal transition and IL-6/JAK2/STAT3 pathway in papillary thyroid carcinoma. J Cancer. 2021;12:1295–1306. doi: 10.7150/jca.52171. [DOI] [PMC free article] [PubMed] [Google Scholar]
- 25.Belvedere R, Bizzarro V, Popolo A, Dal Piaz F, Vasaturo M, Picardi P, Parente L, Petrella A. Role of intracellular and extracellular annexin A1 in migration and invasion of human pancreatic carcinoma cells. BMC Cancer. 2014;14:961. doi: 10.1186/1471-2407-14-961. [DOI] [PMC free article] [PubMed] [Google Scholar]
- 26.Tomás G, Tarabichi M, Gacquer D, Hébrant A, Dom G, Dumont JE, Keutgen X, Fahey TJ, III, Maenhaut C, Detours V. A general method to derive robust organ-specific gene expression-based differentiation indices: Application to thyroid cancer diagnostic. Oncogene. 2012;31:4490–4498. doi: 10.1038/onc.2011.626. [DOI] [PubMed] [Google Scholar]
- 27.Dom G, Tarabichi M, Unger K, Thomas G, Oczko-Wojciechowska M, Bogdanova T, Jarzab B, Dumont JE, Detours V, Maenhaut C. A gene expression signature distinguishes normal tissues of sporadic and radiation-induced papillary thyroid carcinomas. Br J Cancer. 2012;107:994–1000. doi: 10.1038/bjc.2012.302. [DOI] [PMC free article] [PubMed] [Google Scholar]
- 28.Subramanian A, Tamayo P, Mootha VK, Mukherjee S, Ebert BL, Gillette MA, Paulovich A, Pomeroy SL, Golub TR, Lander ES, et al. Gene set enrichment analysis: A knowledge-based approach for interpreting genome-wide expression profiles. Proc Natl Acad Sci USA. 2005;102:15545–15550. doi: 10.1073/pnas.0506580102. [DOI] [PMC free article] [PubMed] [Google Scholar]
- 29.Hu C, Zhou Y, Liu C, Kang Y. A novel scoring system for gastric cancer risk assessment based on the expression of three CLIP4 DNA methylation-associated genes. Int J Oncol. 2018;53:633–643. doi: 10.3892/ijo.2018.4433. [DOI] [PMC free article] [PubMed] [Google Scholar]
- 30.Feng J, Lu SS, Xiao T, Huang W, Yi H, Zhu W, Fan S, Feng XP, Li JY, Yu ZZ, et al. ANXA1 Binds and Stabilizes EphA2 to Promote Nasopharyngeal Carcinoma Growth and Metastasis. Cancer Res. 2020;80:4386–4398. doi: 10.1158/0008-5472.CAN-20-0560. [DOI] [PubMed] [Google Scholar]
- 31.Novizio N, Belvedere R, Pessolano E, Tosco A, Porta A, Perretti M, Campiglia P, Filippelli A, Petrella A. Annexin A1 Released in Extracellular Vesicles by Pancreatic Cancer Cells Activates Components of the Tumor Microenvironment, through Interaction with the Formyl-Peptide Receptors. Cells. 2020;9:9. doi: 10.3390/cells9122719. [DOI] [PMC free article] [PubMed] [Google Scholar]
- 32.Bebelman MP, Smit MJ, Pegtel DM, Baglio SR. Biogenesis and function of extracellular vesicles in cancer. Pharmacol Ther. 2018;188:1–11. doi: 10.1016/j.pharmthera.2018.02.013. [DOI] [PubMed] [Google Scholar]
- 33.Whiteside TL. Tumor-Derived Exosomes and Their Role in Cancer Progression. Adv Clin Chem. 2016;74:103–141. doi: 10.1016/bs.acc.2015.12.005. [DOI] [PMC free article] [PubMed] [Google Scholar]
- 34.Cheng TY, Wu MS, Lin JT, Lin MT, Shun CT, Huang HY, Hua KT, Kuo ML. Annexin A1 is associated with gastric cancer survival and promotes gastric cancer cell invasiveness through the formyl peptide receptor/extracellular signal-regulated kinase/integrin beta-1-binding protein 1 pathway. Cancer. 2012;118:5757–5767. doi: 10.1002/cncr.27565. [DOI] [PubMed] [Google Scholar]
- 35.Yoshida K, Tsuda M, Matsumoto R, Semba S, Wang L, Sugino H, Tanino M, Kondo T, Tanabe K, Tanaka S. Exosomes containing ErbB2/CRK induce vascular growth in premetastatic niches and promote metastasis of bladder cancer. Cancer Sci. 2019;110:2119–2132. doi: 10.1111/cas.14080. [DOI] [PMC free article] [PubMed] [Google Scholar]
- 36.Hannafon BN, Gin AL, Xu YF, Bruns M, Calloway CL, Ding WQ. Metastasis-associated protein 1 (MTA1) is transferred by exosomes and contributes to the regulation of hypoxia and estrogen signaling in breast cancer cells. Cell Commun Signal. 2019;17:13. doi: 10.1186/s12964-019-0325-7. [DOI] [PMC free article] [PubMed] [Google Scholar]
- 37.Steinhaeuser SS, Morera E, Budkova Z, Schepsky A, Wang Q, Rolfsson O, Riedel A, Krueger A, Hilmarsdottir B, Maelandsmo GM, et al. ECM1 secreted by HER2-overexpressing breast cancer cells promotes formation of a vascular niche accelerating cancer cell migration and invasion. Lab Invest. 2020;100:928–944. doi: 10.1038/s41374-020-0415-6. [DOI] [PubMed] [Google Scholar]
- 38.Wei S, Peng L, Yang J, Sang H, Jin D, Li X, Chen M, Zhang W, Dang Y, Zhang G. Exosomal transfer of miR-15b-3p enhances tumorigenesis and malignant transformation through the DYNLT1/Caspase-3/Caspase-9 signaling pathway in gastric cancer. J Exp Clin Cancer Res. 2020;39:32. doi: 10.1186/s13046-019-1511-6. [DOI] [PMC free article] [PubMed] [Google Scholar]
- 39.Chen X, Zhou J, Li X, Wang X, Lin Y, Wang X. Exosomes derived from hypoxic epithelial ovarian cancer cells deliver microRNAs to macrophages and elicit a tumor-promoted phenotype. Cancer Lett. 2018;435:80–91. doi: 10.1016/j.canlet.2018.08.001. [DOI] [PubMed] [Google Scholar]
- 40.Peinado H, Alečković M, Lavotshkin S, Matei I, Costa-Silva B, Moreno-Bueno G, Hergueta-Redondo M, Williams C, García-Santos G, Ghajar C, et al. Melanoma exosomes educate bone marrow progenitor cells toward a pro-metastatic phenotype through MET. Nat Med. 2012;18:883–891. doi: 10.1038/nm.2753. [DOI] [PMC free article] [PubMed] [Google Scholar]
Associated Data
This section collects any data citations, data availability statements, or supplementary materials included in this article.
Supplementary Materials
Data Availability Statement
The datasets used and/or analyzed during the current study are available from the corresponding author on reasonable request.


