

Abstract
Background
T cell immunoglobulin and ITIM domain (TIGIT) is a recently identified immunosuppressive receptor. The expression levels of TIGIT affect the prognosis of patients with solid tumors. To fully comprehend the role of TIGIT on the prognosis of patients with solid tumors, we conducted a meta-analysis.
Methods
We performed an online search of PubMed, Embase, Web of Science (WOS), and MEDLINE databases for literature published till March 31, 2021. The Newcastle-Ottawa Scale (NOS) was used to evaluate the quality of the literature, and Stata 16.0 and Engauge Digitizer 4.1 software were used for data analysis.
Results
Our literature search identified eight papers comprising 1426 patients with solid tumors. Increased expression of TIGIT was associated with poor prognosis. High expression of TIGIT was a risk factor for overall survival (OS) {hazard ratio (HR) = 1.66, 95% confidence interval (CI) [1.26, 2.20], P < 0.001} and progression-free survival (PFS) (HR = 1.44, 95% CI [1.15, 1.81], P = 0.01). We performed subgroup analysis to explore the source of heterogeneity, colorectal cancer (HR = 2.07, 95% CI [0.23, 18.82], P = 0.518), lung cancer (HR = 1.29, 95% CI [0.96, 1.72], P = 0.094), esophageal cancer (HR = 1.70, 95% CI [1.20, 2.40], P = 0.003), and other cancers (HR = 1.83, 95% CI [1.25, 2.68], P = 0.002). In addition to cancer type, expression location, sample size, and different statistical analysis methods are also considered the possible causes of heterogeneity between studies. Funnel plots suggested no publication bias for OS (P = 0.902), and Egger's test supported this conclusion (P = 0.537).
Conclusion
TIGIT expression was associated with OS and PFS in patients with solid tumors. Patients with elevated TIGIT expression have a shorter OS and PFS, and TIGIT expression could be a novel biomarker for prognosis prediction and a valuable therapeutic target for solid tumors.
1. Introduction
The global burden of cancer morbidity and mortality is rapidly increasing. By 2020, there are estimated to be 19.29 million new cancer cases and 9.96 million deaths worldwide. It is expected that by 2040, the global burden of cancer will reach 28.4 million cases, an increase of 47% compared with that in 2020 [1]. In recent years, with deepening of the understanding of tumor molecular mechanisms, many tumor markers have been identified, which can be used for tumor diagnosis and prognosis judgement. Identification of new biomarkers with the potential to predict the progress and prognosis of cancer has brought new hope for cancer patients.
T cell immunoglobulin and ITIM domain (TIGIT), also known as WUCAM, Vstm3, and VSIG9, is a newly discovered coinhibitory receptor belonging to the poliovirus receptor/nectin family. TIGIT is primarily expressed in T cells and natural killer cells. Yu's group was the first to determine the unique structure of TIGIT and explore its function [2]. TIGIT is expressed in various levels in various T cell subsets. Abnormally expressed TIGIT suppresses immune cells in multiple steps of the tumor immune cycle and promotes tumor immune escape to a great extent [2–4]. Similar to the classical immune checkpoint of programmed cell death protein 1/programmed cell death ligand 1 (PD-1/PD-L1), cytotoxic T-lymphocyte-associated antigen 4 (CTLA-4)/B7.1/2 and CD226/TIGIT-CD155/CD112 are considered emerging pathways that precisely regulate T cell activation [5].
TIGIT is overexpressed in many solid tumors, including in liver cancer [6, 7], colorectal cancer (CRC) [8–10], breast cancer [11, 12], thyroid cancer [13], lung cancer [14–16], gastric cancer (GC) [17, 18], esophageal squamous cell carcinoma (ESCC) [19], and melanoma [20, 21]. Liang et al. discovered that TIGIT expression level in tumor tissue was correlated with CRC recurrence and survival [10]. TIGIT expression was considerably higher in advanced CRC than in early CRC. TIGIT expression is an independent prognostic factor for CRC and leads to a poor prognosis. However, other studies have shown that TIGIT expression is downregulated in the peripheral blood in advanced CRC, and there is no strong relationship between TIGIT expression and the overall survival (OS) rate of CRC [8, 9]. The prognosis prediction value of TIGIT for various cancers remains controversial. Therefore, we performed a meta-analysis to gain a better understanding of the impact of TIGIT on the prognosis of patients with solid cancer.
2. Methods
2.1. Search Strategies
We followed the Preferred Reporting Items for Systematic Reviews and Meta-Analyses (PRISMA) criteria. We searched PubMed, EMBASE, Web of Science (WOS), and MEDLINE databases for articles on the correlation between TIGIT expression and the prognosis of malignant tumors from the date of establishment of the database to March 31, 2021. The keywords used were “TIGIT,” “T-cell Ig and ITIM domain,” “WUCAM,” “Vstm3,” “VSIG9,” “carcinoma,” “tumor,” “neoplasia,” “neoplasm,” “cancer,” “malignancy,” “malignant neoplasm,” “prognostic,” “survival,” “prognosis,” “recurrence,” “outcome,” and “mortality.” Based on the characteristics of different databases, we conducted a comprehensive search of medical subject words (MeSH) combined with text words. The language of the restricted search was English.
2.2. Criteria for Inclusion and Exclusion
The inclusion criteria were as follows: (1) patients with solid tumors who underwent pathological testing to verify their diagnosis; (2) prospective or historical cohort studies; (3) immunohistochemistry (IHC) staining was used to determine TIGIT expression; (4) the cut-off value of TIGIT was reported; (5) correlation of TIGIT with survival indexes, such as OS, progression-free survival (PFS), disease-free survival (DFS), and relapse-free survival (RFS) was described; and (6) the hazard ratio (HR) and its 95% confidence interval (CI).
Exclusion criteria were as follows: (1) abstracts, reviews, case reports, letters, or nonclinical studies; (2) insufficient data for HR and 95% CI; (3) there were no studies published in English; and (4) duplicate data or analysis was identified in the studies.
2.3. Data Extraction and Quality Evaluation
Two independent authors (KMX and KLX) evaluated and extracted all candidate papers. In case of a dispute, the two authors consulted with a third author (KXL). The following details were extracted from the studies: first author, publication year, patient source, sample size, TIGIT positive rate, cancer type, detection method, expression location, cut-off value, statistical method, results, HR estimation method (univariate and multivariate analysis), and HR ratio. The required data were directly extracted or obtained from the survival curve using Engauge Digitizer 4.1 software to calculate the HR and 95% CI. Two independent authors (KMX and KLX) used Newcastle-Ottawa Scale (NOS) to determine the quality of the studies involved [22]. When the score was ≥6, the included literature was considered to be of high quality.
2.4. Statistical Methods
HR and 95% CI were pooled using Stata 16.0, to evaluate the impact of high and low TIGIT expression on the prognosis of patients with solid tumors. I2 is a quantitative statistic that reflects the percentage of interstudy variation in the overall variation [23]. According to the rule of thumb, for interpreting I2 statistics provided by the Cochrane Handbook [24], I2 ≥ 50% indicates substantial heterogeneity. The random-effects model was used when significant heterogeneity was observed; otherwise, a fixed-effects model was used. Subgroup and sensitivity analyses were used to investigate the origins of heterogeneity; Begg's and Egger's tests were used to determine publication bias. A 2-sided P < 0.05 was considered statistically significant.
3. Results
3.1. Study Selection
A total of 862 papers were initially identified. After removing duplicate literature and reading the title, abstract, and full text, according to the study's inclusion and exclusion requirements, eight papers were included [9, 10, 15–17, 19, 21, 25]. The process and results of the literature screening are presented in Figure 1.
Figure 1.
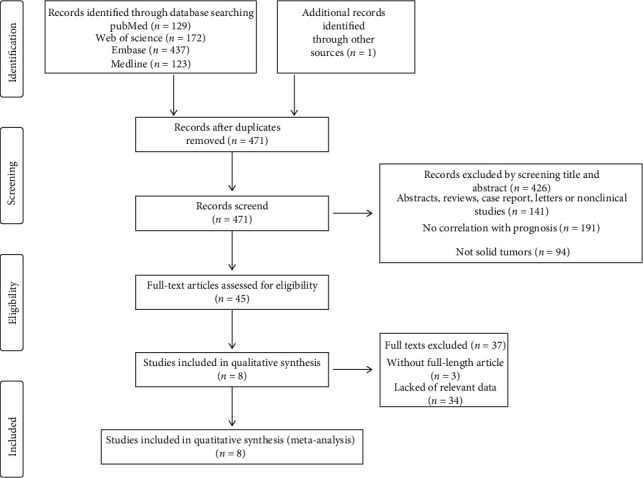
Literature screening process and results.
3.2. Study Characteristics
Table 1 shows the basic characteristics of the studies involved in this meta-analysis. Eight articles included in this meta-analysis were published from 2018 to 2021, involving 1426 patients. All studies used IHC to detect TIGIT expression levels, but the cut-off values were not identical. The study subjects were from China (n = 7) and South Korea (n = 1). Cancer types included melanoma, lung adenocarcinoma (LUAD), GC, small cell lung cancer (SCLC), ESCC, primary small cell carcinoma of the esophagus (PSCCE), and CRC. Five studies explicitly documented reported HRs and 95% CIs, while the other three studies calculated HR and 95% CI from the survival curves. All studies evaluated the correlation between TIGIT expression and OS in patients with solid tumors [9, 10, 15–17, 19, 21, 25], and three studies evaluated the relationship between TIGIT expression and PFS in patients with solid tumors [16, 21, 25]. Zhou et al. [9] and Liang et al. [10] reported the relationship between TIGIT expression and DFS and RFS, respectively. The NOS scores of all included articles were ≥6, and the scoring details are presented in Table S1.
Table 1.
Basic characteristics of included studies.
| Author | Year | Patient source | Sample size | TIGIT + | Cancer type | Method | Expression location | Cut-off value | Outcome | M/U | HR ratio | NOS |
|---|---|---|---|---|---|---|---|---|---|---|---|---|
| Zhao JJ | 2018 | Chinese | 154 | 76 (49.4%) | ESCC | IHC | TIL | Median level | OS | M | Reported | 8 |
| Tang W | 2019 | Chinese | 441 | 343 (77.8%) | GC | IHC | Tumor cell | >5% positivity cell | OS | M | Reported | 8 |
| Xu Y | 2019 | Chinese | 60 | 21 (35%) | SCLC | IHC | Tumor cell | Median level | OS | U | Survival curve | 6 |
| Lee WJ | 2020 | Korea | 124 | 52 (41.9%) | Melanoma | IHC | Tumor cell | ≥20% positivity cell | OS/PFS | U | Survival curve | 7 |
| Sun Y | 2020 | Chinese | 334 | 204 (61.1%) | LUAD | IHC | TIL | ≥5% positivity cell | OS/PFS | M | Reported/survival curve | 7 |
| Zhao K | 2020 | Chinese | 114 | 74 (64.9%) | PSCCE | IHC | Tumor cell | ≥5% positivity cell | OS/PFS | M | Reported/survival curve | 8 |
| Zhou X | 2020 | Chinese | 60 | 21 (35%) | CRC | IHC | Tumor cell | Score ≥ 1 | OS/DFS | M | Reported | 8 |
| Liang R | 2021 | Chinese | 139 | 40 (28.8%) | CRC | IHC | Tumor cell | Median level | OS/RFS | U | Survival curve | 6 |
OS: overall survival; PFS: progress-free survival; DFS: disease-free survival; RFS: recurrence-free survival; U: univariate; M: multivariate; TIL: tumor infiltrating lymphocyte; IHC: immunohistochemistry; LUAD: lung adenocarcinoma; GC: gastric cancer; SCLC: small cell lung cancer; ESCC: esophageal squamous cell carcinoma; PSCCE: primary small cell carcinoma of the esophagus; CRC: colorectal cancer.
3.3. Overall Survival
Eight studies provided sufficient data to investigate the connection between TIGIT expression and OS. The pooled results of the meta-analysis indicated that upregulation of TIGIT expression was correlated with worsening OS in patients with solid cancer (HR = 1.66, 95% CI [1.26, 2.20], P < 0.001). Heterogeneity across studies was I2 = 52.9%, P = 0.038; therefore, a random-effects model was used for analysis (as shown in Figure 2). Subgroup analysis was used to investigate the origin of heterogeneity. The heterogeneity of CRC (HR = 2.07, 95% CI [0.23, 18.82], P = 0.518) was as high as I2 = 91%, while lung cancer (HR = 1.29, 95% CI [0.96, 1.72], P = 0.094), esophageal cancer (HR = 1.70, 95% CI [1.20, 2.40], P = 0.003), and other cancers (HR = 1.83, 95% CI [1.25, 2.68], P = 0.002) did not show heterogeneity. The expression of TIGIT and TILs on tumor cells was significantly correlated with poor OS (tumor cells HR = 1.78, 95% CI [1.19–2.65], P = 0.005); tumor infiltrating lymphocytes (TILs) (HR = 1.41, 95% CI [1.09, 1.83], P = 0.009). Studies with sample sizes ≥100 showed a tendency to increase the risk of short OS (HR = 1.80, 95% CI [1.36, 2.39], P ≤ 0.001). Studies with sample sizes >100 showed the opposite trend (HR = 0.92, 95% CI [0.47, 1.78], P = 0.802); however, significant differences were not observed. In terms of methods for estimating HR, univariate analysis had a greater effect on prognosis than multivariate analysis (HR = 2.57, 95% CI [1.17, 5.67], P = 0.019 vs. HR = 1.49, 95% CI [1.24, 1.80], P ≤ 0.001) (Table 2).
Figure 2.
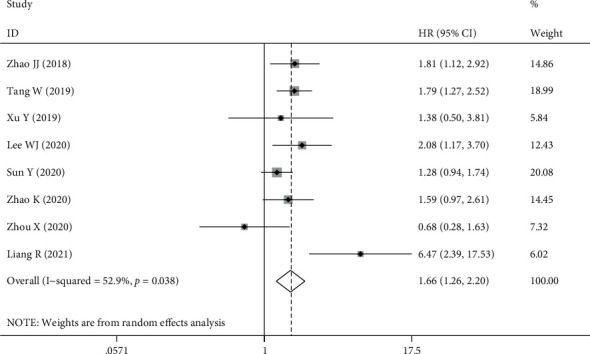
Forest plot for OS.
Table 2.
Subgroup analysis results.
| Random-effects model | Fixed-effects model | Heterogeneity | |||||
|---|---|---|---|---|---|---|---|
| Analysis | N | HR (95% CI) | P | HR (95% CI) | P | I 2 | pH |
| Cancer type | |||||||
| Colorectal cancer | 2 | 2.07 (0.23, 18.82) | 0.518 | 1.81 (0.94, 3.50) | 0.076 | 91.0% | 0.001 |
| Lung cancer | 2 | 1.29 (0.96, 1.72) | 0.094 | 1.29 (0.96, 1.72) | 0.094 | 0.0% | 0.886 |
| Esophagus cancer | 2 | 1.70 (1.20, 2.40) | 0.030 | 1.70 (1.20, 2.40) | 0.003 | 0.0% | 0.715 |
| Others | 2 | 1.86 (1.39, 2.50) | 0.001 | 1.86 (1.39, 2.50) | 0.001 | 0.0% | 0.662 |
| Expression position | |||||||
| Tumor cells | 6 | 1.78 (1.19, 2.65) | 0.005 | 1.77 (1.40, 2.22) | 0.001 | 57.7% | 0.037 |
| TILs | 2 | 1.44 (1.04, 2.00) | 0.027 | 1.41 (1.09, 1.83) | 0.009 | 30.2% | 0.231 |
| Sample size | |||||||
| <100 | 2 | 0.92 (0.46, 1.83) | 0.817 | 0.92 (0.47, 1.78) | 0.802 | 6.5% | 0.301 |
| ≥100 | 6 | 1.80 (1.36, 2.39) | 0.001 | 1.67 (1.40, 1.99) | 0.001 | 54.1% | 0.054 |
| Method to estimate HR | |||||||
| Multivariate analysis | 5 | 1.49 (1.17, 1.88) | 0.001 | 1.49 (1.24, 1.80) | 0.001 | 31.9% | 0.209 |
| Univariate analysis | 3 | 2.57 (1.17, 5.67) | 0.019 | 2.42 (1.54, 3.78) | 0.001 | 61.4% | 0.075 |
3.4. Progression-Free Survival
Three studies involving 572 patients reported an association between TIGIT expression and PFS in patients with solid tumors, and Lee WJ analysis showed that patients with high TIGIT expression had considerably worse PFS than patients with low TIGIT expression (59.0 months vs. 32.0 months, P = 0.01); however, HR values and Kaplan-Meier curves were not provided; therefore, a meta-analysis could not be conducted. The fixed-effects model was used in this analysis because there was no significant heterogeneity between the studies (I2 = 0.0%, P = 0.583). The results showed that high expression of TIGIT was a risk factor for poor PFS (HR = 1.44, 95% CI [1.15, 1.81], P = 0.01). As DFS and RFS were documented in only one related article, they were not sufficient for a meta-analysis (Figure 3).
Figure 3.
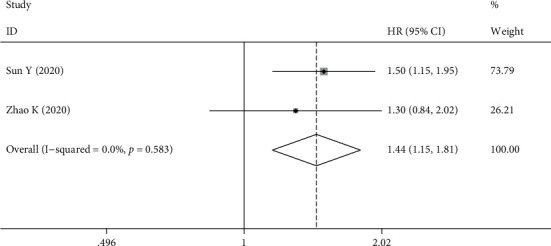
Forest plot for PFS.
3.5. Sensitivity Analysis
Sensitivity analysis eliminated each study individually, and then, a combined analysis was conducted for the remaining studies. The results showed that the combined effect value before and after the elimination of any study had no significant change, suggesting that the results of this study were stable (as shown in Figure 4).
Figure 4.
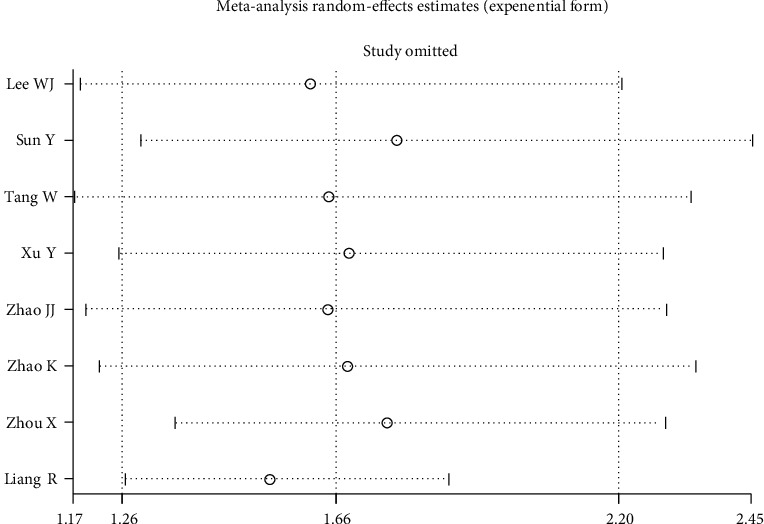
Consequence of sensitivity analysis.
3.6. Publication Bias
Begg's and Egger's methods were used to assess the publication bias. The funnel plot revealed no major asymmetry (P = 0.902; Figure 5(a)). Furthermore, Egger's test supported this conclusion (P = 0.537; Figure 5(b)). Therefore, our meta-analysis did not reveal any publication bias.
Figure 5.
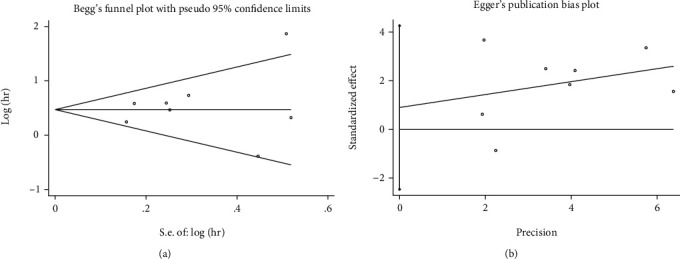
Result of publication bias. (a) Begg's test; (b) Egger's test.
4. Discussion
TIGIT is a fairly new immunosuppressive receptor, discovered 11 years ago. In recent years, TIGIT expression has been shown to have prognostic significance in patients with solid tumors in a variety of trials, but its role has been inconsistent and unclear. Therefore, we reviewed published studies and performed a meta-analysis. Our present meta-analysis may be the only study to date evaluating the association between TIGIT expression and OS in patients with solid tumors.
Our meta-analysis included 1430 patients with solid tumors from eight studies. The results showed that increased expression of TIGIT was associated with a poor prognosis. High expression of TIGIT was a risk factor for OS (HR = 1.66, 95% CI [1.26, 2.20], P < 0.001) and PFS (HR = 1.44, 95% CI [1.15, 1.81], P = 0.01). In addition, we found that the cancer type, expression location, sample sizes, and different statistical analysis methods are possible reasons for the heterogeneity between studies. Our results emphasize the prognostic value of TIGIT expression in patients with solid tumors.
The immune checkpoint is one of the main causes of immune tolerance. Immunotherapy targeting the classical immune checkpoints of PD-1/PD-L1 and CTLA-4/B7.1/2 has brought hope to patients with tumors. However, in actual clinical applications, only a part of the dominant population has an immune response, and PD-1/PD-L1 immune checkpoint inhibitors are prone to drug resistance and severe adverse effects [26, 27]. Therefore, there is an urgent need to identify new immune checkpoints to compensate for low response rates, drug resistance, and severe adverse reactions, such as lymphocyte activation gene 3 (LAG-3) [28], T cell immunoglobulin-3 (TIM-3) [29], and TIGIT, which can negatively regulate T cell activation and function and induce T cell exhaustion; however, they each have unique signaling pathways and regulatory functions, so their clinical applications are different [30]. Compared with those on LAG-3 and TIM-3, studies on TIGIT expression provided more encouraging results [31]. TIGIT has a higher positive rate in TILs than does PD-1 [19], and TIGIT inhibitors can transduce CD155-mediated signals to CD226 activation, thus improving immunotherapy, which is advantageous [20]. In CITYSCAPE, a phase II clinical trial, 135 patients with PD-L1 positive non-small-cell lung cancer were randomized to receive the TIGIT inhibitor tiragolumab in combination with a PD-L1 inhibitor or PD-L1 inhibitor alone. The results showed that addition of tiragolumab significantly improved patient outcomes, with the objective response rate increasing from 21% to 37% and the median PFS increasing from 3.9 months to 5.6 months without an increase in adverse events. In particular, the objective response rate of patients with high PD-L1 expression (>50%) increased from 24% to 66% after the addition of tiragolumab [32]. In addition to the combination of PD-1/PD-L1 inhibitors, the combination of TIGIT antibody and other immune checkpoint inhibitors can also produce synergistic effects and improve the efficacy of immunotherapy [33].
TIGIT affects the prognosis of cancer patients by inhibiting the function of immune cells through a variety of mechanisms [34]. These are as follows: (1) TIGIT binds to CD155 and causes T cells to send a direct inhibition signal, inducing immune tolerance [35]; (2) TIGIT stimulates the immune response indirectly by activating CD155 on DCs, increasing IL-10 secretion while decreasing IL-12 secretion [2]; (3) TIGIT not only competes with the CD226 ligand but also binds directly to CD226 and disrupts its homodimerization, thereby disrupting its costimulatory effect and preventing CD226-mediated T cell activation [4]; (4) TIGIT signaling in regulatory T cells (Tregs) affects the secretion of cytokines and suppresses proinflammatory Th1 and Th17 T cell responses [36], which enhances the immunosuppressive function and stability of Tregs.
We showed an association between TIGIT expression and the prognosis of patients with solid tumors, but the prognostic effects of TIGIT on different tumors were inconsistent, which may be due to different characteristics and different expression sites of different tumors. Significant heterogeneity was observed in the two CRC studies, which could be explained by study's methodological design and confounders of clinical covariates. PFS, DFS, and RFS can all predict and reflect clinical benefits, but there are few relevant studies reported at present, and it is impossible to measure the combined HR. Many studies are needed to evaluate the prognostic value of TIGIT.
Although we tried our best to conduct a comprehensive analysis, our meta-analysis has certain limitations. Despite the use of subgroup and sensitivity analyses, the origin of the heterogeneity could not be completely traced. Second, all the studies were retrospective, with all subjects being Asian, which does not represent the whole population. Third, the scale of the included studies was small. Some studies include only one kind of cancer, and studies with a larger sample size are required to fully understand the connection between TIGIT and the survival index. Third, although IHC was used in all the studies, the antibodies used were no identical, and the thresholds were not consistent. We should further explore the establishment of a unified threshold. Fourth, the number of studies included in this article was very limited. When the number of included articles is less than 10, the efficiency of Begg's test and Egger's test detection tend to reduce, and as this study included English language articles, publication bias cannot be ruled out. We hope that this meta-analysis not only represents the end point of the study but also begins to pay attention to the value of TIGIT in solid tumors and to look forward to more high-quality studies.
5. Conclusion
Taken together, our findings indicate a significantly increased risk of OS and PFS associated with elevated TIGIT expression. TIGIT appears to be a promising therapeutic target for solid tumors as well as a prognostic predictor, which deserves the attention of researchers and clinicians. Due to the limitations of the number and quality of the included literature, our results need to be interpreted carefully. Further studies are necessary to evaluate the molecular mechanism of TIGIT in patients with solid tumors.
Acknowledgments
This work was supported by the China National Natural Science Foundation (grant no. 81973640). KMX was sponsored by the China Scholarship Council (no. 202106550003).
Contributor Information
Peng Xue, Email: xuepeng6399@163.com.
Shijie Zhu, Email: 20180941234@bucm.edu.cn.
Data Availability
No new data generated.
Ethical Approval
Ethics approval was received by each involved study in this meta-analysis.
Conflicts of Interest
The authors declare that they have no conflict of interest.
Authors' Contributions
KMX and KLX shared first authors, performed the experiments, and analyzed the data. PX and SJZ contributed equally and conceived and designed the experiments. KMX wrote the manuscript. KXL contributed analysis tools. All authors read and approved the final manuscript prior to submission. KMX and KLX contributed equally to this work, and PX and SJZ shared corresponding authors.
Supplementary Materials
Table S1: Newcastle-Ottawa Scale for assessing the quality of studies in meta-analysis.
References
- 1.Sung H., Ferlay J., Siegel R. L., et al. Global cancer statistics 2020: GLOBOCAN estimates of incidence and mortality worldwide for 36 cancers in 185 countries. CA: a Cancer Journal for Clinicians . 2021;71(3):209–249. doi: 10.3322/caac.21660. [DOI] [PubMed] [Google Scholar]
- 2.Yu X., Harden K., C Gonzalez L., et al. The surface protein TIGIT suppresses T cell activation by promoting the generation of mature immunoregulatory dendritic cells. Nature Immunology . 2009;10(1):48–57. doi: 10.1038/ni.1674. [DOI] [PubMed] [Google Scholar]
- 3.Johnston R. J., Comps-Agrar L., Hackney J., et al. The immunoreceptor TIGIT regulates antitumor and antiviral CD8+ T cell effector function. Cancer Cell . 2014;26(6):923–937. doi: 10.1016/j.ccell.2014.10.018. [DOI] [PubMed] [Google Scholar]
- 4.Lozano E., Dominguez-Villar M., Kuchroo V., Hafler D. A. The TIGIT/CD226 axis regulates human T cell function. Journal of Immunology . 2012;188(8):3869–3875. doi: 10.4049/jimmunol.1103627. [DOI] [PMC free article] [PubMed] [Google Scholar]
- 5.Tahara-Hanaoka S., Shibuya K., Onoda Y., et al. Functional characterization of DNAM-1 (CD226) interaction with its ligands PVR (CD155) and nectin-2 (PRR-2/CD112) International Immunology . 2004;16(4):533–538. doi: 10.1093/intimm/dxh059. [DOI] [PubMed] [Google Scholar]
- 6.Duan X., Liu J., Cui J., et al. Expression of TIGIT/CD155 and correlations with clinical pathological features in human hepatocellular carcinoma. Molecular Medicine Reports . 2019;20(4):3773–3781. doi: 10.3892/mmr.2019.10641. [DOI] [PMC free article] [PubMed] [Google Scholar]
- 7.Liu X., Li M., Wang X., et al. PD-1+ TIGIT+ CD8+ T cells are associated with pathogenesis and progression of patients with hepatitis B virus-related hepatocellular carcinoma. Cancer Immunology, Immunotherapy . 2019;68(12):2041–2054. doi: 10.1007/s00262-019-02426-5. [DOI] [PMC free article] [PubMed] [Google Scholar]
- 8.Ma B., Duan X., Zhou Q., et al. Use of aspirin in the prevention of colorectal cancer through TIGIT-CD155 pathway. Journal of Cellular and Molecular Medicine . 2019;23(7):4514–4522. doi: 10.1111/jcmm.14332. [DOI] [PMC free article] [PubMed] [Google Scholar]
- 9.Zhou X., Ding X., Li H., et al. Upregulation of TIGIT and PD-1 in colorectal cancer with mismatch-repair deficiency. Immunological Investigations . 2021;50(4):338–355. doi: 10.1080/08820139.2020.1758130. [DOI] [PubMed] [Google Scholar]
- 10.Liang R., Zhu X., Lan T., et al. TIGIT promotes CD8+ T cells exhaustion and predicts poor prognosis of colorectal cancer. Cancer Immunology, Immunotherapy . 2021;70(10):2781–2793. doi: 10.1007/s00262-021-02886-8. [DOI] [PMC free article] [PubMed] [Google Scholar]
- 11.Fang J., Chen F., Liu D., Gu F., Chen Z., Wang Y. Prognostic value of immune checkpoint molecules in breast cancer. Bioscience Reports . 2020;40(7) doi: 10.1042/BSR20201054. [DOI] [PMC free article] [PubMed] [Google Scholar]
- 12.Xie X., Zhang J., Shi Z., et al. The expression pattern and clinical significance of the immune checkpoint regulator VISTA in human breast cancer. Frontiers in Immunology . 2020;11, article 563044 doi: 10.3389/fimmu.2020.563044. [DOI] [PMC free article] [PubMed] [Google Scholar]
- 13.Shi X., Li C. W., Tan L. C., et al. Immune co-inhibitory receptors PD-1, CTLA-4, TIM-3, LAG-3, and TIGIT in medullary thyroid cancers: a large cohort study. The Journal of Clinical Endocrinology and Metabolism . 2021;106(1):120–132. doi: 10.1210/clinem/dgaa701. [DOI] [PubMed] [Google Scholar]
- 14.Hu F., Wang W., Fang C., Bai C. TIGIT presents earlier expression dynamic than PD-1 in activated CD8+ T cells and is upregulated in non-small cell lung cancer patients. Experimental Cell Research . 2020;396(1, article 112260) doi: 10.1016/j.yexcr.2020.112260. [DOI] [PubMed] [Google Scholar]
- 15.Xu Y., Cui G., Jiang Z., Li N., Zhang X. Survival analysis with regard to PD-L1 and CD155 expression in human small cell lung cancer and a comparison with associated receptors. Oncology Letters . 2019;17(3):2960–2968. doi: 10.3892/ol.2019.9910. [DOI] [PMC free article] [PubMed] [Google Scholar]
- 16.Sun Y., Luo J., Chen Y., et al. Combined evaluation of the expression status of CD155 and TIGIT plays an important role in the prognosis of LUAD (lung adenocarcinoma) International Immunopharmacology . 2020;80, article 106198 doi: 10.1016/j.intimp.2020.106198. [DOI] [PubMed] [Google Scholar]
- 17.Tang W., Pan X., Han D., et al. Clinical significance of CD8+ T cell immunoreceptor with Ig and ITIM domains+ in locally advanced gastric cancer treated with SOX regimen after D2 gastrectomy. Oncoimmunology . 2019;8(6, article e1593807) doi: 10.1080/2162402X.2019.1593807. [DOI] [PMC free article] [PubMed] [Google Scholar]
- 18.He W., Zhang H., Han F., et al. CD155T/TIGIT signaling regulates CD8+ T-cell metabolism and promotes tumor progression in human gastric cancer. Cancer Research . 2017;77(22):6375–6388. doi: 10.1158/0008-5472.CAN-17-0381. [DOI] [PubMed] [Google Scholar]
- 19.Zhao J. J., Zhou Z. Q., Wang P., et al. Orchestration of immune checkpoints in tumor immune contexture and their prognostic significance in esophageal squamous cell carcinoma. Cancer Management and Research . 2018;10:6457–6468. doi: 10.2147/CMAR.S181949. [DOI] [PMC free article] [PubMed] [Google Scholar]
- 20.Chauvin J. M., Pagliano O., Fourcade J., et al. TIGIT and PD-1 impair tumor antigen-specific CD8+ T cells in melanoma patients. The Journal of Clinical Investigation . 2015;125(5):2046–2058. doi: 10.1172/JCI80445. [DOI] [PMC free article] [PubMed] [Google Scholar]
- 21.Lee W. J., Lee Y. J., Choi M. E., et al. Expression of lymphocyte-activating gene 3 and T-cell immunoreceptor with immunoglobulin and ITIM domains in cutaneous melanoma and their correlation with programmed cell death 1 expression in tumor-infiltrating lymphocytes. Journal of the American Academy of Dermatology . 2019;81(1):219–227. doi: 10.1016/j.jaad.2019.03.012. [DOI] [PubMed] [Google Scholar]
- 22.Stang A. Critical evaluation of the Newcastle-Ottawa scale for the assessment of the quality of nonrandomized studies in meta-analyses. European Journal of Epidemiology . 2010;25(9):603–605. doi: 10.1007/s10654-010-9491-z. [DOI] [PubMed] [Google Scholar]
- 23.Higgins J. P., Thompson S. G. Quantifying heterogeneity in a meta-analysis. Statistics in Medicine . 2002;21(11):1539–1558. doi: 10.1002/sim.1186. [DOI] [PubMed] [Google Scholar]
- 24.Higgins J. P., Thomas J., Chandler J., et al. Cochrane Handbook for Systematic Reviews of Interventions Version 6.2 (Updated February 2021) John Wiley & Sons; 2021. [Google Scholar]
- 25.Zhao K., Ma L., Feng L., Huang Z., Meng X., Yu J. CD155 overexpression correlates with poor prognosis in primary small cell carcinoma of the esophagus. Frontiers in Molecular Biosciences . 2021;7, article 608404 doi: 10.3389/fmolb.2020.608404. [DOI] [PMC free article] [PubMed] [Google Scholar]
- 26.El Osta B., Hu F., Sadek R., Chintalapally R., Tang S. C. Not all immune-checkpoint inhibitors are created equal: meta-analysis and systematic review of immune-related adverse events in cancer trials. Critical Reviews in Oncology/Hematology . 2017;119:1–12. doi: 10.1016/j.critrevonc.2017.09.002. [DOI] [PubMed] [Google Scholar]
- 27.Postow M. A., Sidlow R., Hellmann M. D. Immune-related adverse events associated with immune checkpoint blockade. The New England Journal of Medicine . 2018;378(2):158–168. doi: 10.1056/NEJMra1703481. [DOI] [PubMed] [Google Scholar]
- 28.Ruffo E., Wu R. C., Bruno T. C., Workman C. J., Vignali D. A. A. Lymphocyte-activation gene 3 (LAG3): the next immune checkpoint receptor. Seminars in Immunology . 2019;42, article 101305 doi: 10.1016/j.smim.2019.101305. [DOI] [PMC free article] [PubMed] [Google Scholar]
- 29.Solinas C., De Silva P., Bron D., Willard-Gallo K., Sangiolo D. Significance of TIM3 expression in cancer: from biology to the clinic. Seminars in Oncology . 2019;46(4-5):372–379. doi: 10.1053/j.seminoncol.2019.08.005. [DOI] [PubMed] [Google Scholar]
- 30.Anderson A. C., Joller N., Kuchroo V. K. Lag-3, Tim-3, and TIGIT: co-inhibitory receptors with specialized functions in immune regulation. Immunity . 2016;44(5):989–1004. doi: 10.1016/j.immuni.2016.05.001. [DOI] [PMC free article] [PubMed] [Google Scholar]
- 31.Ge Z., Peppelenbosch M. P., Sprengers D., Kwekkeboom J. TIGIT, the next step towards successful combination immune checkpoint therapy in cancer. Frontiers in Immunology . 2021;12, article 699895 doi: 10.3389/fimmu.2021.699895. [DOI] [PMC free article] [PubMed] [Google Scholar]
- 32.Rodriguez-Abreu D., Johnson M. L., Hussein M. A., et al. Primary analysis of a randomized, double-blind, phase II study of the anti-TIGIT antibody tiragolumab (tira) plus atezolizumab (atezo) versus placebo plus atezo as first-line (1L) treatment in patients with PD-L1-selected NSCLC (CITYSCAPE) Journal of Clinical Oncology . 2020;38(15 supplement):p. 9503. doi: 10.1200/JCO.2020.38.15_suppl.9503. [DOI] [Google Scholar]
- 33.Kurtulus S., Sakuishi K., Ngiow S. F., et al. TIGIT predominantly regulates the immune response via regulatory T cells. The Journal of Clinical Investigation . 2015;125(11):4053–4062. doi: 10.1172/JCI81187. [DOI] [PMC free article] [PubMed] [Google Scholar] [Retracted]
- 34.Chauvin J. M., Zarour H. M. TIGIT in cancer immunotherapy. Journal for Immunotherapy of Cancer . 2020;8(2):p. e000957. doi: 10.1136/jitc-2020-000957. [DOI] [PMC free article] [PubMed] [Google Scholar]
- 35.Levin S. D., Taft D. W., Brandt C. S., et al. Vstm3 is a member of the CD28 family and an important modulator of T-cell function. European Journal of Immunology . 2011;41(4):902–915. doi: 10.1002/eji.201041136. [DOI] [PMC free article] [PubMed] [Google Scholar]
- 36.Joller N., Lozano E., Burkett P. R., et al. Treg cells expressing the coinhibitory molecule TIGIT selectively inhibit proinflammatory Th1 and Th17 cell responses. Immunity . 2014;40(4):569–581. doi: 10.1016/j.immuni.2014.02.012. [DOI] [PMC free article] [PubMed] [Google Scholar]
Associated Data
This section collects any data citations, data availability statements, or supplementary materials included in this article.
Supplementary Materials
Table S1: Newcastle-Ottawa Scale for assessing the quality of studies in meta-analysis.
Data Availability Statement
No new data generated.