

Abstract
Motivation
B-cell epitopes (BCEs) play a pivotal role in the development of peptide vaccines, immuno-diagnostic reagents and antibody production, and thus in infectious disease prevention and diagnostics in general. Experimental methods used to determine BCEs are costly and time-consuming. Therefore, it is essential to develop computational methods for the rapid identification of BCEs. Although several computational methods have been developed for this task, generalizability is still a major concern, where cross-testing of the classifiers trained and tested on different datasets has revealed accuracies of 51–53%.
Results
We describe a new method called EpitopeVec, which uses a combination of residue properties, modified antigenicity scales, and protein language model-based representations (protein vectors) as features of peptides for linear BCE predictions. Extensive benchmarking of EpitopeVec and other state-of-the-art methods for linear BCE prediction on several large and small datasets, as well as cross-testing, demonstrated an improvement in the performance of EpitopeVec over other methods in terms of accuracy and area under the curve. As the predictive performance depended on the species origin of the respective antigens (viral, bacterial and eukaryotic), we also trained our method on a large viral dataset to create a dedicated linear viral BCE predictor with improved cross-testing performance.
Availability and implementation
The software is available at https://github.com/hzi-bifo/epitope-prediction.
Supplementary information
Supplementary data are available at Bioinformatics online.
1 Introduction
Antibodies are critical components of the humoral immune response that recognize and bind to the antigens of pathogens, such as bacteria or viruses (Janeway, 2012). The region of an antigen recognized by these antibodies is known as an epitope and it can either be a continuous stretch of amino acids within an antigen protein sequence (linear epitope) or amino acids potentially separated in the sequence but located closely in the 3D protein structure (conformational epitope). In particular, the identification of B-cell epitopes (BCEs) is important for applications, such as peptide-based vaccine design (Dudek et al., 2010), immuno-diagnostic tests (Noya et al., 2005) and synthetic antibody production (Hancock and O’Reilly, 2005). As the experimental determination of BCEs is time-consuming and expensive, computational prediction can play a pivotal role in the development of new vaccines and drugs against common viral pathogens such as human immunodeficiency virus, hepatitis or influenza viruses (Bryson et al., 2010; Dudek et al., 2010; Pellequer et al., 1991; Sanchez-Trincado et al., 2017). Although the majority of naturally occurring BCEs are conformational (Barlow et al., 1986), the prediction of linear BCEs has received much attention (Flower, 2007), as they are used for the synthesis of peptide-based vaccines among others (Malonis et al., 2020; Soria-Guerra et al., 2015).
The earliest methods for epitope prediction evaluated only one physiochemical property of the constituent amino acids, such as surface accessibility (Emini et al., 1985), flexibility (Karplus and Schulz, 1985), hydrophobicity (Levitt, 1976), or antigenicity (Kolaskar and Tongaonkar, 1990). Some of these methods that are still accessible online include PREDITOP (Pellequer and Westhof, 1993), PEOPLE (Alix, 1999) and BEPITOPE (Odorico and Pellequer, 2003). These algorithms calculate the average amino acid propensity scale for individual features over a sliding window along the query protein sequence. If these predicted scales are above a certain cut-off for a continuous stretch of the protein, then the respective region on the sequence is determined to be a linear BCE. However, an assessment of 484 propensity scales revealed that such scales are unreliable for detecting BCEs and barely outperformed random BCE selection when based on a single amino acid feature or even a combination of features (Blythe and Flower, 2005).
With the increased availability of experimentally identified epitopes, new methods have been based on several propensity scales and included additional amino acid features that had not been included before (Yang and Yu, 2009). Such methods, which use machine-learning (ML) approaches to distinguish BCEs from non-BCEs in the amino acid sequence, have shown better accuracy than single propensity scale-based methods. For training the ML model, BCEs are presented as feature vectors derived from different amino acid properties, such as the amino acid composition (AAC), the amino acid pair (AAP) antigenicity scale (Chen et al., 2007) or the amino acid trimer (AAT) antigenicity scale (Yao et al., 2012). Some examples of ML-based methods for BCE prediction are BepiPred (Larsen et al., 2006), ABCPred (Saha and Raghava, 2006), LBTope (Singh et al., 2013), AAP (Chen et al., 2007), APCPred (Shen et al., 2015), BCPreds (El-Manzalawy et al., 2008), Cobe-Pro (Sweredoski and Baldi, 2009), SVMTrip (Yao et al., 2012), iBCE-El (Manavalan et al., 2018), BepiPred 2.0 (Jespersen et al., 2017), DLBEpitope (Liu et al., 2020) and EpiDope (Collatz et al., 2021) . A notable issue seems to be that all the aforementioned methods lack high accuracy in a cross-testing approach, where ML training and testing are performed on independent datasets, which raises doubts about the generalizability of all such approaches (Galanis et al., 2021; Sun et al., 2018).
1.1 Contributions
Here, we describe a new method that combines commonly used propensity scales, residue features and modified antigenicity scales with ProtVec (Asgari, 2019; Asgari and Mofrad, 2015; Asgari et al., 2019b) for vector representation of the peptides instead of the commonly used one-hot encoding method. Notably, EpiDope, a recently published study, also makes use of protein embeddings, but it uses context-aware embeddings for each residue in the sequence by using a vector with a length of 1000, whereas ProtVec embeddings are context-independent and encode the entire sequence by using a vector with a length of 300. Previously, sequence-based embeddings have been used successfully in functional-structural protein annotation tasks, such as predictions of secondary structures (Asgari et al., 2019a; Li and Yu, 2016), the effects of mutations on protein–protein interactions (Zhou et al., 2020), protein functions (Asgari and Mofrad, 2015; Bonetta and Valentino, 2020; Zhou et al., 2019) and structural motifs (Liu et al., 2018). We used a support vector machine (SVM) with a Radial Basis Function (RBF) kernel as our predictive model. We trained and tested our method on multiple small and large datasets derived from the Bcipep (Saha et al., 2005) and Immune Epitope Database (IEDB) (Vita et al., 2010) and compared its performance with the state-of-the-art methods. We also cross-tested some of the methods (BepiPred, iBCE-EL, BepiPred2.0, DLBEpitope and EpiDope) on datasets on which they had not been tested before to verify the reliability and generalizability of these approaches. To establish a fair comparison, we trained our method on the same datasets on which the original methods were trained and tested the performance on the same test sets that the original methods used. Lastly, we trained our method on a large viral dataset in order to construct a predictor for linear viral BCEs as a resource available for the community.
2 Materials and methods
2.1 Datasets
Most of the methods published in the literature were trained on datasets compiled from databases of experimentally verified epitopes, such as Bcipep or IEDB. Earlier methods, such as ABCPred, BCPreds and AAP, were trained on datasets compiled from the Bcipep database. More recent methods, such as LBTope, SVMTrip, iBCE-El, BepiPred 2.0, DLBEpitope and EpiDope, were trained on datasets compiled from the IEDB. We compiled a list of benchmarking datasets and compared our method with the previously published studies using these datasets for a fair and comprehensive comparison (Table 1 and Supplementary Section 1).
Table 1.
Summary of the datasets used in the benchmarking of our approach
| Dataset | Original method | Epitopes | Non- epitopes | Source | Length |
|---|---|---|---|---|---|
| BCPreds | BCPreds | 701 | 701 | Bcipep | 20 |
| ABCPred16 | ABCPred | 700 | 700 | Bcipep | 16 |
| Chen | AAP | 872 | 872 | Bcipep | 20 |
| Blind387 | ABCPred | 187 | 200 | Various | Not fixed |
| LBTope_fixed_nr | LBTope | 7824 | 7853 | IEDB | 20 |
| iBCE-EL training | iBCE-EL | 4440 | 5485 | IEDB | Not fixed |
| iBCE-EL ind. | iBCE-EL | 1110 | 1408 | IEDB | Not fixed |
| Viral | New | 4432 | 8460 | IEDB | Not fixed |
Note: The datasets are available at https://github.com/hzi-bifo/epitope-prediction-paper.
2.1.1. Viral dataset
We downloaded viral peptides from the IEDB in which peptides were reported as epitopes (positive) and non-epitopes (negative). The peptide length was not fixed and it varied from 6 to 46 amino acids. We used CD-HIT (Huang et al., 2010) to remove homologous peptide sequences (cut-off: 80% for positive and 90% for negative sequences) in the dataset. As the same peptide can be reported to be an epitope and a non-epitope in different neutralization experiments, we removed the peptides that were common in both sets to finally obtain a dataset of 4432 peptides that were epitopes (positive) and 8460 peptides that were non-epitopes (negative).
2.2 Feature representation of peptides
2.2.1. Amino acid composition
The AAC is represented by a vector specifying the relative abundance of each amino acid in the peptide. It can be formulated as:
| (1) |
where is the percentage comprised by amino acid type i, Ri is the count of type i in the peptide and N is the peptide length.
2.2.2. Dipeptide composition
Dipeptide composition (DPC) is represented by a vector specifying the abundance of dipeptides normalized by all possible dipeptide combinations for a peptide P. It has a fixed length of 400 (20 × 20) features. It can be formulated as:
| (2) |
where is the percentage of composition of dipeptide type i, Ri is the count of type i in the peptide and N is the peptide length.
2.2.3. AAP antigenicity scale
The AAP antigenicity scale was introduced by Chen et al. (2007). It is the ratio of how frequently AAPs occur in the positive set compared with the negative set. The antigenicity value for each dipeptide is the logarithm of the frequency in the positive set divided by the frequency in the negative set. We normalized the scale between +1 and −1 to avoid the dominance of an individual propensity value. For the positive set, we used the Bcipep dataset; for the negative dataset, we chose the entire UniProt50 database from Swiss-Prot (Bairoch, 2000), which contains 561 908 protein sequences:
| (3) |
2.2.4. AAT antigenicity scale
The AAT antigenicity scale was first introduced in SVMTrip (Yao et al., 2012). It is similar to the AAP scale, except that it uses amino acid triplets instead of AAPs. The AAT scale is the logarithm of the ratio of the frequency of amino acid triplets in the positive set to their frequency in the negative set. The scale is normalized between +1 and −1, similar to the AAP scale:
| (4) |
2.2.5. K-mer representation
Segmentation of biological sequences into a bag of overlapping fixed-length k-mers is one of the most common representations in bioinformatics research. K-mer representations are widely used in the areas of proteomics (Grabherr et al., 2011), genomics (Alipanahi et al., 2015; Jolma et al., 2013), epigenomics (Awazu, 2017; Giancarlo et al., 2015) and metagenomics (Asgari et al., 2018; Wood and Salzberg, 2014). To create a k-mer representation of a given protein sequence, the sequences are divided into overlapping subsequences of length k (k-mers). Subsequently, they are represented as a frequency vector of all possible amino acid k-mers (, where 20 is the number of amino acids).
2.2.6. ProtVec sequence embeddings
Recently, in natural language processing (NLP), continuous vector representations of words known as word embeddings have become a very popular approach for word representations in downstream ML tasks. The general idea is to learn a vector representation of words in the course of neural probabilistic language modeling, and then use the learned representation as a general-purpose representation of words in any NLP task. Language modeling is the task of assigning a probability to a given sequence of words or predicting the next word, given the previous words. There are two main reasons for choosing language model-based representations: (i) language modeling is unsupervised and information or metadata other than the raw sentences are not needed, which lets us leverage a large amount of available text on the web for training a powerful representation and (ii) language modeling is a general-purpose task, so a representation that is relevant to language modeling is also relevant for syntactic and semantic similarities, helping machines in NLP tasks (e.g. machine translation, parsing, part-of-speech tagging or information retrieval).
Inspired by this idea, in a previous work, we proposed distributed vector representations of biological sequence segments instead of k-mers, namely bio-vector for general use, and ProtVec for proteins. We used the skip-gram neural network for this purpose. Skip-gram is a neural network with an objective analogous to a language modeling task (Bojanowski et al., 2016; Mikolov et al., 2013). However, instead of predicting the next word (or next k-mer) from the previous words, the task is to predict the surrounding words for a given word. We use large protein sequence databases (e.g. Swiss-Prot) without any metadata for training a general-purpose representation of protein k-mers. The objective of the skip-gram neural network is to maximize the log-likelihood of observing the contexts of k-mers in a window of N around it:
| (5) |
where wt is the current k-mer and c indicates the indices around index t in the window size of N. contains all existing k-mer contexts in the training data (e.g. all k-mer contexts that exist in Swiss-Prot for all possible 3-mers). This likelihood is parameterized by k-mer representations (vt) and k-mer context representation (vc) in the skip-gram neural network:
| (6) |
Since including all existing contexts in the above-mentioned softmax function is computationally expensive, negative sampling is used during training. After training the k-mer representations, to represent a given protein sequence, we used summation embedding of the existing k-mers in the sequence. Such representations have proven helpful in protein function annotation tasks (Asgari and Mofrad, 2015; Zhou et al., 2019).
2.3 ML methods
After encoding the peptides as feature vectors, we used ML algorithms to classify the peptides as epitopes versus non-epitopes. For this binary classification, we used SVMs with the RBF kernel. All the algorithms were implemented by the Sklearn package in Python. SVMs have been used extensively in linear epitope prediction (BCPreds, LBTope, AAP, etc.) (Chen et al., 2007; El-Manzalawy et al., 2008; Singh et al., 2013) and they have also been applied for sequence-based prediction tasks (Leslie et al., 2002; Wu and Zhang, 2008; Zou et al., 2013). We used a grid search to optimize the parameters C and γ over the range [1000–0.0001], with steps of a power of two.
2.4 Performance evaluation
We used 5-fold cross-validation on the training dataset for optimizing the hyper-parameters of our model and reported the performance averaged over the held-out folds using common metrics for evaluating binary classification algorithms. Specifically, we calculated the prediction accuracy (ACC), precision (Precision), recall/sensitivity (Sn), F1 score (F1), Matthews correlation coefficient (MCC), and area under the receiver operating characteristic (ROC) curve (). If the dataset was unbalanced, we used balanced accuracy as the accuracy metric.
3 Results
Our first task was to identify features that will be included in our ML model. To this end, we selected the best performing features for our ML model using 5-fold cross-validation on the BCPreds dataset (Supplementary Section 2) and then trained the classifier with the selected features on three datasets: (i) EpitopeVec(BCPreds) trained on the BCPreds dataset; (ii) EpitopeVec(LBTope) trained on the LBTope dataset; and (iii) EpitopeVec(iBCE-EL) trained on the iBCE-EL training dataset. We then compared the performance of our method with previously published methods. In addition, we benchmarked the methods that were not tested on the selected benchmarking datasets used previously (e.g. BepiPred, BepiPred2.0, iBCE-EL, EpiDope and DLBEpitope). As there were many peptides in our test datasets that were exact matches (100% homologous) with peptides in DLBEpitope’s training set, we retested DLBEpitope on the homology-reduced test sets as well (Supplementary Section 3). For the methods reporting per-residue scores (e.g. BepiPred, BepiPred2.0 and EpiDope), we averaged the scores for all constituent residues to obtain a single score for the peptide (Supplementary Section 3).
3.1 Discriminative power of the protein features
We used several feature sets in our ML models and investigated which feature set had the best discriminative power when used independently. We tested the SVM model on the BCPreds dataset with 5-fold cross-validation including individual feature sets. All of the ML models were trained on the BCPreds dataset with 5-fold cross-validation, C, and γ parameters for the RBF kernel were optimized via a grid search through cross-validation, and performance was averaged over the held-out folds. Use of the chain-transition-distribution features (Dubchak et al., 1995) resulted in an accuracy of 61%, whereas the AAC scales performed quite similarly, with their accuracy ranging from 63% (AAC) to 65% (DPC). With k-mer representations, higher values of k resulted in a better accuracy (the highest being 69.9% with k = 4) and the use of ProtVec features resulted in an accuracy of 70%. Use of the AAP antigenicity scale resulted in an accuracy of 68.55% and use of the AAT antigenicity scale produced the highest accuracy of 78.67%. When taking combinations of different feature sets, we achieved the highest accuracy of 81.31% by combining the composition-based features (AAP, AAT and AAC) with the sequence representation-based features (Protvec). This feature set was selected for use with our new method called EpitopeVec (Supplementary Section 2).
3.2 Evaluation on the BCPreds dataset
In the 5-fold cross-validation, our method [EpitopeVec(BCPreds)] performed the best with an average accuracy of 81.31% (13.41% higher than the original BCPreds method) (Table 2) and a ROC-AUC of 0.889 (Fig. 1). The EpitopeVec(LBtope) and EpitopeVec(iBCE-EL) models had an accuracy of 57.13% and 57.48% on the BCPreds dataset, respectively. In previously published work, the accuracy of the method trained on the IEDB-derived datasets (LBtope) was reported to be 51.57% (Singh et al., 2013), while the accuracy of other methods trained on the Bcipep-derived datasets (AAP, ABCPred and Cobe-Pro) was reported to be between 64% and 71% (Chen et al., 2007; Saha and Raghava, 2006; Sweredoski and Baldi, 2009). Among the methods that we benchmarked, iBCE-EL, BepiPred2.0 and EpiDope had the lowest performance on this dataset, with accuracies ranging from 49% to 51% (Table 2). BepiPred and DLBEpitope had slightly better accuracies (61.2% and 59.6%), but the accuracy of DLBEpitope dropped to 51% after retesting on the homology-reduced BCPreds set (removing peptides that were >80% homologous to DLBEpitope’s training set).
Table 2.
Comprehensive benchmark of linear BCE predictors on different datasets, comparing EpitopeVec with previously published methods for linear BCE prediction
| Method | ROC_AUC | Accuracy | Precision+ | Precision− | Recall+ | Recall− | F1 | MCC |
|---|---|---|---|---|---|---|---|---|
| BCPreds set | ||||||||
| BepiPred a | 0.665 | 61.19 | 0.65 | 0.59 | 0.49 | 0.74 | 0.61 | 0.232 |
| ABCPred b | 0.643 | — | — | — | — | — | — | — |
| AAP c | 0.7 | 64.05 | — | — | — | — | — | — |
| BCPreds d | 0.758 | 67.9 | — | — | 0.73 | 0.63 | — | 0.360 |
| 0.768 | 71.4 | — | — | — | — | — | — | |
| LBTope f | — | 51.57 | — | — | — | — | — | — |
| 0.576 | 48.71 | 0.49 | 0.15 | 0.97 | 0.01 | 0.33 | −0.009 | |
| 0.432 | 49.78 | 0.49 | 0.5 | 0.11 | 0.89 | 0.41 | −0.006 | |
| DLBEpitope i | 0.647 | 59.62 | 0.72 | 0.56 | 0.32 | 0.88 | 0.56 | 0.232 |
| 0.515 | 50.78 | 0.4 | 0.63 | 0.14 | 0.88 | 0.47 | 0.023 | |
| EpiDope j | 0.575 | 50.71 | 0.81 | 0.5 | 0.02 | 1 | 0.35 | 0.067 |
| 0.889 | 81.31 | 0.816 | 0.811 | 0.807 | 0.819 | 0.811 | 0.627 | |
| EpitopeVec(LBTope) | 0.645 | 57.13 | 0.56 | 0.59 | 0.69 | 0.45 | 0.57 | 0.147 |
| 0.596 | 57.48 | 0.57 | 0.57 | 0.57 | 0.57 | 0.57 | 0.15 | |
| Chen set | ||||||||
| BepiPred | 0.665 | 60.44 | 0.64 | 0.58 | 0.47 | 0.74 | 0.6 | 0.217 |
| 0.7 | 71.09 | — | — | 0.61 | 0.75 | — | 0.366 | |
| AAP + scalesc | — | 72.54 | — | — | 0.64 | 0.76 | — | 0.404 |
| APCPred k | 0.809 | 72.94 | — | — | 0.70 | 0.76 | — | 0.460 |
| Cobe—Pro | 0.829 | 78 | — | — | — | — | — | — |
| LBTope | — | 53.33 | — | — | — | — | — | — |
| iBCE—EL | 0.528 | 49.4 | 0.5 | 0.4 | 0.96 | 0.02 | 0.35 | −0.036 |
| 0.424 | 49.31 | 0.47 | 0.5 | 0.11 | 0.88 | 0.4 | −0.021 | |
| DLBEpitope | 0.654 | 61.45 | 0.75 | 0.57 | 0.35 | 0.88 | 0.58 | 0.272 |
| 0.535 | 51.81 | 0.38 | 0.69 | 0.15 | 0.88 | 0.50 | 0.050 | |
| EpiDope | 0.559 | 50.68 | 0.77 | 0.5 | 0.02 | 0.99 | 0.35 | 0.061 |
| EpitopeVec(BCPreds) | 0.958 | 88.30 | 0.85 | 0.92 | 0.93 | 0.83 | 0.88 | 0.770 |
| EpitopeVec(LBTope) | 0.658 | 57.91 | 0.56 | 0.61 | 0.71 | 0.44 | 0.57 | 0.164 |
| 0.589 | 56.70 | 0.57 | 0.57 | 0.57 | 0.57 | 0.57 | 0.134 | |
| ABCPred set | ||||||||
| BepiPred | 0.624 | 57.71 | 0.6 | 0.56 | 0.46 | 0.69 | 0.57 | 0.158 |
| AAP | 0.782 | 73.14 | — | — | 0.50 | 0.96 | — | 0.518 |
| APCPred | 0.794 | 73.00 | — | — | 0.65 | 0.81 | — | 0.466 |
| — | 65.93 | — | — | 0.67 | 0.65 | — | 0.319 | |
| BCPreds | 0.801 | 74.57 | — | — | 0.70 | 0.79 | — | 0.493 |
| LBTope | — | 57.90 | — | — | — | — | — | — |
| iBCE—EL | 0.588 | 52.7 | 0.51 | 0.72 | 0.96 | 0.09 | 0.42 | 0.112 |
| 0.399 | 49.28 | 0.39 | 0.5 | 0.02 | 0.96 | 0.35 | −0.04 | |
| DLBEpitope | 0.7 | 63.86 | 0.78 | 0.59 | 0.39 | 0.89 | 0.61 | 0.319 |
| 0.567 | 52.79 | 0.43 | 0.68 | 0.17 | 0.89 | 0.51 | 0.078 | |
| EpiDope | 0.599 | 50.64 | 0.76 | 0.5 | 0.02 | 0.99 | 0.35 | 0.059 |
| EpitopeVec(BCPreds) | 0.929 | 85.64 | 0.84 | 0.88 | 0.89 | 0.83 | 0.86 | 0.714 |
| EpitopeVec(LBTope) | 0.723 | 64.79 | 0.62 | 0.69 | 0.75 | 0.54 | 0.64 | 0.303 |
| 0.616 | 59.28 | 0.68 | 0.56 | 0.35 | 0.83 | 0.57 | 0.212 | |
| Blind387 set | ||||||||
| BepiPred | 0.627 | 56.59 | 0.55 | 0.58 | 0.53 | 0.6 | 0.57 | 0.132 |
| AAP | 0.689 | 64.60 | — | — | 0.64 | 0.65 | — | 0.292 |
| ABCPred | — | 66.41 | — | — | 0.72 | 0.62 | — | — |
| BCPreds | 0.699 | 65.89 | 0.66 | 0.66 | 0.318 | |||
| iBCE—EL | 0.501 | 43.4 | 0.44 | 0.17 | 0.84 | 0.03 | 0.32 | −0.227 |
| 0.62 | 55.53 | 0.75 | 0.55 | 0.16 | 0.95 | 0.48 | 0.181 | |
| DLBEpitope | 0.649 | 59.72 | 0.66 | 0.70 | 0.27 | 0.92 | 0.59 | 0.264 |
| 0.555 | 52.67 | 0.29 | 0.82 | 0.13 | 0.92 | 0.52 | 0.075 | |
| EpiDope | 0.541 | 50.80 | 1 | 0.52 | 0.02 | 1 | 0.36 | 0.091 |
| EpitopeVec(BCPreds) | 0.778 | 71.83 | 0.75 | 0.7 | 0.63 | 0.81 | 0.72 | 0.445 |
| EpitopeVec(LBTope) | 0.756 | 65.55 | 0.60 | 0.75 | 0.82 | 0.49 | 0.64 | 0.329 |
| 0.724 | 68.65 | 0.73 | 0.67 | 0.57 | 0.80 | 0.68 | 0.384 | |
| LBtope set | ||||||||
| BepiPred | 0.566 | 54.57 | 0.55 | 0.54 | 0.49 | 0.61 | 0.55 | 0.092 |
| 0.69 | 64.86 | — | — | — | — | — | — | |
| BCPreds | — | 52.56 | — | — | — | — | — | — |
| iBCE—EL | 0.619 | 52.2 | 0.51 | 0.9 | 0.99 | 0.05 | 0.39 | 0.135 |
| 0.476 | 49.95 | 0.5 | 0.5 | 0.13 | 0.87 | 0.42 | −0.001 | |
| DLBEpitope | 0.769 | 67.27 | 0.82 | 0.62 | 0.44 | 0.9 | 0.65 | 0.389 |
| 0.504 | 50.89 | 0.60 | 0.43 | 0.15 | 0.87 | 0.41 | 0.025 | |
| EpiDope | 0.559 | 50.34 | 0.68 | 0.5 | 0.01 | 0.99 | 0.35 | 0.036 |
| EpitopeVec(BCPreds) | 0.548 | 52.98 | 0.55 | 0.52 | 0.32 | 0.74 | 0.51 | 0.065 |
| 0.838 | 75.62 | 0.75 | 0.75 | 0.76 | 0.75 | 0.76 | 0.512 | |
| 0.602 | 57.12 | 0.56 | 0.58 | 0.62 | 0.53 | 0.57 | 0.143 | |
| iBCE-EL training set | ||||||||
| BepiPred | 0.556 | 53.76 | 0.49 | 0.59 | 0.47 | 0.61 | 0.54 | 0.076 |
| 0.782 | 72.9 | — | — | 0.716 | 0.739 | — | 0.454 | |
| 0.51 | 50.99 | 0.55 | 0.56 | 0.06 | 0.96 | 0.41 | 0.045 | |
| EpiDope | 0.582 | 50.57 | 0.8 | 0.56 | 0.01 | 1 | 0.37 | 0.064 |
| EpitopeVec(BCPreds) | 0.555 | 53.78 | 0.52 | 0.58 | 0.31 | 0.76 | 0.52 | 0.085 |
| EpitopeVec(LBTope) | 0.718 | 63.41 | 0.56 | 0.71 | 0.73 | 0.54 | 0.62 | 0.270 |
| 0.789 | 71.4 | 0.7 | 0.73 | 0.64 | 0.77 | 0.71 | 0.419 | |
| iBCE-EL ind. set | ||||||||
| BepiPred | 0.568 | 55.17 | 0.5 | 0.6 | 0.47 | 0.63 | 0.55 | 0.104 |
| iBCE—EL | 0.786 | 73.40 | 0.66 | 0.8 | 0.79 | 0.68 | 0.73 | 0.454 |
| 0.486 | 51.62 | 0.56 | 0.57 | 0.08 | 0.95 | 0.43 | 0.065 | |
| EpiDope | 0.595 | 50.47 | 0.7 | 0.56 | 0.01 | 1 | 0.37 | 0.049 |
| EpitopeVec(BCPreds) | 0.571 | 54.20 | 0.52 | 0.59 | 0.31 | 0.78 | 0.53 | 0.095 |
| EpitopeVec(LBTope) | 0.745 | 65.43 | 0.57 | 0.74 | 0.76 | 0.55 | 0.64 | 0.311 |
| 0.782 | 70.69 | 0.68 | 0.73 | 0.63 | 0.76 | 0.7 | 0.402 | |
| Viral method | ||||||||
| EpitopeVec—viral (on viral training) | 0.875 | 79.73 | 0.718 | 0.843 | 0.698 | 0.67 | 0.850 | 0.554 |
| EpitopeVec—viral on BCPreds viral | 0.756 | 72.02 | 0.968 | 0.190 | 0.648 | 0.793 | 0.541 | 0.264 |
| EpitopeVec—viral on BCPreds bacterial | 0.569 | 54.07 | 0.301 | 0.770 | 0.378 | 0.704 | 0.535 | 0.076 |
| EpitopeVec—viral on BCPreds eukaryotic | 0.512 | 52.26 | 0.384 | 0.663 | 0.357 | 0.689 | 0.52 | 0.046 |
| iBCE—EL on BCPreds viral | 0.509 | 50.16 | 0.93 | 0.08 | 0.97 | 0.03 | 0.5 | 0.005 |
| iBCE—EL on BCPreds bacterial | 0.574 | 50.14 | 0.25 | 1 | 1 | 0.003 | 0.2 | 0.027 |
| iBCE—EL on BCPreds eukaryotic | 0.571 | 47.48 | 0.348 | 0.18 | 0.94 | 0.006 | 0.26 | −0.155 |
Note: The training dataset for EpitopeVec is indicated in parentheses. Rows with gray cells indicate cases where the results for the corresponding methods could not be recreated, and for which we could include only the scores for metrics reported in the original publication. The highest values per metric and test set are indicated in bold. ‘+’ indicates epitope predictions and ‘−’ indicates non-epitope predictions.
Larsen et al. (2006).
Chen et al. (2007).
El-Manzalawy et al. (2008).
Singh et al. (2013).
Manavalan et al. (2018).
Jespersen et al. (2017).
Liu et al. (2020).
Collatz et al. (2021).
Shen et al. (2015).
Averaged over the held-out folds of the 5-fold cross-validation.
Tested after removing homologous sequences (peptides that were more than 80% homologous in comparison to the peptides in the training set) from the test set.
Fig. 1.
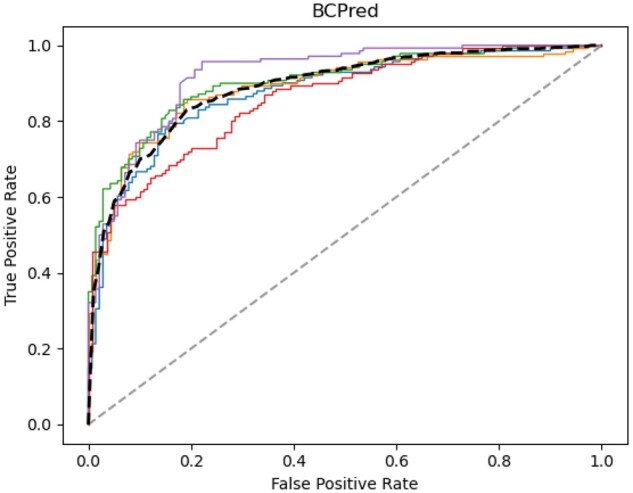
ROC curve of epitope prediction in 5-fold cross-validation on the BCPreds dataset, where the mean is shown as a bold dashed line and the random performance (ROCAUC=0.5) is shown as a gray dashed line. The five different colored lines represent the performance of each of the 5-folds
3.3 Evaluation on the Chen dataset
The Chen method (AAP method) uses a scale specifically designed based on the assumption that certain AAPs are favored in the epitope regions. It was the first method to incorporate differences between epitopes and non-epitopes by making use of the AAP antigenicity scale as a discriminative feature. We achieved an accuracy of 88.30% (Table 2) with the EpitopeVec(BCPreds) model on this dataset, which is 10% higher than the next best method, Cobe-Pro (78%) (Sweredoski and Baldi, 2009), and 16% higher than the original AAP method (71.09%) (Chen et al., 2007). This dataset was derived from the Bcipep database and was not reduced for homology, which explains why we observed a higher accuracy than that for the BCPreds dataset. The accuracy of EpitopeVec(LBTope) was 57.91% and EpitopeVec(iBCE-EL) was 56.70% on this dataset. The accuracy of the LBTope method (trained on IEDB-derived dataset) was reported to be 53.33% (Singh et al., 2013). The accuracies of the methods that we benchmarked (BepiPred2.0, iBCE-EL, BepiPred, EpiDope and DLBEpitope) ranged from 49.3% to 61.5%, with DLBEpitope having the highest accuracy of 61.5%, however, its accuracy dropped to 51.81% after retesting on the homology-reduced Chen set. Notably, we observed that the performance of most methods trained on the IEDB-derived sets was lower on this dataset.
3.4 Evaluation on the ABCPred dataset
The original ABCPred method is based on a recurrent neural network with an input vector of 16 residues and a sparse binary encoding, and it was one of the first methods to use machine learning for linear BCE prediction. The accuracy of EpitopeVec(BCPreds) on this dataset was 85.64%, which is 20% higher than the original ABCPred method (65.93%) (Saha and Raghava, 2006), and 11% higher than BCPreds (74.57%) (El-Manzalawy et al., 2008). As this dataset is also derived from the Bcipep database and was not specifically homology-reduced, we observed a higher accuracy compared to the BCPreds dataset. The accuracy of EpitopeVec(LBTope) was 64.79% and EpitopeVec(iBCE-EL) was 59.28% on the ABCPred dataset. The accuracy of methods, such as AAP and APCPred, was reported to be around 73% (Chen et al., 2007; Shen et al., 2015), while that of LBTope was reported to be 57.90% (Singh et al., 2013).
We also tested EpitopeVec on the Blind387 set that was published along with ABCPred. This is an independent test set with only some of the peptides (59 out of 187) from the Bcipep database. EpitopeVec(BCPreds) obtained an accuracy of 71.83%, outperforming the accuracies previously reported for AAP (64.60%), ABCPred (66.41%) and BCPreds (65.89%) (Chen et al., 2007; El-Manzalawy et al., 2008; Saha and Raghava, 2006). The accuracies obtained by our benchmarked methods (BepiPred, iBCE-EL, EpiDope, DLBEpitope and BepiPred2.0) ranged between 43% and 60% (Table 2). The accuracies of Epitope(LBTope) and Epitope(iBCE-EL) on the Blind387 set were 65.55% and 68.65%, respectively.
3.5 Evaluation on the LBTope dataset
LBtope is one of the first methods that made use of datasets compiled from the IEDB database. In 5-fold cross-validation on this dataset, our EpitopeVec(LBTope) model had an accuracy of 75.62% (Table 2), which was 11% higher than for the original LBTope method (64.86%) (Singh, 2013). The performance of methods trained on Bciped-derived datasets [BCPreds, EpitopeVec(BCPreds)] dropped substantially on this dataset, with the accuracy of BCPreds being 52.56% (El-Manzalawy et al., 2008) and the accuracy of the EpitopeVec(BCPreds) model being 52.98%. The accuracy of the EpitopeVec(iBCE-EL) model was 57.12%. All other methods that we benchmarked (iBCE-EL, EpiDope, BepiPred and BepiPred2.0), except for DLBEpitope, had low performances on this dataset, with their accuracies ranging from 50% to 55%. DLBEpitope had an accuracy of 67.2%, but it dropped to 50.89% after retesting on the homology-reduced LBTope set.
3.6 Evaluation on the iBCE-EL dataset
The iBCE-EL method is an ensemble method that uses Gradient Boosting and an Extra tree classifier. In 5-fold cross-validation on the iBCE-EL training dataset, our EpitopeVec(iBCE-EL) model had an average accuracy of 71.4% (Table 2), which is slightly lower than that of the original iBCE-EL method (73.40%). However, the average ROC_AUC of EpitopeVec(iBCE-EL) was 0.789, which is marginally higher than that of the iBCE-EL method (0.782). On the iBCE-EL independent test set, the performance of EpitopeVec(iBCE-EL) was slightly lower (accuracy: 70.69% and ROC_AUC: 0.782) than that of the iBCE-EL method (accuracy: 73.40% and ROC_AUC: 0.786). The accuracy for the methods that we benchmarked (BepiPred, BepiPred2.0 and EpiDope) ranged from 50% to 53% on the iBCE-EL training set and from 50% to 55% on the iBCE-EL independent set. The accuracies of EpitopeVec(BCPreds) and EpitopeVec(LBtope) were 53.78% and 63.41% on the iBCE-EL training set, while 54.20% and 65.43% on the iBCE-EL independent set.
3.7 Cross-testing results
In cross-testing on datasets different than their training sets, all of our three models had better performance than their respective original methods (Fig. 2) as well as other methods that we benchmarked (Table 2). However, we observed that when a method was trained on a dataset compiled from the Bcipep database, and then tested on a dataset compiled from the IEDB and vice versa, the performance dropped substantially. Our EpitopeVec(BCPreds) model had good performance (>80% accuracy) on other Bcipep-derived datasets (ABCPred, Chen), but the performance dropped substantially when testing on the IEDB-derived datasets (LBTope, iBCE-EL). The same was true for BCPred, LBTope and the other methods as well. Therefore, to test the overall performance of the methods, we created three pooled datasets [one each for EpitopeVec(BCPreds), EpitopeVec(LBTope) and EpitopeVec(iBCE-EL) models], where we combined all the testing sets except the respective training set of that model. We also created pooled-reduced sets, where we removed peptides in the pooled set that were homologous to the respective training set (inter-homology reduction) and similar sequences within the pooled sets (intra-homology reduction) using CD-HIT with a threshold of 80%. The performance of the EpitopeVec(iBCE-EL) model (58.37% accuracy, 0.615 AUC) was the best (5% higher accuracy than iBCE-EL) on its pooled-reduced set and overall it had better generalizability. The differences in the performance of the EpitopeVec method when trained on different datasets show that the performance is dependent on the source of the training data (Fig. 2). The substantial performance difference, we observed between cross-testing and 5-fold cross-validation on datasets derived from the Bcipep database and the IEDB indicates that most classifiers lack generalization, potentially caused by the fundamental differences in the nature of the underlying data (Odorico and Pellequer, 2003). When we computed the Pearson correlation of the AAT scale (the most discriminative feature in our method) derived from the Bcipep sets and the IEDB sets, it was relatively weak (0.41), indicating large differences in the composition of the epitopic peptides from both the databases.
Fig. 2.
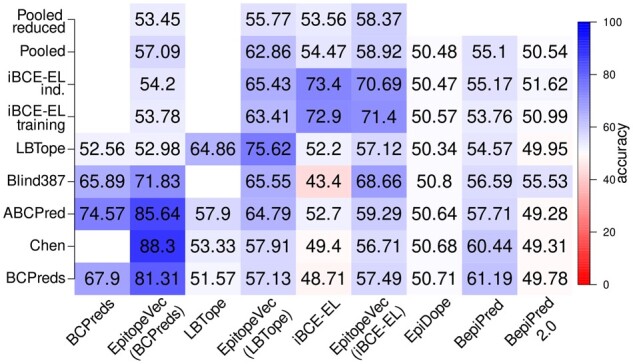
Heatmap showing the cross-testing performance of EpitopeVec when trained and tested on different datasets and comparison with other methods (x-axis, testing method; y-axis testing data; for training and testing on the same dataset, the accuracy averaged over 5-fold cross-validation is shown).
3.8 Improving epitope prediction accuracy with domain-specific datasets
In light of the observed lack of generalization of most methods and only slightly better generalizability of our method, we created a linear BCE predictor specific to viral peptides. When analyzing the composition of the Bcipep and IEDB databases, we found that Bcipep had a strong bias toward viruses, with 80% of the peptides originating from viral antigens. To investigate this further, we created a dataset of viral epitopes with experimentally verified positive and negative epitopes from the IEDB dataset and trained our model on this dataset with EpitopeVec. We cross-tested this new viral predictor (EpitopeVec-viral) on the homology-reduced BCPreds dataset (peptides in the BCPreds set that were more than 80% homologous to peptides in our training viral set were removed). The BCPreds dataset is composed of antigens from different species (i.e. viral, bacterial and eukaryotic), therefore, we were interested in the specific performance on antigens originating from different species. The performance of EpitopeVec-viral on viral peptides (72.02% accuracy, 0.756 ROC_AUC) was substantially higher than that on bacterial (54.07% accuracy, 0.569 ROC_AUC) and eukaryotic (52.26% accuracy, 0.512 ROC_AUC) peptides (Table 2 and Fig. 3a). The performance of iBCE-EL on domain-specific peptides was substantially below that of EpitopeVec-viral (Table 2 and Fig. 3b).
Fig. 3.
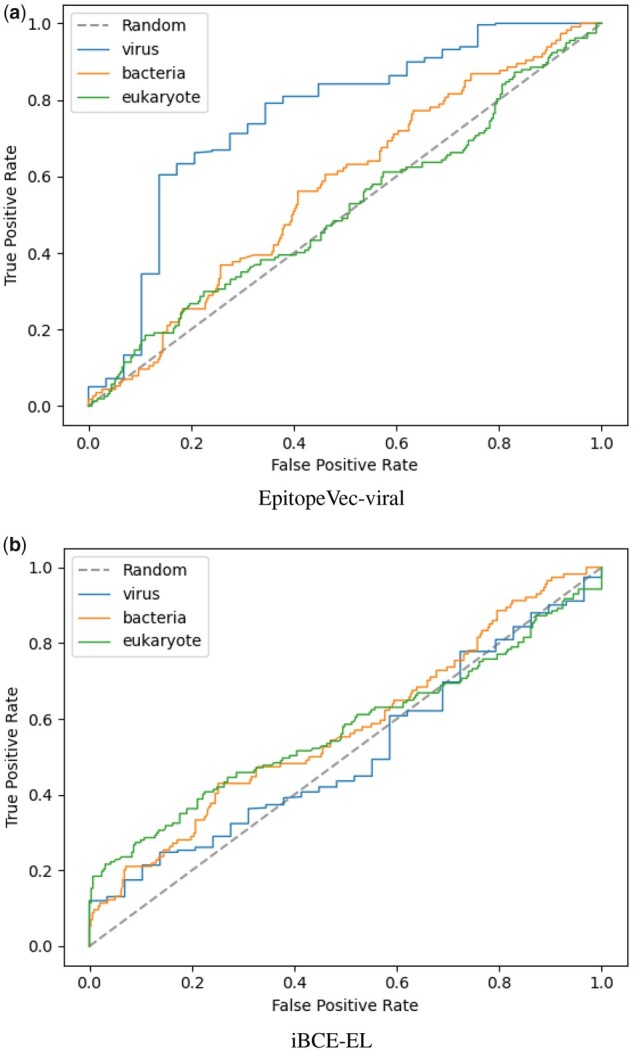
Area under the ROC curve for each antigen type in the BCPreds set, where the (a) EpitopeVec-viral predictor and (b) iBCE-EL were used as the predictive models
3.9 Predicting epitopes for SARS-CoV-1 and SARS-CoV-2 viruses
We tested our viral predictor on a set of 10 linear epitope peptides compiled in Grifoni et al. (2020) for SARS-CoV-1 from experimentally verified epitopes in the IEDB. We successfully predicted 7 out of 10 peptides as epitopes for SARS-CoV-1 with our EpitopeVec-viral model. We also compiled a set of experimentally verified epitopes and non-epitopes for SARS-CoV-2 from the IEDB and tested our viral predictor on these peptides. We predicted 7 out of 9 epitopes and 10 out of 10 non-epitopes correctly (Supplementary Section 4). Our viral predictor has very high precision in predicting both experimentally validated epitopes and non-epitopes derived from independent datasets.
4 Discussion and conclusions
In this work, we describe a ML framework for predicting linear BCEs from a combination of amino acid features, modified antigenicity scales (AAT) and context-independent protein embeddings (ProtVec).
4.1 Comprehensive benchmarking
We performed a comprehensive benchmarking of different linear BCE prediction methods over the existing BCE datasets.
This benchmarking introduces a meaningful comparison of existing methods in the literature by following the standard ML practices. In our benchmarking, we attempted to include all the accessible published methods, including methods that had not been previously tested across all our test datasets. The performance of most IEDB-trained methods dropped substantially when testing on Bcipep-derived datasets and vice versa. Of the per-residue methods, the performance of EpiDope and BepiPred2.0 was close to random. Of these methods, though the overall performance was still low, BepiPred performed the best, which may explain why it is still extensively used (Raoufi et al., 2020).
4.2 EpitopeVec performance
We trained our method on three different datasets (BCPreds, LBTOPE and iBCE-EL). The EpitopeVec(BCPreds) and EpitopeVec(LBTope) models showed improved performance in 5-fold cross-validation on their training sets in comparison to their respective original methods (BCPreds and LBTOPE). The EpitopeVec(iBCE-EL) model had a slightly lower performance compared to the iBCE-EL method in the 5-fold cross-validation on the iBCE-EL training set and independent testing on the iBCE-EL independent set. We believe that this is because the original iBCE-EL method is an ensemble method using multiple ML algorithms. Overall, our EpitopeVec model showed better performance in cross-validation, demonstrating that our method is superior to the state-of-the-art approaches in predicting linear BCEs.
4.3 Generalizability and cross-testing
In cross-testing on datasets, different than the training sets, the performance of our three models [EpitopeVec(BCPreds), EpitopeVec(LBTope) and EpitopeVec(iBCE-EL)] were not only better than the performances of the original methods (BCPreds, LBTope and iBCE-EL) but also than those of the recent methods (DLBEpitope, BepiPred2.0 and EpiDope) that we benchmarked. When testing on the pooled/pooled-reduced test sets, the performance of our method was also better than that of other methods, which shows a better generalization ability. However, we observed that in cross-testing, the performance of most methods dropped substantially, a known problem to ML approaches (Ng, 1997). In the case of BCE prediction, the relatively reduced performance in cross-testing was caused by the different compositions of residues in the positive and negative sets selected from these datasets. This indicates that properties distinguishing epitopic and non-epitopic peptides could be specific to the source of the antigen species (e.g. viral, bacterial or fungal antigens), as discussed previously (Gupta et al., 2013; Kozlova et al., 2018; Luštrek et al., 2013) and that creating a general-purpose classifier is difficult. To partially overcome the difficulties in creating a general-purpose linear BCE predictor, we and others (Gupta et al., 2013; Kozlova et al., 2018; Soria-Guerra et al., 2015) recommend creating an accurate, specialized predictor for specific antigenic types. We trained a linear viral BCE predictor on a viral dataset separately in favor of this conclusion. Upon cross-testing on the BCPreds dataset, the viral predictor performed substantially better on viral peptides than on bacterial and eukaryotic peptides.
4.4 Applications and purposes
Although almost 90% of BCEs are conformational in nature (Barlow et al., 1986), linear BCEs are widely used for profiling antibody signatures (Noya et al., 2005), epitope mapping (peptide microarray-based experiments) (Dudek et al., 2010; Potocnakova et al., 2016) and other fields in immunology (Hancock and O’Reilly, 2005). Additionally, previously published methods for predicting linear BCEs have been used for designing peptide-based vaccines (Chen et al., 2020; María et al., 2017; Nezafat et al., 2016; Soria-Guerra et al., 2015). To overcome limitations in applications as such, we proposed and proved that dedicated predictors, such as EpitopeVec-viral, are able to successfully identify experimentally validated SARS-CoV-1 and SARS-CoV-2 epitopes. Thus, our predictive model can be used on viral proteins and aid in designing new peptide-based vaccines (Grifoni et al., 2020; Malonis et al., 2020). We believe that improving linear BCE predictions will be of value to the research community, especially with generalized and pre-trained viral classifiers.
4.5 Future direction
For future development, large, non-redundant and experimentally well-characterized datasets could be compiled and standardized for the training and the evaluation of linear BCE predictive models. Lastly, we see linear epitope prediction as a stepping stone to the conformational problem and it will ease the process of developing conformational predictions because of its comparatively less complex nature.
Supplementary Material
Acknowledgements
We thank Tzu-Hao Kuo for commenting and help with testing the code, as well as Megan Foster for editing the text.
Funding
This work was supported by the Deutsches Zentrum für Infektionsforschung (DZIF, German Center for Infection Research) grant ‘TI 06.901 - FP2016: Bioinformatics support for the development of a prophylactic HCV vaccine candidate’ and Deutsche Forschungsgemeinschaft (DFG, German Research Foundation) under Germany’s Excellence Strategy—EXC 2155—Projektnummer 390874280.
Conflict of Interest: None declared.
Contributor Information
Akash Bahai, Computational Biology of Infection Research, Helmholtz Center for Infection Research, Braunschweig 38124, Germany; Braunschweig Integrated Center of Systems Biology (BRICS), Technische Universität Braunschweig, Braunschweig 38106, Germany.
Ehsaneddin Asgari, Computational Biology of Infection Research, Helmholtz Center for Infection Research, Braunschweig 38124, Germany; Molecular Cell Biomechanics Laboratory, Department of Bioengineering and Mechanical Engineering, University of California, Berkeley, CA 94720, USA.
Mohammad R K Mofrad, Molecular Cell Biomechanics Laboratory, Department of Bioengineering and Mechanical Engineering, University of California, Berkeley, CA 94720, USA; Molecular Biophysics and Integrated Bioimaging, Lawrence Berkeley National Lab, Berkeley, CA 94720, USA.
Andreas Kloetgen, Computational Biology of Infection Research, Helmholtz Center for Infection Research, Braunschweig 38124, Germany.
Alice C McHardy, Computational Biology of Infection Research, Helmholtz Center for Infection Research, Braunschweig 38124, Germany; Braunschweig Integrated Center of Systems Biology (BRICS), Technische Universität Braunschweig, Braunschweig 38106, Germany.
References
- Alipanahi B. et al. (2015) Predicting the sequence specificities of DNA-and RNA-binding proteins by deep learning. Nat. Biotechnol., 33, 831–838. [DOI] [PubMed] [Google Scholar]
- Alix A.J. (1999) Predictive estimation of protein linear epitopes by using the program PEOPLE. Vaccine, 18, 311–314. [DOI] [PubMed] [Google Scholar]
- Asgari E. (2019) Life language processing: deep learning-based language-agnostic processing of proteomics, genomics/metagenomics, and human languages. PhD Thesis, UC Berkeley.
- Asgari E., Mofrad M.R. (2015) Continuous distributed representation of biological sequences for deep proteomics and genomics. PLoS One, 10, e0141287. [DOI] [PMC free article] [PubMed] [Google Scholar]
- Asgari E. et al. (2018) MicroPheno: predicting environments and host phenotypes from 16S rRNA gene sequencing using a k-mer based representation of shallow sub-samples. Bioinformatics, 34, i32–i42. [DOI] [PMC free article] [PubMed] [Google Scholar]
- Asgari E. et al. (2019a) DeepPrime2Sec: deep learning for protein secondary structure prediction from the primary sequences. https://www.biorxiv.org/content/10.1101/705426v1. [Google Scholar]
- Asgari E. et al. (2019b) Probabilistic variable-length segmentation of protein sequences for discriminative motif discovery (DiMotif) and sequence embedding (ProtVecX). Sci. Rep., 9, 1–16. [DOI] [PMC free article] [PubMed] [Google Scholar]
- Awazu A. (2017) Prediction of nucleosome positioning by the incorporation of frequencies and distributions of three different nucleotide segment lengths into a general pseudo k-tuple nucleotide composition. Bioinformatics, 33, 42–48. [DOI] [PMC free article] [PubMed] [Google Scholar]
- Bairoch A. (2000) The SWISS-PROT protein sequence database and its supplement TrEMBL in 2000. Nucleic Acids Res., 28, 45–48. [DOI] [PMC free article] [PubMed] [Google Scholar]
- Barlow D.J. et al. (1986) Continuous and discontinuous protein antigenic determinants. Nature, 322, 747–748. [DOI] [PubMed] [Google Scholar]
- Blythe M.J., Flower D.R. (2005) Benchmarking B cell epitope prediction: underperformance of existing methods. Protein Sci., 14, 246–248. [DOI] [PMC free article] [PubMed] [Google Scholar]
- Bojanowski P. et al. (2016) Enriching word vectors with subword information. https://arxiv.org/abs/1607.04606v2. [Google Scholar]
- Bonetta R., Valentino G. (2020) Machine learning techniques for protein function prediction. Proteins Struct. Funct. Bioinforma., 88, 397–413. [DOI] [PubMed] [Google Scholar]
- Bryson C.J. et al. (2010) Prediction of immunogenicity of therapeutic proteins: validity of computational tools. BioDrugs, 24, 1–8. [DOI] [PubMed] [Google Scholar]
- Chen H.Z. et al. (2020) Bioinformatics analysis of epitope-based vaccine design against the novel SARS-CoV-2. Infect. Dis. Poverty, 9, 88. [DOI] [PMC free article] [PubMed] [Google Scholar]
- Chen J. et al. (2007) Prediction of linear B-cell epitopes using amino acid pair antigenicity scale. Amino Acids, 33, 423–428. [DOI] [PubMed] [Google Scholar]
- Collatz M. et al. (2021) EpiDope: a deep neural network for linear B-cell epitope prediction. Bioinformatics, 37, 448–455. [DOI] [PubMed] [Google Scholar]
- Dubchak I. et al. (1995) Prediction of protein folding class using global description of amino acid sequence. Proc. Natl. Acad. Sci. USA, 92, 8700–8704. [DOI] [PMC free article] [PubMed] [Google Scholar]
- Dudek N.L. et al. (2010) Epitope discovery and their use in peptide based vaccines. Curr. Pharm. Des., 16, 3149–3157. [DOI] [PubMed] [Google Scholar]
- El-Manzalawy Y. et al. (2008) Predicting linear B-cell epitopes using string kernels. J. Mol. Recognit., 21, 243–255. [DOI] [PMC free article] [PubMed] [Google Scholar]
- Emini E.A. et al. (1985) Induction of hepatitis A virus-neutralizing antibody by a virus-specific synthetic peptide. J. Virol., 55, 836–839. [DOI] [PMC free article] [PubMed] [Google Scholar]
- Flower D.R. (2007) Immunoinformatics. Predicting Immunogenicity In Silico. Preface. Springer [DOI] [PubMed]
- Galanis K.A. et al. (2021) Linear B-cell epitope prediction for in silico vaccine design: A performance review of methods available via command-line interface. Int. J. Mol. Sci., 22, 1–19. [DOI] [PMC free article] [PubMed] [Google Scholar]
- Giancarlo R. et al. (2015) Epigenomic k-mer dictionaries: shedding light on how sequence composition influences in vivo nucleosome positioning. Bioinformatics, 31, 2939–2946. [DOI] [PubMed] [Google Scholar]
- Grabherr M.G. et al. (2011) Full-length transcriptome assembly from RNA-seq data without a reference genome. Nat. Biotechnol., 29, 644–652. [DOI] [PMC free article] [PubMed] [Google Scholar]
- Grifoni A. et al. (2020) A sequence homology and bioinformatic approach can predict candidate targets for immune responses to SARS-CoV-2. Cell Host Microbe, 27, 671–680.e2. [DOI] [PMC free article] [PubMed] [Google Scholar]
- Gupta S. et al. ; Open Source Drug Discovery Consortium. (2013) Identification of B-cell epitopes in an antigen for inducing specific class of antibodies. Biol. Direct, 8, 27. [DOI] [PMC free article] [PubMed] [Google Scholar]
- Hancock D.C., O’Reilly N.J. (2005) Synthetic peptides as antigens for antibody production. Methods Mol. Biol., 1474, 25–47. [PubMed] [Google Scholar]
- Huang Y. et al. (2010) CD-HIT Suite: a web server for clustering and comparing biological sequences. Bioinformatics, 26, 680–682. [DOI] [PMC free article] [PubMed] [Google Scholar]
- Janeway C. (2012) Immunobiology. 8th edn New York: Garland Science. [Google Scholar]
- Jespersen M.C. et al. (2017) BepiPred-2.0: improving sequence-based B-cell epitope prediction using conformational epitopes. Nucleic Acids Res., 45, W24–W29. [DOI] [PMC free article] [PubMed] [Google Scholar]
- Jolma A. et al. (2013) DNA-binding specificities of human transcription factors. Cell, 152, 327–339. [DOI] [PubMed] [Google Scholar]
- Karplus P.A., Schulz G.E. (1985) Prediction of chain flexibility in proteins - a tool for the selection of peptide antigens. Naturwissenschaften, 72, 212–213. [Google Scholar]
- Kolaskar A.S., Tongaonkar P.C. (1990) A semi-empirical method for prediction of antigenic determinants on protein antigens. FEBS Lett., 276, 172–174. [DOI] [PubMed] [Google Scholar]
- Kozlova E.E.G. et al. (2018) Computational B-cell epitope identification and production of neutralizing murine antibodies against Atroxlysin-I. Sci. Rep., 8, 14904. [DOI] [PMC free article] [PubMed] [Google Scholar]
- Larsen J. et al. (2006) Improved method for predicting linear B-cell epitopes. Immunome Res., 2, 2. [DOI] [PMC free article] [PubMed] [Google Scholar]
- Leslie C. et al. (2002) The spectrum kernel: a string kernel for SVM protein classification. Pac. Symp. Biocomput., Lihue, Hawaii, 564–575. [PubMed] [Google Scholar]
- Levitt M. (1976) A simplified representation of protein conformations for rapid simulation of protein folding. J. Mol. Biol., 104, 59–107. [DOI] [PubMed] [Google Scholar]
- Li Z., Yu Y. (2016) Protein secondary structure prediction using cascaded convolutional and recurrent neural networks. In: IJCAI International Joint Conference on Artificial Intelligence 9–15 July 2016. New York, NY, USA.
- Liu T. et al. (2020) Deep learning methods improve linear B-cell epitope prediction. BioData Min., 13, 1. [DOI] [PMC free article] [PubMed] [Google Scholar]
- Liu Y. et al. (2018) Learning structural motif representations for efficient protein structure search. Bioinformatics, 34, i773–i780. [DOI] [PMC free article] [PubMed] [Google Scholar]
- Luštrek M. et al. (2013) Epitope predictions indicate the presence of two distinct types of epitope-antibody-reactivities determined by epitope profiling of intravenous immunoglobulins. PLoS One, 8, e78605. [DOI] [PMC free article] [PubMed] [Google Scholar]
- Malonis R.J. et al. (2020) Peptide-based vaccines: current progress and future challenges. Chem. Rev., 120, 3210–3229. [DOI] [PMC free article] [PubMed] [Google Scholar]
- Manavalan B. et al. (2018) iBCE-EL: a new ensemble learning framework for improved linear B-cell epitope prediction. Front. Immunol., 9, 1695. [DOI] [PMC free article] [PubMed] [Google Scholar]
- María R.R. et al. (2017) The impact of bioinformatics on vaccine design and development. In, Vaccines. InTech.https://www.intechopen.com/books/vaccines/the-impact-of-bioinformatics-on-vaccine-design-and-development [Google Scholar]
- Mikolov T. et al. (2013) Distributed representations of words and phrases and their compositionality. In: Advances in Neural Information Processing Systems. Lake Tahoe, Nevada, pp. 3111–3119.
- Nezafat N. et al. (2016) Designing an efficient multi-epitope peptide vaccine against Vibrio cholerae via combined immunoinformatics and protein interaction based approaches. Comput. Biol. Chem., 62, 82–95. [DOI] [PubMed] [Google Scholar]
- Ng A.Y. (1997) Preventing “overfitting” of cross-validation data. In: ICML. Nashville, Tennessee, USA.
- Noya O. et al. (2005) Immunodiagnosis of parasitic diseases with synthetic peptides. Curr. Protein Pept. Sci., 4, 299–308. [DOI] [PubMed] [Google Scholar]
- Odorico M., Pellequer J.L. (2003) BEPITOPE: predicting the location of continuous epitopes and patterns in proteins. J. Mol. Recognit., 16, 20–22. [DOI] [PubMed] [Google Scholar]
- Pellequer J.L., Westhof E. (1993) PREDITOP: a program for antigenicity prediction. J. Mol. Graph., 11, 204–210. [DOI] [PubMed] [Google Scholar]
- Pellequer J.L. et al. (1991) Predicting location of continuous epitopes in proteins from their primary structures. Methods Enzymol., 203, 176–201. [DOI] [PubMed] [Google Scholar]
- Potocnakova L. et al. (2016) An introduction to B-cell epitope mapping and in silico epitope prediction. J. Immunol. Res., 2016, 1–11. [DOI] [PMC free article] [PubMed] [Google Scholar]
- Raoufi E. et al. (2020) Epitope prediction by novel immunoinformatics approach: a state-of-the-art review. Int. J. Pept. Res. Ther., 26, 1155–1163. [DOI] [PMC free article] [PubMed] [Google Scholar]
- Saha S., Raghava G.P. (2006) Prediction of continuous B-cell epitopes in an antigen using recurrent neural network. Proteins, 65, 40–48. [DOI] [PubMed] [Google Scholar]
- Saha S. et al. (2005) Bcipep: a database of B-cell epitopes. BMC Genomics, 6, 79. [DOI] [PMC free article] [PubMed] [Google Scholar]
- Sanchez-Trincado J.L. et al. (2017) Fundamentals and methods for T- and B-cell epitope prediction. J. Immunol. Res., 2017, 1–14. [DOI] [PMC free article] [PubMed] [Google Scholar]
- Shen W. et al. (2015) Predicting linear B-cell epitopes using amino acid anchoring pair composition. BioData Min., 8, 14. [DOI] [PMC free article] [PubMed] [Google Scholar]
- Singh H. et al. (2013) Improved method for linear B-cell epitope prediction using antigen’s primary sequence. PLoS One, 8, e62216. [DOI] [PMC free article] [PubMed] [Google Scholar]
- Soria-Guerra R.E. et al. (2015) An overview of bioinformatics tools for epitope prediction: implications on vaccine development. J. Biomed. Inform., 53, 405–414. [DOI] [PubMed] [Google Scholar]
- Sun P. et al. (2018) Advances in in-silico B-cell epitope prediction. Curr. Top. Med. Chem., 19, 105–115. [DOI] [PubMed] [Google Scholar]
- Sweredoski M.J., Baldi P. (2009) COBEpro: a novel system for predicting continuous B-cell epitopes. Protein Eng. Des. Sel., 22, 113–120. [DOI] [PMC free article] [PubMed] [Google Scholar]
- Vita R. et al. (2010) The immune epitope database 2.0. Nucleic Acids Res., 38, D854–D862. [DOI] [PMC free article] [PubMed] [Google Scholar]
- Wood D.E., Salzberg S.L. (2014) Kraken: ultrafast metagenomic sequence classification using exact alignments. Genome Biol., 15, R46. [DOI] [PMC free article] [PubMed] [Google Scholar]
- Wu S., Zhang Y. (2008) A comprehensive assessment of sequence-based and template-based methods for protein contact prediction. Bioinformatics, 24, 924–931. [DOI] [PMC free article] [PubMed] [Google Scholar]
- Yang X., Yu X. (2009) An introduction to epitope prediction methods and software. Rev. Med. Virol., 19, 77–96. [DOI] [PubMed] [Google Scholar]
- Yao B. et al. (2012) SVMTriP: a method to predict antigenic epitopes using support vector machine to integrate tri-peptide similarity and propensity. PLoS One, 7, e45152. [DOI] [PMC free article] [PubMed] [Google Scholar]
- Zhou G. et al. (2020) Mutation effect estimation on protein–protein interactions using deep contextualized representation learning. NAR Genom. Bioinform., 2, iqaa015. [DOI] [PMC free article] [PubMed] [Google Scholar]
- Zhou N. et al. (2019) The CAFA challenge reports improved protein function prediction and new functional annotations for hundreds of genes through experimental screens. Genome Biol., 20, 1–23. [DOI] [PMC free article] [PubMed] [Google Scholar]
- Zou C. et al. (2013) An improved sequence based prediction protocol for DNA-binding proteins using SVM and comprehensive feature analysis. BMC Bioinformatics, 14, 90. [DOI] [PMC free article] [PubMed] [Google Scholar]
Associated Data
This section collects any data citations, data availability statements, or supplementary materials included in this article.