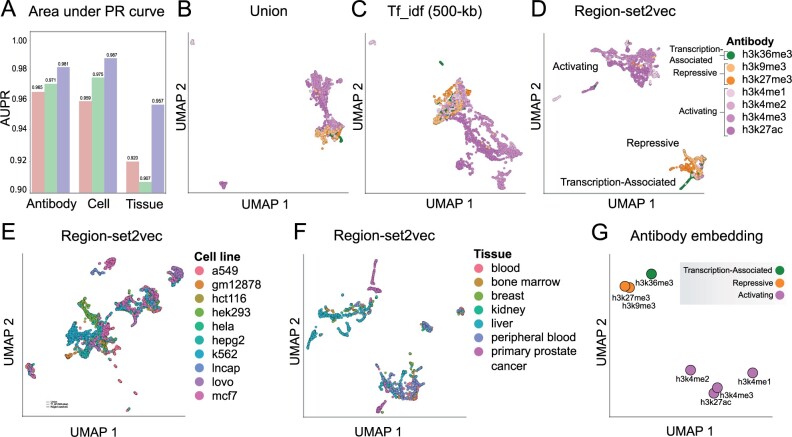
Fig. 3.
Classification performance and UMAP visualizations of representations. (a) Area under the micro-average PR curve for each dataset. (b) Antibody dataset represented by union method. (c) Tf_idf representation using 500-kb of antibody dataset. Each point represents a region set. (d) Region-set2vec embedding of antibody dataset using combined region embeddings trained by word2vec algorithm. (e) Region-set2vec representation of cell line dataset. (f) Region-set2vec representation of tissue type datasets. Panels show the UMAP visualization of the original data, not the PCA-reduced data. (g) A UMAP projection of antibody embeddings annotated by class label. Each point is the combination of all the samples in each class

