

Abstract
Monitoring human respiratory patterns is of great importance as it gives essential information for various medical conditions, e.g. sleep apnoea syndrome and chronic obstructive pulmonary disease and asthma, etc. Herein, we have developed a polymeric airflow sensor based on nanocomposites of vertically grown graphene nanosheets (VGNs) with polydimethylsiloxane (PDMS) and explored their applications in monitoring human respiration. The sensing performance of the VGNs/PDMS nanocomposite was characterized by exposing to a range of airflow rates (20–130 l min−1), and a linear performance with high sensitivity and low response time (mostly below 1 s) was observed. To evaluate the experimental results, finite-element simulation models were developed in the COMSOL Multiphysics package. The piezoresistive properties of VGNs/PDMS thin film and fluid–solid interaction were thoroughly studied. Laser Doppler vibrometry measures of sensor tip displacement closely approximated simulated deflection results and validated the dynamic response of the sensor. By comparing the proposed sensor and some other airflow sensors in the literature, it is concluded that the VGNs/PDMS airflow sensor has excellent features in terms of sensor height, detection range and sensitivity. The potential application of the VGNs/PDMS airflow sensor in detecting the respiration pattern of human exercises like walking, jogging and running has been demonstrated.
Keywords: respiratory sensors, piezoresistive sensors, finite-element simulation, graphene-based sensors, vertical graphene nanosheets
1. Introduction
Monitoring respiratory rate is vital to distinguish physical conditions of those suffering from respiratory disorders, such as bronchitis, heart disease, sleep apnoea syndrome and hyperpyrexia [1]. The early recognition of respiratory dysfunctions enables doctors to diagnose such diseases. Studies have demonstrated measuring respiratory rate, in some cases, is more vital than heart pulse and blood pressure to distinguish high-risk patient groups [2–5]. Therefore, monitoring respiratory rate has received considerable attention among scientists to develop contactless-based techniques [6] or contact-based methods [7] with consideration of some important characteristics including size, cost, sensitivity to body motion artefacts, influence of environmental factors, presence of wire, measurement intrusiveness and real-time monitoring [7]. Contact-based methods for measuring respiratory rate are classified according to measuring methods into airflow [8], air temperature [9], breathing sound [10,11], air humidity [12–14], respiratory-induced torso movements [15–17] and air component [18]. Contactless-based techniques include environmental respiratory sounds (e.g. using microphones) [19], air temperature (e.g. thermal cameras) [20], chest wall movements (e.g. laser vibrometry or radar sensors) [21] and camera-based body movement detection [22–24]. Contact-based techniques cover a wide range of solutions, while contactless methods are used in measurement circumstances where unobtrusive approaches are a prerequisite.
During the last decade, many researchers made great efforts to develop respiratory sensors for measuring respiratory rates. Respiratory sensors can be categorized, according to the sensing mechanisms, into piezoresistive [15,25], triboelectric [26,27], piezoelectric [28–31] and capacitive [32,33]. Among these different categories, piezoresistive sensors have gained significant interest due to the relatively simple read-out systems, high sensitivity and low-frequency capability [34,35]. The piezoresistive effect, as an undesired parasitic effect, has always been correlated with silicon microstructures due to mechanical stress induced by thermal treatment or packaging. Nevertheless, in very large-scale-integrated circuits, this effect is used to integrate smart micromechanical sensors. Piezoresistive effect is also used in flexible sensors with wide application in wearable electronics, the Internet of Things and robotics [36]. Flexible sensors generally include a polymer as base material and a conductive filling material such as nanowires, nanoparticles, nanoribbons, carbon black, carbon nanotubes (CNTs) and graphene [37]. Among different filling materials, graphene is a promising candidate due to its great performance in detecting pressure, strain, humidity and temperature [38,39]. Moreover, the two-dimensional (2D) structure of graphene sheets provides high mechanical strength, high electrical and thermal conductivity. However, strong van der Waals and pi–pi interactions cause graphene sheets to restack, thereby leading to challenges in fabricating conductive polymer nanocomposites [40]. To overcome this issue, porous graphene materials such as graphene nanomesh [41] and graphene foam/aerogel [42] have been proposed. Recently, vertically grown graphene nanosheets (VGNs) with a unique maze-like structure have shown great promise in developing highly stretchable and sensitive piezoresistive sensors [43,44]. Recently, flexible flow sensors based on polydimethylsiloxane (PDMS) and a maze-like network of VGNs as the conductive-sensing material was developed [43,45,46]. The VGNs/PDMS flow sensor demonstrated ultrahigh sensitivity and a very low detection limit. The application of such flow sensors in mimicking vestibular hair cells located inside the lateral semicircular canal has been demonstrated. It could detect a very low frequency of 0.5 Hz with high sensitivity.
Predictive numerical analysis of the performance of piezoresistive elements is of high importance due to the significant reduction in time and cost of laboratory-based experiments. Lee & Loh [47] proposed a computational framework for the design of nanocomposite strain sensors made by depositing CNTs in polymer thin film matrices. The model was derived considering the kinked shape CNTs and their statistical length distributions. The model's nominal electrical properties, as well as at different applied strain states, were computed by constructing a conductance matrix of the CNT network and then applying Kirchhoff's current law and the conductance version of Ohm's law. Chong et al. [48] used the finite-element method (FEM) to model von Mises stress and total displacement of a piezoresistive strain sensor made of multi-walled carbon nanotubes (MWCNTs) and PDMS composite array, through the COMSOL Multiphysics package. Gbaguidi et al. [49] developed a 2D Monte Carlo percolation network model for hybrid nanocomposite with CNT and graphene nanoplatelet as conductive fillers. The electron tunnelling between filler specimens as the mechanism for electrical percolation was considered. Network modification after elastic deformation was used to model the nanocomposite piezoresistive behaviour. Lu et al. [50] proposed a multi-scale strategy to study the role of interfacial decohesion on the piezoresistive properties of a graphene/polymer composite. A cohesive zone model was identified by atomistic simulations to model graphene sheets at mesoscale. This nonlinear mechanical model was used to generate a deformed representative volume element to study the influence of strain and interfacial decohesion on the conductivity of graphene/polymer composites. The effective conductivity was studied with an electric continuum model at mesoscale incorporating a tunnelling effect. A finite-element-based numerical method for predicting the piezoresistive behaviour of graphene conductive polymer composites considering the quantum tunnelling effect was proposed by Yang et al. [51]. The model accurately predicted the conductivity, the percolation value and the mechanical properties of the graphene rubber composites. Lebedev et al. [52] proposed a numerical multi-scale approach based on the FEM to predict changes in the conductive structure in response to uniaxial deformation of polymer composites (MWCNT/ ultrahigh-molecular-weight polyethylene) with a highly segregated structure.
This paper suggests the design and development of a piezoresistive all-polymer airflow sensor for biomedical applications. The sensor was designed to have low modulus PDMS (monomer and curing agent weight ratio of 25 : 1). The use of low modulus PDMS increases flexibility and thereby increases the bending deformation and sensitivity for airflow monitoring. The proposed airflow sensor has been characterized by exposing various airflow rates applied by an airflow generator with adjustable flow rates. As a potential application, we examined the sensor to detect the respiratory rate in different human activities such as walking, swimming and running. A complete finite-element-based computer model is created using the COMSOL Multiphysics software package using a two-way fluid–structure interaction (FSI) approach to capture flow dynamics around the sensor body and simulate piezoresistive behaviour of the sensor. Simulation results are verified by the experiments conducted using a laser Doppler vibrometer (LDV) system. The experimental and finite-element results demonstrated excellent agreement. Our experimental results revealed a very low response time and high sensitivity for the proposed sensors during various activities, including walking and running with different intensities. This work will pave the way for developing all-polymer-based sensors with high sensitivity for healthcare monitoring.
2. Experimental section
2.1. Airflow sensor design and fabrication
The fabrication process of the VGNs synthesis using the PECVD technique and thorough characterization has been clearly delineated elsewhere [43,44,53]. Figure 1a shows the fabrication process of the airflow sensor based on VGNs/PDMS nanocomposite. Since VGNs are fragile, to peel them off from the substrate (copper foil), liquid PDMS precursor was poured onto the VGNs to enable the infiltration of PDMS into the pores of VGNs. After curing, the VGNs could be successfully peeled off with PDMS from the copper foil. This method can conserve the properties and morphology of the VGNs. To improve the flexibility (i.e. reduce the modulus of the nanocomposite thin film), the weight ratio between the monomer and the curing agent of PDMS (usually 10 : 1) was increased and varied, ranging from 15 : 1, 20 : 1, 25 : 1 to 30 : 1.
Figure 1.

(a) Schematic diagram of the fabrication process; SEM images of VGNs and VGNs/PDMS nanocomposite, (b) top view of VGNs, (c) cross-sectional view of VGNs, (d) carbon buffer layer and (e) cross-sectional view of VGNs/PDMS nanocomposite.
Ultimately, a PDMS weight ratio of 25 : 1 was selected due to great flexibility and high sensitivity to tiny stimuli [43]. VGNs/PDMS film was cut into a rectangular parallelepiped shape with two legs for connecting wires by a laser cutter device to form the flow sensor. Thin copper wires were connected to the two legs on the VGNs surface using conductive silver paste. To make the VGNs/PDMS thin film vertically positioned, the sensor was fixed into a PDMS base (10 : 1 weight ratio).
2.2. Structure of airflow sensor
The analysis of the VGNs network and nanocomposite structure of VGNs and PDMs was conducted by scanning electron microscopy (SEM-JEOL JSM-7100f) characterization. Prior to scanning, the specimens were coated with a thin platinum layer. Then, coated specimens were floated in liquid nitrogen and cross-sectionally cut to study the microstructure.
2.3. Experimental set-up
2.3.1. Piezoresistivity measurements
To observe the piezoresistivity behaviour of the airflow sensor, the rectangular-shaped sample (7.5 mm (height) × 5 mm (width) × 2 mm (thickness)) was prepared and equipped with the electrodes at their two ends. The electrical resistance of the VGNs/PDMS strip under mechanical stretch was measured by a digital multimeter (Keysight LCR meter - E4980). Using a custom-made stretching device, the sample was subjected to mechanical stretch. The relative resistance changes were calculated as follows
| 2.1 |
Where R and Ri are the sensor resistance under mechanical load and the initial resistance under no-load condition (Ri = 7380 Ω), respectively. At the same time, monotonic stretching up to breaking strain was applied to the sample at a constant velocity of 0.1 mm s−1 to measure the sensor strain. The gauge factor of the sensor is calculated by dividing the relative resistance change ΔR/Ri over strain ΔL/Li as follows:
| 2.2 |
Where L and Li signify the length of the sensor and its initial length, respectively.
2.3.2. Airflow sensor characterization
Sensor performance was evaluated using the characterization analysis of VGNs/PDMS nanocomposite at room temperature. Therefore, an experimental set-up has been provided for conducting a set of characterization experiments, as shown in figure 2. The sensor is positioned close to the end of the pliable tube (1 mm far from the tube) connected to a continuous positive airway pressure (CPAP) air generator used to mimic respiratory activities. The accuracy of the CPAP air generator for measures of time and flow is ±10 ms and ±1.5 l min−1 or ±2.7% of the reading. The air generator can be controlled by three main parameters set-point low (SPL), set-point high (SPH) and period (ms). These critical set-up controllers generate airflow to mimic the human respiratory cycle. The internal diameter of the tube was 19.60 mm, while the height of the sensor exposed to the airflow was 5.75 mm. The sensor was directly connected to a Wheatstone bridge circuit and the output voltage of the circuit was filtered with a 1 Hz low-pass filter using a SRS560 low-noise preamplifier with unity gain. The filtered data were collected by a National Instruments (NI) NI-9239 Data Acquisition (DAQ) device. Finally, NI LabVIEW SignalExpress software was used to virtualize data and record it over time. To ensure the reliability of the sensor output, each test was repeated at least three times using three different sensors (nine times in total) to calculate a standard error and show error bars for each test.
Figure 2.

(a) Schematic diagram of the experimental set-up and (b) the set-up indicating electronic devices and wiring.
2.3.3. Laser Doppler vibrometry recordings
LDV is acknowledged as the gold-standard for single-point, non-contact dynamic response measurements and can analyse samples of various sizes from large aerospace parts to micron-sized MEMS or biomedical specimen components. Here, a commercial LDV (Ometron – Type 8338, Denmark) was used to measure the dynamic response of the flow sensor across a range of intensities between 10 and 130 l min−1. The LDV system contained less than 1 mV output power with a He-Ne visible 632.8 nm laser. The system has an RMS threshold below 0.02 µm s with a maximal sensitivity of up to 500 mm s−1 velocity and a frequency range of 0.2 Hz–22 kHz and a dynamic range greater than 90 dB over the full bandwidth. Importantly, the LDV is capable of measuring displacements in the nanometre range, as recently shown from biological recordings of the inner ear in vivo [54]. To measure sensor tip deflections, the LDV was mounted on an isolation stage, and the beam (632 nm; red) was focused onto the front face of the sensor, which contained a cluster of reflective glass microbeads (30 µm diameter; microbeads were adhered via thin layer liquid PDMS prepolymer as glue). The output from the LDV was fed into a preamplifier (×1000) and then into a NI NI-9239 Data Acquisition (DAQ) device, followed by the PC for recording of data via customized LabVIEW programs.
3. Results and discussion
In the present work, the VGNs/PDMS nanocomposite has been used as an airflow sensor for respiration monitoring. For this purpose, the sensor was subjected to a set of experiments to analyse its performance. The main purpose of the characterization analysis is to study flow ranges, response times during loading and unloading, accuracy and sensitivity. Thus, the sensor was exposed to an airflow generator to investigate the sensor response to various airflow rates with SPL = 0, different SPHs and constant period.
3.1. Morphology of vertically grown graphene nanosheets and vertically grown graphene nanosheets/polydimethylsiloxane nanocomposites
Figure 1b–e shows SEM images of VGNs and VGNs/PDMS nanocomposite. Figure 1b indicates the top view of the VGNs, in which the maze-like network of VGNs is distinguished. VGN walls are composed of several layers of graphene nanosheets, so that their thickness was estimated to be around 1–5 nm. According to the cross-section view of the VGNs shown in figure 1c, the VGNs height is about 7 µm. A carbon buffer layer has been identified beneath VGNs (figure 1c,d). Therefore, the reason behind the high conductivity of VGNs is the existence of the maze-like structure of the VGNs and the carbon buffer layer at the bottom of the VGNs. According to figure 1b, there are pores of 100 nm to 1 µm surrounded by the VGNs walls . This allows PDMS to penetrate, creating a flexible and stretchable VGNs/PDMS nanocomposite thin film. Figure 1e shows the cross-section of the VGNs/PDMS nanocomposite in which two distinct layers, including the pure PDMS layer (bottom layer) and the VGNs/PDMS layer (top layer), are distinguishable. Moreover, a very thin carbon buffer layer is formed at the top of the VGNs/PDMS layer.
3.2. Piezoresistive effect of the vertically grown graphene nanosheets/polydimethylsiloxane nanocomposite
The sensor output in terms of the relative resistance change is shown in figure 3. The changes in the sensor resistance under stretching conditions were recorded simultaneously with the changes in strain. As per figure 3, the sensor demonstrates great linearity upon stretching. The slope of the changes in relative resistance and strain, indicating the gauge factor of the sensor, is about 10. The sensor deformation during stretching causes the conductive pathways in the VGNs/PDMS thin film to change; consequently, the resistance increases. In addition to observing the sensor behaviour upon stretching, the gauge factor is a necessary parameter for the simulation part.
Figure 3.
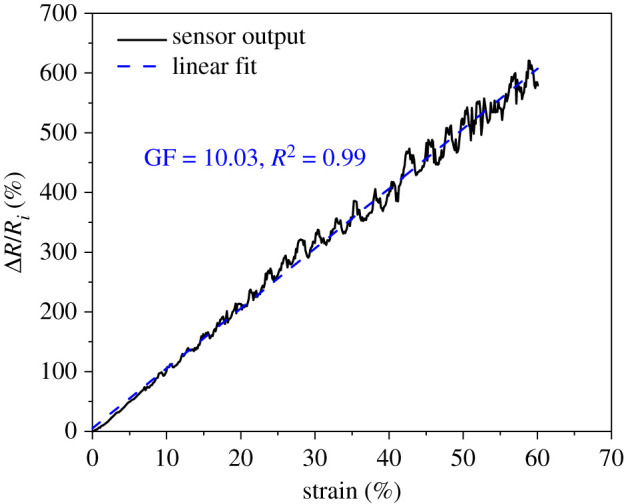
Piezoresistive responses of VGNs/PDMS nanocomposite in terms of relative resistance changes and strain when the sensor is subjected to monotonic stretching.
3.3. Sensor characterization
The sensor was subjected to a wide range of flow rates to model respiration airflow volume from normal activities like walking to exercising. The sensor output in response to various airflow rates is shown in two separate figures (figure 4a,b) to better recognize the effect of low and high airflow rates on sensor performance. Applying flow via the airflow generator causes the sensor to bend, thereby leading to the deformation of the conductive VGNs network. The VGNs network might be stretched, causing the resistance of conducting paths to increase. Therefore, by exposure to airflow, the electrical resistance of the sensor increases. Based on the literature [42], the piezoresistive properties of VGNs/PDMS nanocomposite are controlled by three main mechanisms. Generally, the sensor experiences two stages, including SPH and SPL stages during one period. As mentioned before, since SPL is zero, the sensor is unloaded in this stage, while during SPH stage, the sensor tolerates the highest loading. As shown in figure 4a,b, once the airflow generator is working, the sensor response shoots up from its base value to the maximum after the airflow attains steady-state conditions and after that the sensor witnesses almost constant output. Afterwards, the SPL stage occurs in which the flow rate suddenly reaches zero and the sensor experiences a dramatic plunge in its output. However, the sensor resistance ultimately reaches the point that is somewhat different from its primary resistance and needs time to return its initial resistance owing to the intrinsic viscoelasticity of the PDMS matrix [35,42,44]. This phenomenon is more observable in high flow rates in such a way that a sudden drop in the sensor output is far higher than its surge after applying the flow rate. At low flow rates, the VGNs thin film experiences a slight deformation in the nanostructure of polymer layers and thereby quick recovery.
Figure 4.

(a) Sensor output for low airflow rates and (b) high airflow rates. Sensor output as a function of time in a constant airflow rate of 70 l min−1 for various breathing periods, (c) 100 ms, (d) 200 ms, (e) 400 ms and (f) 600 ms.
The response time of the sensor determines how much time the sensor requires to respond to loading or unloading of applied flow rates. When airflow is applied, the sensor shows a sharp response and reaches a steady-state output, while through the unloading stage (SPL level), the sensor output plummets and comes to the lowest state of output within a short time. The response time to loading and unloading of the VGNs/PDMS airflow sensor is graphically shown in the insets of figure 4a,b. Overall, the sensor's response time is slightly different as the flow rate varies. The time for reaching a steady-state condition for low flow rates is lower than 1.8 s, while the time for returning to its initial state is around 1.4 s. These response time values are lower as the flow rates increase (0.7 s and 0.4 s, respectively). In the case of higher flow rates, the VGNs/PDMS nanocomposite tip can rapidly return to its initial position when the airflow generator is turned off. It causes the sensor to experience a plunge in the sensor output and then return to its initial resistance. This characterization is ideal for monitoring activities such as running, where the sensor is exposed to higher flow rates.
The sensor's ability to monitor breathing within a range of high breathing frequencies (low breathing period) was experimentally studied. For these experiments, SPH was kept constant at 70 l min−1, while the breathing period was varied from 100 ms to 600 ms, as shown in figure 4c–f. According to these results, the sensor can detect breathing patterns with very low breathing periods, like 100 ms. Moreover, during five consecutive cycles, the sensor has a roughly constant amplitude and a repeatable waveshape. By increasing the period, the sensor is subjected to a specific flow rate for a longer time; therefore, the sensor output increases to approach its maximum response to 70 l min−1 airflow rate.
3.3.1. Finite-element analysis
Numerical simulation of the sensor provides insights into the physics and operation of the sensor by giving information about the deflection profile, sensitivity and linearity of the sensor. In this work, finite-element simulations are implemented in COMSOL Multiphysics software. Most of the simulation works existing in the literature focus on the displacement of mechanical structures in response to fluid injection. In this work, the piezoresistive effect, as well as FSI, is numerically simulated. To this end, three different physics are coupled together: fluid dynamics that solves Navier–Stokes equation for simulating the airflow, structural mechanics that calculates the deformation of the structure due to fluid forces, and the electrical part, which calculates the current through VGNs.
In the simulation, air is injected from a tube with a diameter of 2 mm. The sensor dimensions are the same as the real sensor. The sensor is located at 1 mm distance from the injection tube and 5.75 mm of the sensor height is subjected to the airflow. Since the thickness of the VGN part of the sensor is smaller than that of the PDMS, it is considered to be a 2D film with negligible thickness on the surface of the PDMS.
The mechanical properties and dimensions of the flow sensor are presented in table 1. Two essential parameters for simulation include Young's modulus and flexural modulus. According to table 1, flexural modulus and Young's modulus of the pure PDMS layer are precisely the same, 173 kPa [43] owing to its homogeneous structure, while adding VGNs thin film to the PDMS layer causes the flexural modulus (4800 kPa) to differ from Young's modulus (173 kPa) due to maze-like network of VGNs and its non-homogeneous structure. Surprisingly, applying tension to the PDMS layer and VGNs/PDMS nanocomposite shows equal values for Young's modulus and flexural modulus.
Table 1.
Mechanical properties and dimensions of VGNs/PDMS nanocomposite and pure PDMS layer.
| materials | Young's modulus (kPa) | flexural modulus (kPa) | thickness (mm) | width (mm) | height (mm) |
|---|---|---|---|---|---|
| PDMS layer + VGNs/PDMS thin film | 173 | 4800 | 0.5 | 1.58 | 7.91 |
| PDMS layer | 173 | 173 | 0.5 | 1.58 | 7.91 |
For the simulation of the piezoresistive effect, two parameters should be defined: the conductivity of the sensor at the rest condition, and the gauge factor, which relates the electrical conductivity to mechanical strain. These parameters are also evaluated from the experimental measurement. The electrical conductivity of VGNs thin film and the gauge factor of the sensor are 29 S m−1 and 10, respectively.
Air is assumed to be injected from the left boundary to the simulation domain. Since, in practice, the injection tube is long, the boundary condition for the inlet air is fully developed. A zero-pressure boundary condition is applied to the outlet boundary. Two electric contacts separated by 0.5 mm are in the bottom of the sensor. A constant potential difference is applied between electric contacts and the electrical resistance is calculated by evaluating the current. Figure 5a shows the cross-section of the air velocity profile and the simulation domain for the injection rate of 130 l min−1. As seen, the sensor deflects in response to the incident air.
Figure 5.

(a) Velocity contour and streamlines at a flow rate of 130 l min−1 (boundaries 1, 2 and 3 in the figure represent wall, open boundary and velocity inlet, respectively), (b) schematic of the experimental set-up for LDV recordings of sensor tip velocity, (c) 10 s recording window of raw LDV velocity data (blue), and its integral, displacement (red). LDV recordings of sensor tip displacement averaged into one cycle for flow rates between 10 and 130 l min−1. Note: the onset of the displacement response was used to quantify LDV recording values, (d) sensor tip displacement as a function of flow rate for both simulation and LDV recordings. The sensor deflection is schematically illustrated at 30, 60, 90 and 120 l min−1 flow rates. The red dash line represents a polynomial regression of the simulation data based on the equation y = αx2, while the blue dashed line represents LDV displacement measurements, which are in good agreement with the Simulation data.
The maximum deflection of the sensor versus injection rate is depicted in figure 5b. At lower airflow rates, the sensor's maximum deflection varies quadratically with injected flow rate. By increasing the air injection rate, the effective cross-section of the sensor subjected to the airflow is reduced, which in turn slows down the sensor response to the injection rate. Consequently, the deflection versus injection rate curve deviates from quadratic characteristic at higher flow rates. The sensor deflection is schematically illustrated at 30, 60, 90 and 120 l min−1 flow rates.
Direct measures of sensor tip displacement using LDV (figure 5b–d) demonstrate very good agreement with the simulation data for sensor deflection (figure 5d), with slight divergence at flow rates above 100 l min−1. This divergence at higher CPAP flow intensities may suggest a saturating nonlinearity of the sensor's mechanical response, which may be due to the material properties of the sensor, such as its stiffness and elasticity. However, this did not result in a saturation of sensor voltage output. It is also likely that at high intensities (e.g. 120–130 l min−1), considerable front–back displacements of the sensor shifted the locus of the laser point, which may have slightly reduced the signal strength, leading to a deviation from simulated values. Additionally, there was also higher harmonic component noise in the raw LDV signal (figure 5c), which was filtered via the preamplifier, and offline via customized LabVIEW programs using digital second-order Butterworth filters. This may have had the result of altering the LDV displacement values at high flow rates compared to numerical values.
Ultimately, the sensor output as a function of flow rate obtained from experiment and simulation is depicted in figure 6. The obtained results indicate that simulation results (black curve) perfectly agree with experimental data (red curve). The slope of the linear fit (blue dashed line) to experimental data represents the sensor's sensitivity being equal to 0.96 mV (l/min)−1.
Figure 6.
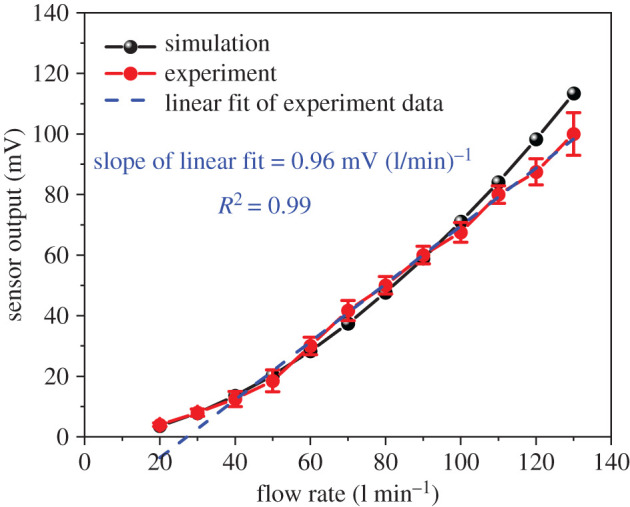
Sensor output as a function of flow rate obtained from simulation (black line) and experiment (red line). A linear regression of the experimental data represents the sensor sensitivity (blue dashed line).
The overall performance of an airflow sensor can be investigated in terms of four important factors, including the sensor dimension, detection range and sensitivity (table 2). The response time of the proposed airflow sensor is below 1 s, which is suitable for biomedical applications. The flow velocity detected by the sensor can be calculated by the internal diameter of the airflow generator's tube. Thus, the flow rate (l min−1) can be converted to flow velocity (m s−1) for comparison.
Table 2.
Sensor performance comparison in terms of threshold velocity, sensitivity and sensor height.
| sensing element material | configuration | height (mm) | detection range (m s−1) | sensitivity (mV (m/s)−1) | references |
|---|---|---|---|---|---|
| LCP-sensing membrane | piezoresistive | 2 | 0.1–10 | 3.695 | [55] |
| P type Si piezoresistor | piezoresistive | 1 | 20–40 | 0.204 | [56] |
| PVDF microfibres | piezoelectric | 50 | 3.9–15.6 | 83.3 | [57] |
| PVDF cantilever | piezoelectric | 30 | 4.3–10.6 | 20 | [58] |
| VGNs/PDMS | piezoresistive | 5.75 | 1–7 | 17.38 | this work |
3.4. Application of the airflow sensor
The primary purpose of using this nanocomposite as an airflow sensor is to monitor the respiration cycles during human activities like walking, jogging and running. To simulate the human respiratory patterns, two main parameters including ventilation (number of breaths per minute) and tidal volume (air volume moving in and out from lungs through inhalation and exhalation) have been extracted from the literature [59], as presented in table 3. Tsega et al. [59] took five healthy men (mean age: 29.6 years) to monitor the respiration pattern of different levels of physical activities, including walking (4 km h−1), jogging (7 km h−1) and running (10 km h−1) by traversing a fixed distance of 500 m. According to these data, SPH is calculated by multiplying tidal volume by ventilation, and the period of one respiration cycle is the time of one breathing cycle (equal to 60 divided by ventilation) to apply the information to the air generator to simulate some cardio exercises and determine the sensor performance at room temperature.
Table 3.
Breathing parameters in response to different human activities.
Figure 7 presents the sensor response to three cardio exercises, walking, jogging and running, during five consecutive cycles. As shown in figure 7a, the sensor response to running is more extensive than walking and jogging due to its high SPH compared to the two other exercises. In addition, because of the low period, the sensor is likely not to reach its maximum response. The obtained results demonstrate that the sensor shows a stable reaction and roughly the same pattern while doing exercises. During these tests, response time and recovery time were very low and constant, and the sensor could quickly recover its base resistance.
Figure 7.

(a) The VGNs/PDMS airflow sensor in response to different human activities such as walking (4 km h−1), jogging (7 km h−1) and running (10 km h−1) and (b) the sensor response to different airflow rates with a constant breathing period.
Another experiment is to model the state of dyspnoea (shortness of breath) due to heart or lung dysfunctions or heavy breathing due to anxiety or panic through which the body tries to enter a high volume of air into the lungs during a short respiration period. Figure 7b shows the sensor performance on different breathing volumes, 50, 60, 70, 80, 90 l min−1, within a period of 2 s. The results show a uniform performance of the sensor during each respiration cycle. Moreover, the sensor experiences a linear response during a constant breathing period with increasing the breathing flow rate. It is worth noting that the exhalation period for each cycle in which the sensor is subjected to a fixed airflow rate is constant and roughly 1 s; following that, the sensor recovers itself and reaches its base during 1 s. It proves that this sensor has outstanding performance, stable response during various breathing volumes and very low response time and recovery time.
4. Conclusion
In this work, we used a graphene/polymer-nanocomposite-based flow sensor as an airflow sensor for monitoring human respiration. This airflow sensor is made of a highly conductive maze-like network of vertically oriented graphene nanosheets integrated with PDMS (25 : 1 weigh ratio of prepolymer and curing agent). The characterization process of the sensor was conducted by a set of experiments to evaluate sensor performance when the sensor is subjected to various airflow rates. Response time of the sensor to applied flow rates and its unloading behaviour was studied, and it turns out that the maximum response time to loading and unloading is 1.8 s and 1.4 s, respectively. It is shown that the sensor can detect the airflow rates from 20 to 130 l min−1, which falls within the range of human normal activities and exercises. The sensitivity of the sensor was measured to be 0.96 mV (l/min)−1 (or 17.38 mV (m/s)−1) when the sensor is subjected to various flow rates. Compared to the literature, the proposed airflow sensor in terms of sensor height, sensitivity and detection range demonstrates great performance.
To evaluate the experimental results and better understand the flow dynamics adjacent to the sensor and sensor tip displacement, finite-element simulations were designed through the COMSOL Multiphysics package. The piezoresistive effect and FSI were numerically investigated. These simulations verified the sensitivity and linearity of the sensor performance measured by experiments, and direct measurements of sensor tip displacement using LDV confirmed the excellent agreement with numerical approaches. Eventually, the proposed sensor was used to monitor respiration patterns during exercises such as walking, jogging and running. The sensor shows a stable response, low response time and recovery time during consecutive cycles for monitoring respiration when shortness of breathing happens.
Acknowledgement
We would like to acknowledge the Australian Research Council (ARC) for their financial support.
Contributor Information
Majid Sanaeepur, Email: m-sanaeepur@araku.ac.ir.
Mohsen Asadnia, Email: mohsen.asadnia@mq.edu.au.
Data accessibility
This article has no additional data.
Authors' contributions
S.A.M. collected the data, carried out the experiments and participated in data collection, visualization and writing the original draft. A.A. participated in simulations and modelling; M.S. participated in the investigation, supervision, validation, simulation, modelling and writing, review and editing. C.P. carried out the experiments and helped with writing the original draft. Z.J.H. and S.W. participated in material preparation and experiments. M.A. conceived of the study, designed the experiments, coordinated the project and helped draft the manuscript. All authors gave final approval for publication and agreed to be held accountable for the work performed therein.
Competing interests
We declare we have no competing interests.
Funding
This research was supported by Discovery Early Career Researcher Awards, grant nos. DE180100688 and DE170100284.
References
- 1.Dai J, Zhao H, Lin X, Liu S, Liu Y, Liu X, Fei T, Zhang T. 2019. Ultrafast response polyelectrolyte humidity sensor for respiration monitoring. ACS Appl. Mater. Interfaces 11, 6483-6490. ( 10.1021/acsami.8b18904) [DOI] [PubMed] [Google Scholar]
- 2.AL-Khalidi FQ, Saatchi R, Burke D, Elphick H, Tan S. 2011. Respiration rate monitoring methods: a review. Pediatr. Pulmonol. 46, 523-529. ( 10.1002/ppul.21416) [DOI] [PubMed] [Google Scholar]
- 3.Fieselmann JF, Hendryx MS, Helms CM, Wakefield DS. 1993. Respiratory rate predicts cardiopulmonary arrest for internal medicine inpatients. J. Gen. Intern. Med. 8, 354-360. ( 10.1007/BF02600071) [DOI] [PubMed] [Google Scholar]
- 4.Subbe C, Davies R, Williams E, Rutherford P, Gemmell L. 2003. Effect of introducing the Modified Early Warning score on clinical outcomes, cardio-pulmonary arrests and intensive care utilization in acute medical admissions. Anaesthesia 58, 797-802. ( 10.1046/j.1365-2044.2003.03258.x) [DOI] [PubMed] [Google Scholar]
- 5.Cretikos M, Chen J, Hillman K, Bellomo R, Finfer S, Flabouris A, Investigators MS. 2007. The objective medical emergency team activation criteria: a case–control study. Resuscitation 73, 62-72. ( 10.1016/j.resuscitation.2006.08.020) [DOI] [PubMed] [Google Scholar]
- 6.Massaroni C, Nicolò A, Sacchetti M, Schena E. 2020. Contactless methods for measuring respiratory rate: a review. IEEE Sensors J. 21, 12 821-12 839. ( 10.1109/JSEN.2020.3023486) [DOI] [Google Scholar]
- 7.Massaroni C, Nicolò A, Lo Presti D, Sacchetti M, Silvestri S, Schena E. 2019. Contact-based methods for measuring respiratory rate. Sensors 19, 908. ( 10.3390/s19040908) [DOI] [PMC free article] [PubMed] [Google Scholar]
- 8.Schena E, Massaroni C, Saccomandi P, Cecchini S. 2015. Flow measurement in mechanical ventilation: a review. Med. Eng. Phys. 37, 257-264. ( 10.1016/j.medengphy.2015.01.010) [DOI] [PubMed] [Google Scholar]
- 9.Hurtado DE, Abusleme A, Chávez JA. 2019. Non-invasive continuous respiratory monitoring using temperature-based sensors. J. Clin. Monit. Comput. 34, 223-231. ( 10.1007/s10877-019-00329-5) [DOI] [PubMed] [Google Scholar]
- 10.Sovijarvi A, Dalmasso F, Vanderschoot J, Malmberg L, Righini G, Stoneman S. 2000. Definition of terms for applications of respiratory sounds. Eur. Res. Rev. 10, 597-610. [Google Scholar]
- 11.Joyashiki T, Wada C. 2020. Validation of a body-conducted sound sensor for respiratory sound monitoring and a comparison with several sensors. Sensors 20, 942. ( 10.3390/s20030942) [DOI] [PMC free article] [PubMed] [Google Scholar]
- 12.Pang Y, et al. 2018. Wearable humidity sensor based on porous graphene network for respiration monitoring. Biosens. Bioelectron. 116, 123-129. ( 10.1016/j.bios.2018.05.038) [DOI] [PubMed] [Google Scholar]
- 13.Xie R, et al. 2019. Wearable leather-based electronics for respiration monitoring. ACS Appl. Bio Mater. 2, 1427-1431. ( 10.1021/acsabm.9b00082) [DOI] [PubMed] [Google Scholar]
- 14.Hagihghi R, Razmjou A, Orooji Y, Warkiani ME, Asadnia MA. 2020. A miniaturized piezoresistive flow sensor for real-time monitoring of intravenous infusion. J. Biomed. Mater. Res. Part B 108, 568-576. ( 10.1002/jbm.b.34412) [DOI] [PubMed] [Google Scholar]
- 15.Chu M, et al. 2019. Respiration rate and volume measurements using wearable strain sensors. npj Digital Med. 2, 8. ( 10.1038/s41746-019-0083-3) [DOI] [PMC free article] [PubMed] [Google Scholar]
- 16.Ejeian F, Etedali P, Mansouri-Tehrani HA, Soozanipour A, Low ZX, Asadnia M, Taheri-Kafrani A, Razmjou A. 2018. Biosensors for wastewater monitoring: a review. Biosens. Bioelectron. 118, 66-79. ( 10.1016/j.bios.2018.07.019) [DOI] [PubMed] [Google Scholar]
- 17.Ejeian F, Azadi S, Razmjou A, Orooji Y, Kottapalli A, Warkiani ME, Asadnia M. 2019. Design and applications of MEMS flow sensors: a review. Sens. Actuators A 295, 483-502. ( 10.1016/j.sna.2019.06.020) [DOI] [Google Scholar]
- 18.Wang S, et al. 2019. An integrated flexible self-powered wearable respiration sensor. Nano Energy 63, 103829. ( 10.1016/j.nanoen.2019.06.025) [DOI] [Google Scholar]
- 19.Nam Y, Reyes BA, Chon KH. 2015. Estimation of respiratory rates using the built-in microphone of a smartphone or headset. IEEE J. Biomed. Health Informatics 20, 1493-1501. ( 10.1109/JBHI.2015.2480838) [DOI] [PubMed] [Google Scholar]
- 20.Hu MH, Zhai GT, Li D, Fan YZ, Chen XH, Yang XK. 2017. Synergetic use of thermal and visible imaging techniques for contactless and unobtrusive breathing measurement. J. Biomed. Opt. 22, 036006. ( 10.1117/1.JBO.22.3.036006) [DOI] [PubMed] [Google Scholar]
- 21.Massaroni C, Cassetta E, Silvestri S. 2017. A novel method to compute breathing volumes via motion capture systems: design and experimental trials. J. Appl. Biomech. 33, 361-365. ( 10.1123/jab.2016-0271) [DOI] [PubMed] [Google Scholar]
- 22.Massaroni C, Lo Presti D, Formica D, Silvestri S, Schena E. 2019. Non-contact monitoring of breathing pattern and respiratory rate via RGB signal measurement. Sensors 19, 2758. ( 10.3390/s19122758) [DOI] [PMC free article] [PubMed] [Google Scholar]
- 23.Lee YC, Syakura A, Khalil MA, Wu CH, Ding YF, Wang CW. 2021. A real-time camera-based adaptive breathing monitoring system. Med. Biol. Eng. Comput. 59, 1285-1298. ( 10.1007/s11517-021-02371-5) [DOI] [PMC free article] [PubMed] [Google Scholar]
- 24.Lorato I, Stuijk S, Meftah M, Kommers D, Andriessen P, van Pul C, de Haan G. 2021. Towards continuous camera-based respiration monitoring in infants. Sensors 21, 2268. ( 10.3390/s21072268) [DOI] [PMC free article] [PubMed] [Google Scholar]
- 25.Wang Y, Wang L, Yang T, Li X, Zang X, Zhu M, Wang K, Wu D, Zhu H. 2014. Wearable and highly sensitive graphene strain sensors for human motion monitoring. Adv. Funct. Mater. 24, 4666-4670. ( 10.1002/adfm.201400379) [DOI] [Google Scholar]
- 26.Zhang H, et al. 2019. Waist-wearable wireless respiration sensor based on triboelectric effect. Nano Energy 59, 75-83. ( 10.1016/j.nanoen.2019.01.063) [DOI] [Google Scholar]
- 27.Ding X, Cao H, Zhang X, Li M, Liu Y. 2018. Large scale triboelectric nanogenerator and self-powered flexible sensor for human sleep monitoring. Sensors 18, 1713. ( 10.3390/s18061713) [DOI] [PMC free article] [PubMed] [Google Scholar]
- 28.Chiu YY, Lin WY, Wang HY, Huang SB, Wu MH. 2013. Development of a piezoelectric polyvinylidene fluoride (PVDF) polymer-based sensor patch for simultaneous heartbeat and respiration monitoring. Sens. Actuators A 189, 328-334. ( 10.1016/j.sna.2012.10.021) [DOI] [Google Scholar]
- 29.So S, Jain D, Kanayama N. 2021. Piezoelectric sensor-based continuous monitoring of respiratory rate during sleep. J. Med. Biol. Eng. 41, 241-250. ( 10.1007/s40846-021-00602-6) [DOI] [Google Scholar]
- 30.Asadnia M, Kottapalli AGP, Miao J, Warkiani ME, Triantafyllou MS. 2015. Artificial fish skin of self-powered micro-electromechanical systems hair cells for sensing hydrodynamic flow phenomena. J. R. Soc. Interface 12, 20150322. ( 10.1098/rsif.2015.0322) [DOI] [PMC free article] [PubMed] [Google Scholar]
- 31.Asadnia M, Kottapalli A, Miao J, Randles A, Sabbagh A, Kropelnicki P, Tsai JM. 2013. High temperature characterization of PZT (0.52/0.48) thin-film pressure sensors. J. Micromech. Microeng. 24, 015017. ( 10.1088/0960-1317/24/1/015017) [DOI] [Google Scholar]
- 32.Sharma S, Chhetry A, Sharifuzzaman M, Yoon H, Park JY. 2020. Wearable capacitive pressure sensor based on MXene composite nanofibrous scaffolds for reliable human physiological signal acquisition. ACS Appl. Mater. Interfaces 12, 22 212-22 224. ( 10.1021/acsami.0c05819) [DOI] [PubMed] [Google Scholar]
- 33.Jun Z, Chun-na L, Wen-liang Z, Hong Z, Yong-feng L, Xue-feng H. 2020. Wearable respiratory strain monitoring system based on textile-based capacitive strain sensor. J. Phys. Conf. Ser. 1570, 012033. [Google Scholar]
- 34.Wu S, Peng S, Yu Y, Wang CH. 2020. Strategies for designing stretchable strain sensors and conductors. Adv. Mater. Technol. 5, 1900908. ( 10.1002/admt.201900908) [DOI] [Google Scholar]
- 35.Amjadi M, Kyung KU, Park I, Sitti M. 2016. Stretchable, skin-mountable, and wearable strain sensors and their potential applications: a review. Adv. Funct. Mater. 26, 1678-1698. ( 10.1002/adfm.201504755) [DOI] [Google Scholar]
- 36.Han ST, Peng H, Sun Q, Venkatesh S, Chung KS, Lau SC, Zhou Y, Roy V. 2017. An overview of the development of flexible sensors. Adv. Mater. 29, 1700375. ( 10.1002/adma.201700375) [DOI] [PubMed] [Google Scholar]
- 37.Zheng Q, Lee JH, Shen X, Chen X, Kim JK. 2020. Graphene-based wearable piezoresistive physical sensors. Mater. Today 36, 158-179. ( 10.1016/j.mattod.2019.12.004) [DOI] [Google Scholar]
- 38.Yang H, Xue T, Li F, Liu W, Song Y. 2019. Graphene: diversified flexible 2D material for wearable vital signs monitoring. Adv. Mater. Technol. 4, 1800574. ( 10.1002/admt.201800574) [DOI] [Google Scholar]
- 39.Sanaeepour M, Abedi A, Sharifi MJ. 2017. Performance analysis of nanoscale single layer graphene pressure sensors. IEEE Trans. Electron Devices 64, 1300-1304. ( 10.1109/TED.2017.2656944) [DOI] [Google Scholar]
- 40.Jiang L, Fan Z. 2014. Design of advanced porous graphene materials: from graphene nanomesh to 3D architectures. Nanoscale 6, 1922-1945. ( 10.1039/C3NR04555B) [DOI] [PubMed] [Google Scholar]
- 41.Bai J, Zhong X, Jiang S, Huang Y, Duan X. 2010. Graphene nanomesh. Nat. Nanotechnol. 5, 190-194. ( 10.1038/nnano.2010.8) [DOI] [PMC free article] [PubMed] [Google Scholar]
- 42.Wu S, Ladani RB, Zhang J, Ghorbani K, Zhang X, Mouritz AP, Kinloch AJ, Wang CH. 2016. Strain sensors with adjustable sensitivity by tailoring the microstructure of graphene aerogel/PDMS nanocomposites. ACS Appl. Mater. Interfaces 8, 24 853-24 861. ( 10.1021/acsami.6b06012) [DOI] [PubMed] [Google Scholar]
- 43.Abolpour Moshizi S, Azadi S, Belford A, Razmjou A, Wu S, Han ZJ, Asadnia M. 2020. Development of an ultra-sensitive and flexible piezoresistive flow sensor using vertical graphene nanosheets. Nano-Micro Lett. 12, 1-18. ( 10.1007/s40820-020-00446-w) [DOI] [PMC free article] [PubMed] [Google Scholar]
- 44.Wu S, Peng S, Han ZJ, Zhu H, Wang CH. 2018. Ultrasensitive and stretchable strain sensors based on mazelike vertical graphene network. ACS Appl. Mater. Interfaces 10, 36 312-36 322. ( 10.1021/acsami.8b15848) [DOI] [PubMed] [Google Scholar]
- 45.Ahmadi H, Moradi H, Pastras CJ, Abolpour Moshizi S, Wu S, Asadnia M. 2021. Development of ultrasensitive biomimetic auditory hair cells based on piezoresistive hydrogel nanocomposites. ACS Appl. Mater. Interfaces 13, 44 904-44 915. ( 10.1021/acsami.1c12515) [DOI] [PubMed] [Google Scholar]
- 46.Moshizi SA, Moradi H, Wu S, Han ZJ, Razmjou A, Asadnia M. 2021. Biomimetic ultraflexible piezoresistive flow sensor based on graphene nanosheets and PVA hydrogel. Adv. Mater. Technol. 2100783. ( 10.1002/admt.202100783) [DOI] [Google Scholar]
- 47.Lee BM, Loh KJ. 2017. Carbon nanotube thin film strain sensors: comparison between experimental tests and numerical simulations. Nanotechnology 28, 155502. ( 10.1088/1361-6528/aa6382) [DOI] [PubMed] [Google Scholar]
- 48.Chong YS, Yeoh KH, Leow PL, Chee PS. 2018. Piezoresistive strain sensor array using polydimethylsiloxane-based conducting nanocomposites for electronic skin application. Sensor Rev. 38, 494-500. ( 10.1108/SR-11-2017-0238) [DOI] [Google Scholar]
- 49.Gbaguidi A, Namilae S, Kim D. 2018. Monte Carlo model for piezoresistivity of hybrid nanocomposites. J. Eng. Mater. Technol. 140, 011007. ( 10.1115/1.4037024) [DOI] [Google Scholar]
- 50.Lu X, Detrez F, Yvonnet J, Bai J. 2019. Multiscale study of influence of interfacial decohesion on piezoresistivity of graphene/polymer nanocomposites. Modell. Simul. Mater. Sci. Eng. 27, 035001. ( 10.1088/1361-651X/aafa58) [DOI] [Google Scholar]
- 51.Yang H, Yuan L, Yao X, Fang D. 2020. Piezoresistive response of graphene rubber composites considering the tunneling effect. J. Mech. Phys. Solids 139, 103943. ( 10.1016/j.jmps.2020.103943) [DOI] [Google Scholar]
- 52.Lebedev OV, Ozerin AN, Abaimov SG. 2021. Multiscale numerical modeling for prediction of piezoresistive effect for polymer composites with a highly segregated structure. Nanomaterials 11, 162. ( 10.3390/nano11010162) [DOI] [PMC free article] [PubMed] [Google Scholar]
- 53.Han ZJ, Pineda S, Murdock AT, Seo DH, Ostrikov KK, Bendavid A. 2017. RuO 2-coated vertical graphene hybrid electrodes for high-performance solid-state supercapacitors. J. Mater. Chem. A 5, 17 293-17 301. ( 10.1039/C7TA03355A) [DOI] [Google Scholar]
- 54.Pastras CJ, Stefani SP, Curthoys IS, Camp AJ, Brown DJ. 2020. Utricular sensitivity during hydrodynamic displacements of the Macula. J. Assoc. Res. Otolaryngol. 21, 409-423. ( 10.1007/s10162-020-00769-w) [DOI] [PMC free article] [PubMed] [Google Scholar]
- 55.Kottapalli AGP, Tan CW, Olfatnia M, Miao JM, Barbastathis G, Triantafyllou M. 2011. A liquid crystal polymer membrane MEMS sensor for flow rate and flow direction sensing applications. J. Micromech. Microeng. 21, 085006. ( 10.1088/0960-1317/21/8/085006) [DOI] [Google Scholar]
- 56.Dhonkal AK, Agarwal V, Sengar K. 2017. Sensitivity of the MEMS based piezoresistive wind speed sensor with comparative study of different shapes of paddles. Int. Res. J. Eng. Technol. 4, 1693-1697. [Google Scholar]
- 57.Fuh YK, Chen PC, Huang ZM, Ho HC. 2015. Self-powered sensing elements based on direct-write, highly flexible piezoelectric polymeric nano/microfibers. Nano Energy 11, 671-677. ( 10.1016/j.nanoen.2014.10.038) [DOI] [Google Scholar]
- 58.Raoufi MA, Moshizi SA, Razmjou A, Wu S, Warkiani ME, Asadnia MJISJ. 2019. Development of a biomimetic semicircular canal with MEMS sensors to restore balance. 19, 11 675-11 686. ( 10.1109/JSEN.2019.2935480) [DOI] [Google Scholar]
- 59.Tsega EG, Katiyar V, Gupta P. 2019. Breathing patterns of healthy human response to different levels of physical activity. J. Biomed. Eng. Technol. 7, 1-4. ( 10.12691/jbet-7-1-1) [DOI] [Google Scholar]
Associated Data
This section collects any data citations, data availability statements, or supplementary materials included in this article.
Data Availability Statement
This article has no additional data.