Abstract
This study reviews the participation of racial and ethnic populations at US sites in 2015-2019 to understand the extent to which US trial participation represents the diversity of the US population.
Concerns have been raised over racial and ethnic representation in clinical trials. In 2015, the US Food and Drug Administration (FDA) launched the Drug Trials Snapshots program, a transparency initiative highlighting demographics in the pivotal clinical trials that supported FDA approval of new molecular entities or original biologics. Recently, the FDA published a summary report of aggregated global demographic data from the trials that were the basis for snapshots published between 2015 and 2019.1 Using that database, we reviewed the participation of racial and ethnic populations at US sites to understand the extent to which US trial participation represents the diversity of the US population.
Methods
Pooled demographic data from pivotal clinical trials of new molecular entities and original biologics published between 2015 and 2019 were reviewed for self-reported race and ethnicity in all trials and grouped based on definitions outlined in the FDA guidance2 into the following categories: American Indian or Alaska Native, Asian, Black or African American, White, and other (see Figure 1 for definition) for race, and Hispanic or Latino or not Hispanic or Latino for ethnicity. The FDA recommends separate reporting of race and ethnicity.2 Trial site information was collected from the site identification listings within each trial report and used to define the US population subset. Yearly Census data were obtained from the US Census Bureau.3 Data were analyzed descriptively, comparing mean and yearly proportions in the trial and Census data, and visualized using Excel software version 365 ProPlus (Microsoft).
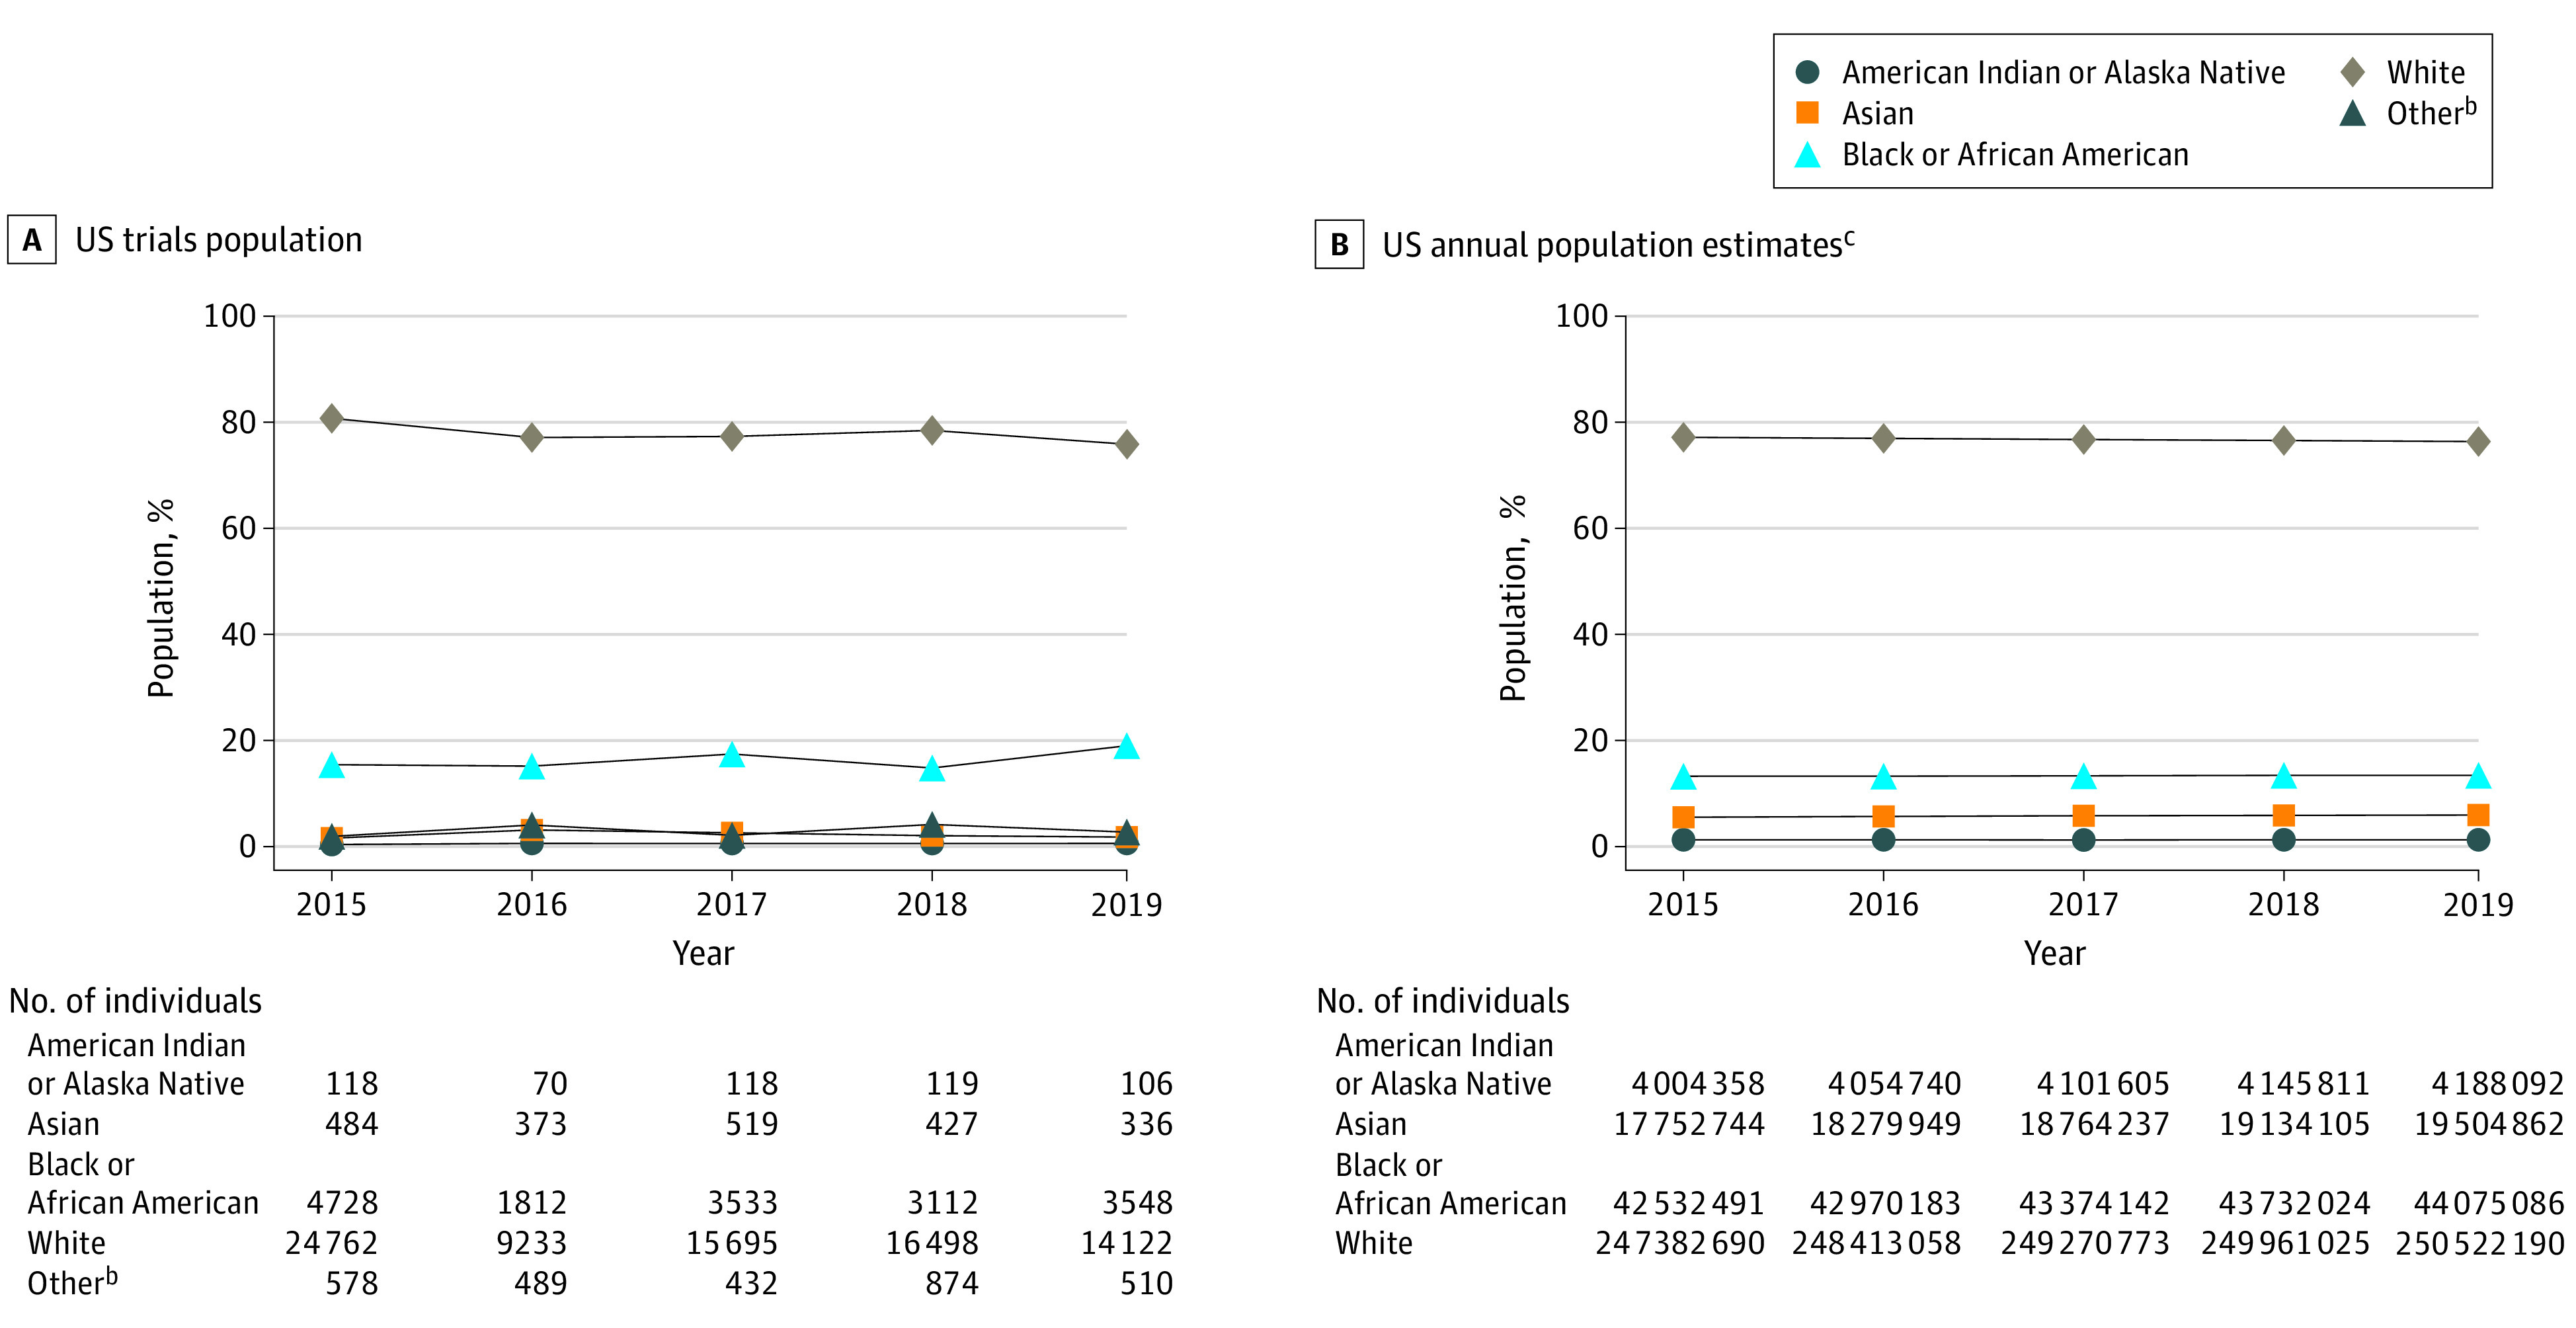
Figure 1. Participants in Pivotal Trials Compared With Racial Breakdown of the US Population by Yeara.

aPer the US Food and Drug Administration (FDA) report Collection, Analysis, and Availability of Demographic Subgroup Data for FDA-Approved Medical Products, August 2013, the FDA defines pivotal clinical trials as clinical investigations designed to collect definitive evidence of the safety and effectiveness of a medical product for a specified intended use (https://www.fda.gov/files/about%20fda/published/Collection–Analysis–and-Availability-of-Demographic-Subgroup-Data-for-FDA-Approved-Medical-Products.pdf).
bDue to small percentages, the “other” category combines Native Hawaiian or Other Pacific Islander, unknown/unreported/missing, other race, and multiracial.
cThe percentages of the categories Native Hawaiian or Other Pacific Islander and 2 or more races are not presented in the graph. However, absolute values from the US Census population estimates are included in calculating percentages for all other races.
Results
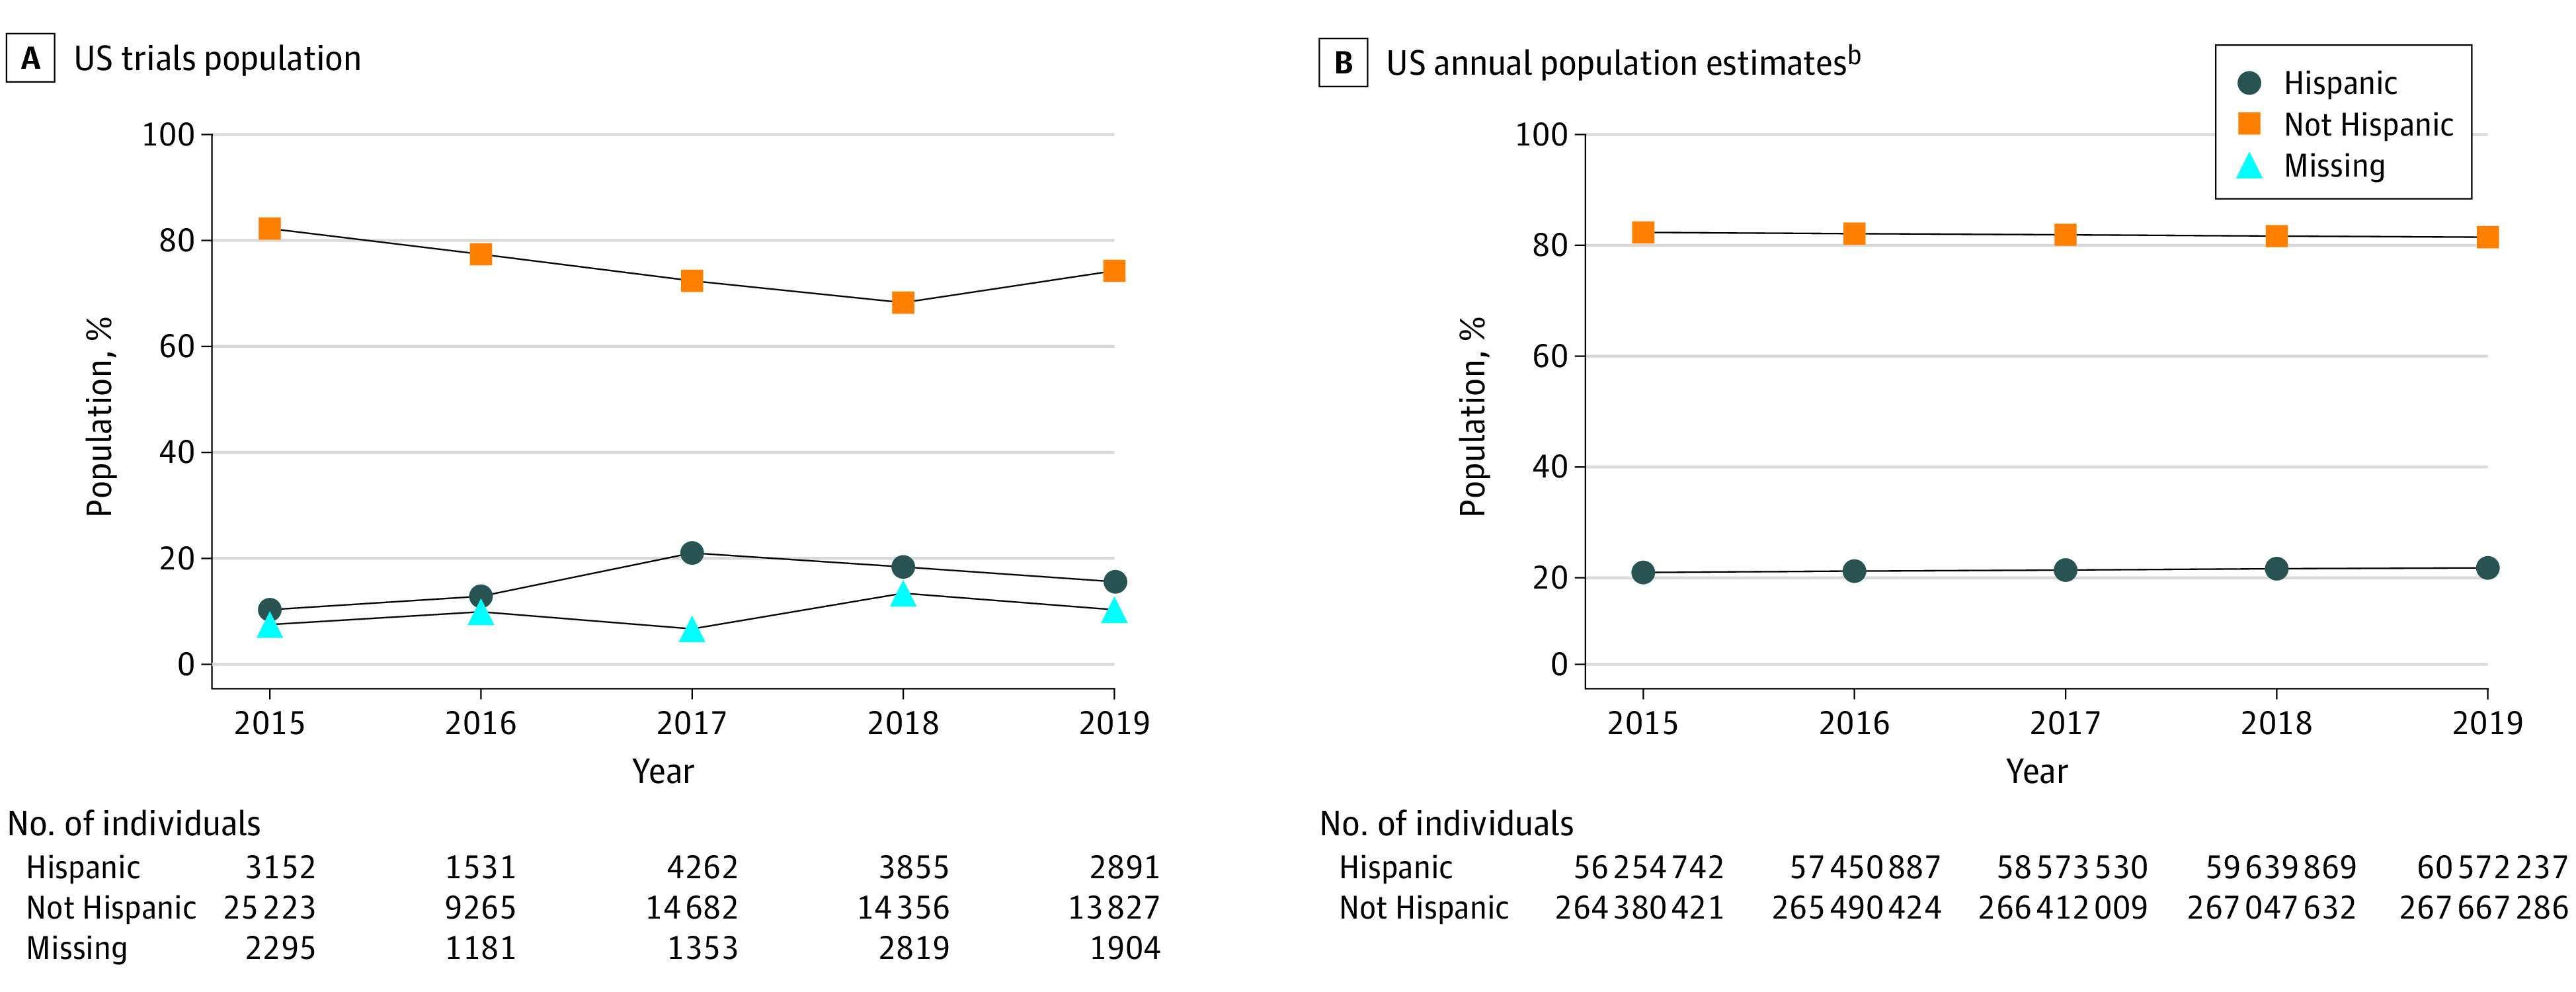
From 517 trials, we identified 102 596 participants from US sites, accounting for 35% of the total 292 766 participants globally. The proportion of Black or African American participants ranged from 15% to 19% (mean, 16.3% vs Census, 13.4%), with yearly participation rates that were consistently at or above the Census level. The proportion of Asian participants ranged from 2% to 3% (mean, 1.6% vs Census, 5.9%) and for American Indian or Alaska Native participants from 0.4% to 0.6% (mean, 0.52% vs Census, 1.3%). Yearly participation rates were lower than the Census level for both groups. The proportion of White participants ranged from 76% to 81% (mean, 78.3% vs Census, 76.3%), with yearly participation rates lower than the Census level in 1 of 5 years (Figure 1). Hispanic or Latino participation ranged from 10% to 21% (mean, 15.3% vs Census, 18.5%), with yearly participation rates lower than the Census level in 3 of 5 years. Approximately 7% to 13% of ethnicity data were missing (Figure 2).
Figure 2. Participants in Pivotal Trials Compared With Ethnicity Breakdown of the US Population by Yeara.

aPer the US Food and Drug Administration (FDA) report Collection, Analysis, and Availability of Demographic Subgroup Data for FDA-Approved Medical Products, August 2013, the FDA defines pivotal clinical trials as clinical investigations designed to collect definitive evidence of the safety and effectiveness of a medical product for a specified intended use (https://www.fda.gov/files/about%20fda/published/Collection–Analysis–and-Availability-of-Demographic-Subgroup-Data-for-FDA-Approved-Medical-Products.pdf).
bThere were no values for missing ethnicity data in US Census estimates.
Discussion
The underrepresentation of racial and ethnic minority populations in clinical trials is commonly based on comparisons with US Census data.4,5 In this study, the mean and yearly participation rates were at or above the US Census level for Black or African American populations but not for other racial or ethnic minority groups, similar to a recent publication.6 Although comparing participation in clinical trials by racial and ethnic groups with the Census alone is not a definitive assessment, the low proportions of some racial and ethnic groups in these data highlight the need to increase diversity in clinical trial participation in the US.
This study is limited to 5 years’ worth of data collected only from trials conducted for new molecular entities and original biologics. Additionally, data on ethnic representation were not always complete. A comparison of trial participation based on disease prevalence and epidemiology is needed to provide a more detailed assessment of diversity.
Section Editors: Jody W. Zylke, MD, Deputy Editor; Kristin Walter, MD, Associate Editor.
References
- 1.US Food and Drug Administration . 2015-2019 Drug trials snapshots: summary report. Accessed March 9, 2021. https://www.fda.gov/media/143592/download
- 2.US Food and Drug Administration . Collection of race and ethnicity data in clinical trials: guidance for industry and Food and Drug Administration staff. Published October 2016. Accessed March 10, 2021. https://www.fda.gov/regulatory-information/search-fda-guidance-documents/collection-race-and-ethnicity-data-clinical-trials
- 3.US Census Bureau . National population by characteristics: 2010-2019. Accessed July 2, 2021. https://www.census.gov/data/datasets/time-series/demo/popest/2010s-national-detail.html
- 4.Clinical trials have far too little racial and ethnic diversity. Scientific American. Published September 1, 2018. Accessed March 9, 2021. https://www.scientificamerican.com/article/clinical-trials-have-far-too-little-racial-and-ethnic-diversity
- 5.Geller SE, Koch A, Pellettieri B, Carnes M. Inclusion, analysis, and reporting of sex and race/ethnicity in clinical trials: have we made progress? J Womens Health (Larchmt). 2011;20(3):315-320. doi: 10.1089/jwh.2010.2469 [DOI] [PMC free article] [PubMed] [Google Scholar]
- 6.Rottas M, Thadeio P, Simons R, et al. Demographic diversity of participants in Pfizer sponsored clinical trials in the United States. Contemp Clin Trials. 2021;106:106421. doi: 10.1016/j.cct.2021.106421 [DOI] [PubMed] [Google Scholar]


