

Abstract
Background
Coronavirus disease 2019 acute respiratory distress syndrome (COVID‐19 ARDS) is a disease that often requires invasive ventilation. Little is known about COVID‐19 ARDS sequelae. We assessed the mid‐term lung status of COVID‐19 survivors and investigated factors associated with pulmonary sequelae.
Methods
All adult COVID‐19 patients admitted to the intensive care unit from 25th February to 27th April 2020 were included. Lung function was evaluated through chest CT scan and pulmonary function tests (PFT). Logistic regression was used to identify predictors of persisting lung alterations.
Results
Forty‐nine patients (75%) completed lung assessment. Chest CT scan was performed after a median (interquartile range) time of 97 (89–105) days, whilst PFT after 142 (133–160) days. The median age was 58 (52–65) years and most patients were male (90%). The median duration of mechanical ventilation was 11 (6–16) days. Median tidal volume/ideal body weight (TV/IBW) was 6.8 (5.71–7.67) ml/Kg. 59% and 63% of patients showed radiological and functional lung sequelae, respectively. The diffusion capacity of carbon monoxide (DLCO) was reduced by 59%, with a median per cent of predicted DLCO of 72.1 (57.9–93.9) %. Mean TV/IBW during invasive ventilation emerged as an independent predictor of persistent CT scan abnormalities, whilst the duration of mechanical ventilation was an independent predictor of both CT and PFT abnormalities. The extension of lung involvement at hospital admission (evaluated through Radiographic Assessment of Lung Edema, RALE score) independently predicted the risk of persistent alterations in PFTs.
Conclusions
Both the extent of lung parenchymal involvement and mechanical ventilation protocols predict morphological and functional lung abnormalities months after COVID‐19.
Keywords: acute respiratory distress syndrome, chest CT scan, COVID‐19, critically ill patients, follow‐up, intensive care, pulmonary fibrosis, pulmonary function tests
Editorial Comment.
This study shows that there is a high prevalence of lung sequelae in survivors from COVID‐19 ARDS, as observed in this cohort. More studies are needed to identify the best strategy to prevent residual lung damage in ICU survivors.
1. INTRODUCTION
The ongoing coronavirus 2019 (COVID‐19) pandemic has caused substantial morbidity and mortality worldwide. According to data from the World Health Organization (WHO), by 18 June 2021, the total number of cases globally reached 177.108.695 1 with an overall cumulative death of around 3.840.223.
Although it is in most cases a self‐limited respiratory tract illness, COVID‐19 may cause acute respiratory distress syndrome (ARDS) requiring invasive ventilation, shock and multi‐organ failure. 2 , 3 , 4 The short‐term mortality of invasively ventilated ARDS COVID‐19 patients is between 30% and 70% depending on the different setting. 5 , 6 , 7 Similar to severe acute respiratory syndrome coronavirus (SARS‐CoV‐1) infection, SARS‐CoV‐2 infection triggers dysregulated immune‐mediated processes that can lead to anatomical damage and fibrosis, influencing lung morphology and function beyond acute disease. 8 , 9 , 10 , 11 , 12 In addition to infection‐related events, the increased mechanical stress caused by both prolonged positive pressure mechanical ventilation may cause a direct mechanical insult, contributing to lung injury. Similarly, the intense inspiratory efforts by spontaneously breathing patients may also cause self‐inflicted lung injury. 13 , 14 However, little is known on the respiratory function in COVID‐19‐related ARDS survivors.
In this paper, we assessed the lung status of COVID‐19 survivors after discharge from the intensive care unit (ICU) and identified the predictors of pulmonary dysfunction identified in this patient population.
2. SUBJECTS AND METHODS
2.1. Study design
This investigation is part of the COVID‐BioB study carried out at the San Raffaele University Hospital in Milan, Italy to identify predictors of COVID‐19 severity, mortality and treatment response and to identify subgroups of patients that might benefit from specific therapeutic interventions. The study methodology has been described. 3 , 4 , 15 , 16 The study comprises, in addition to a thorough assessment of COVID‐19 patients at hospital admission, the follow‐up in a dedicated outpatient clinic of survivors at 4, 12 and 24 weeks after discharge. 17 , 18 The study was approved by the hospital Ethics Committee (protocol No. 34/int/2020) and was registered on ClinicalTrials.gov (NCT04318366). Adult patients with confirmed SARS‐CoV‐2 infection (defined as positive real‐time reverse‐transcriptase polymerase chain reaction from a nasal and/or throat swab along with signs, symptoms and radiological findings suggestive of COVID‐19 pneumonia) were admitted to an ICU at the San Raffaele Scientific Institute for ARDS between 25 February and 27 April 2020 received at least one day of invasive ventilation and were discharged before 10 June were included. Demographical data, including age, gender and ethnicity, comorbidities, body mass index (BMI), clinical and laboratory presentation of COVID‐19 were assessed. 19 Preliminary analysis of radiological results at hospital admission of COVID‐BioB patients has been published. 19 , 20 , 21 , 22 The patients were managed according to recommendations on protective mechanical ventilation and pharmacological treatment of ARDS. 19 After the discharge from the ICU, previously mechanically ventilated COVID‐19 patients were evaluated at the COVID19 Follow‐up Outpatient Clinic of the San Raffaele University Hospital and offered radiological and functional follow‐up.
2.1.1. Outcomes
The primary outcomes were the detection of residual abnormalities at CT scans, defined as the evidence of more than 20% of lung involvement and/or high‐resolution CT (HRCT) Score >8, as well as abnormal pulmonary function tests (PFT) defined by either restrictive abnormalities (FVC<80%+FEV1/FVC>70 or TLC <80%), obstructive abnormalities (FEV1/FVC <0.7 or FEV1/FVC% <88% of predicted value) or reduced diffusing capacity of the lungs for carbon monoxide (DLCO‐SB) <75% three months after the discharge of COVID‐19 survivors from the ICU.
2.2. Lung imaging
All follow‐up CT examinations were performed on a 64‐row multidetector CT scanner (SOMATOM Definition Flash Dual Source CT, Siemens Healthcare). CT protocol included an unenhanced, breath‐hold axial scan of the thorax (from lung apex to the lowest hemidiaphragm); if any concern existed about air trapping, 23 an expiratory scan was also performed.
Two experienced radiologists, both blinded to patients’ eventual symptoms, independently reviewed all CT images for fibrotic‐like changes (honeycombing, reticulation and traction bronchiectasis); 23 differences in the assessment were resolved with consensus.
Furthermore, the quantitative residual burden of ground‐glass opacities (GGO), consolidation and fibrotic‐like changes (honeycombing, reticulation, traction bronchiectasis) were systematically assessed using a pure quantitative scoring system ranging from 0 to 25 points, which has been previously used, in a semiquantitative mode, for similar purposes. 24 Each pulmonary lobe was assigned 0–5 points on the basis of the volume involved (0 if normally aerated lung parenchyma, 1 if disease burden <5%, 2 if disease burden up to 25%, 3 if up to 50%, 4 if up to 75%, 5 if disease burden >75%). Individual lobar scores were added together as a total patient score.
Finally, imaging postprocessing was carried out with commercially available software (Intellispace version 8.0, Philips Medical Systems, Chronic Obstructive Pulmonary Disease tool); after automated identification of pulmonary lobes on lung parenchyma windowed slices, the software estimated total lung volume and also differentiated diverse areas of lung parenchyma based on Hounsfield Unit (HU) thresholds. To quantify and differentiate between normal and pathologic lung parenchyma, a −740 HU threshold was set: Areas with higher‐density values were considered pathologic (disease burden). 22
For the main outcome interpretation of CT scan, the identified threshold of 20% of lung involvement and/or high‐resolution CT (HRCT) Score >8 was chosen according to the median value in our own population.
2.3. Pulmonary function tests
The PFTs were performed and interpreted according to the American Thoracic Society (ATS) and European Respiratory Society (ERS) guidelines and ATS/ERS 2005 interpretation standards. 25 , 26 All PFTs were conducted using Jaeger MasterScreen PFT Analyzer Unit (JLAB software version 5.3.0, CareFusion, Italy). Spirometry was measured using a pneumotachograph to measure forced vital capacity (FVC) and forced expiration volume at 1 s (FEV1). FEV1/FVC was calculated for all patients. The helium washout technique was used to obtain total lung capacity (TLC) and residual volume (RV). Simultaneous measurement of Transfer factor for carbon monoxide and nitric oxide DLCO/DLNO was measured by single breath technique (SBDLCO) obtaining values for DLCO, DLCO to alveolar volume ratio (DLCO/VA).
2.4. Statistical analysis
Prior to analysis, data were cross‐checked with medical charts and verified by data managers and clinicians for accuracy. Categorical variables were expressed as counts (percentage) and continuous variables as medians (interquartile range). Comparisons between groups were performed using the χ2 test or Fisher's exact test for categorical variables, and the Mann–Whitney U test for continuous variables. Univariable and multivariable logistic regression analyses were employed to identify predictors of CT scan and/or PFT abnormalities among all available variables. The results of these analyses were graphically represented in forest plots. Missing data was not imputed. All statistical analyses were performed using R statistical package (version 4.0.0, R Foundation for Statistical Computing, Vienna, Austria), with a two‐sided significance level set at p < 0.05.
3. RESULTS
Between 25 February and 27 April 2020, 116 patients were admitted to ICU and underwent invasive mechanical ventilation for COVID‐19 ARDS. Sixty‐five patients who survived were enrolled in the post‐COVID‐19 follow‐up programme of the San Raffaele Institute 15 , 16 and offered radiological and respiratory function evaluation. Sixteen patients were excluded because they were lost to follow‐up or refused to undergo further investigation. The remaining 49 patients (75%) underwent lung assessment (Figure 1). A CT scan was carried out for three months (median 97 [89–105] days) and PFT for five months (median 142 [133–160] days) after discharge from ICU, respectively. The characteristics of the cohort are listed in Table 1.
FIGURE 1.
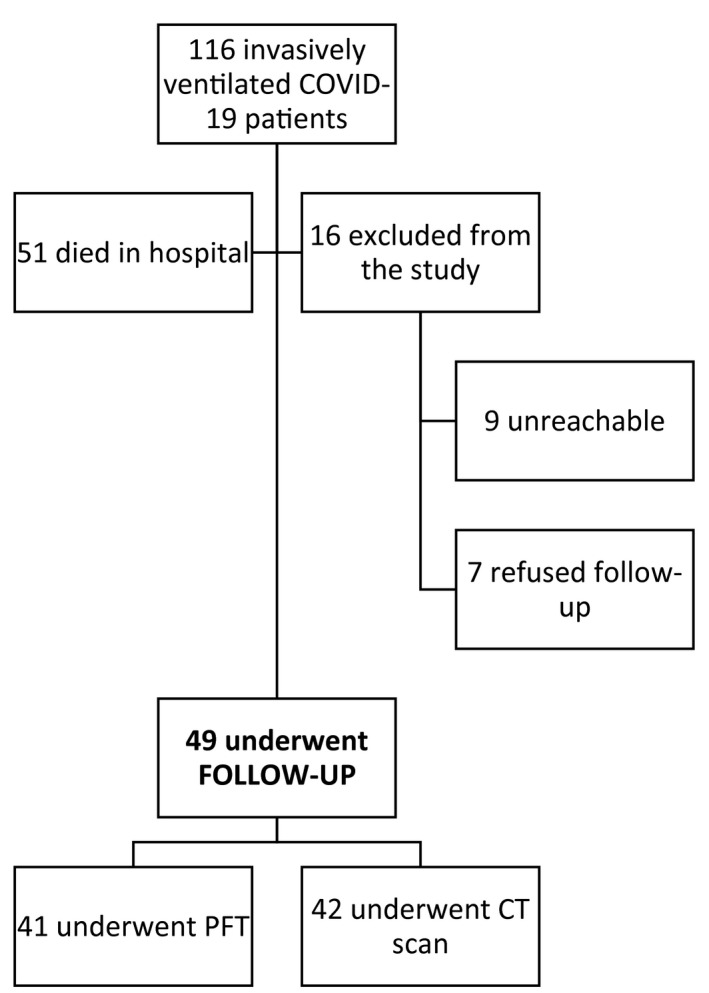
Flowchart. CT, chest tomography; PFT, pulmonary function tests
TABLE 1.
Characteristics of the cohort and differences in patients with or without lung CT scan or PFT abnormalities
| Entire cohort (n=49) |
Normal lung CT scan (n=17) |
Abnormal lung CT scan (n=25) |
p |
Normal PFT (n=15) |
Abnormal PFT (n=26) |
p | |
|---|---|---|---|---|---|---|---|
| Time from ICU discharge to CT (days) | ‐ | 97 (89–101) | 99 (89–111) | 0.2 | ‐ | ‐ | ‐ |
| Time from ICU discharge to PFT (days) | ‐ | ‐ | ‐ | ‐ | 144 (137–159) | 137(123–160) | 0.2 |
| Age (years) | 58 (52–65) | 58 (46–61) | 55 (53–64) | 0.8 | 55 (50.5–69.5) | 58 (53.2–63) | 0.7 |
| Male sex | 44 (89.8) | 16 (94.1) | 23 (92) | 0.9 | 0 | 4 (15.4) | 0.3 |
| BMI (Kg/m2) | 27.7 (25.1–31.5) | 27.5 (25.1–30.7) | 29.4 (25.8–33) | 0.4 | 28.4 (25.8–31.2) | 26.5 (25.1–29.3) | 0.2 |
| Comorbidities | |||||||
| Hypertension | 20 (40.8) | 8 (47.1) | 10 (40) | 0.9 | 6 (40) | 7 (26.9) | 0.6 |
| Coronary artery disease | 1 (2) | 1 (5.9) | 0 | ‐ | 1 (6.7) | 0 | ‐ |
| Chronic kidney disease | 1 (2) | 1 (5.9) | 0 | ‐ | 0 | 0 | ‐ |
| Diabetes mellitus | 5 (10.2) | 2 (11.8) | 2 (8) | 0.9 | 2 (13.3) | 2 (7.7) | 0.9 |
| COPD | 0 | ‐ | ‐ | ‐ | ‐ | ‐ | ‐ |
| Asthma | 1 (2) | 0 | 1 (4) | ‐ | 1 (6.7) | 0 | ‐ |
| Obstructive sleep apnea | 2 (4.1) | 1 (5.9) | 1 (4) | ‐ | 0 | 1 (3.8) | ‐ |
| At ED admission | |||||||
| NLR | 8.2 (4.1–9.9) | 8.9 (6.4–22.1) | 7.9 (4.2–13.1) | 0.22 | 6.7 (5.1–10.9) | 9.7 (6–20.7) | 0.079 |
| CRP (mg/dL) | 162.3 (0.8–1.2) | 122.3 (92.8–177.9) | 179.1 (104.4–244.3) | 0.3 | 113.9 (85.8–172.2) | 178.9 (85.8–172.2) | 0.059 |
| LDH (U/L) | 459.5 (319–605.2) | 445 (299–725) | 474 (339.5–544.5) | 0.8 | 343 (275–411) | 510 (392–651) | 0.01 |
| RALE score | 14 (7–21) | 14 (5–23) | 15 (9–20) | 0.9 | 5 (4–14.5) | 14 (8.2–20) | 0.01 |
| Length of stay in ICU | 12 (8–18) | 9 (6–13) | 13 (9–25) | 0.02 | 8 (5.5–10.5) | 16.5 (5.5–10.5) | 0.001 |
| Total length of hospital stay | 34 (24–52) | 28 (23–41) | 40 (28–55) | 0.077 | 24 (5.5–10.5) | 43 (31–63.2) | 0.005 |
Categorical variables were expressed as count (percentage), whilst continuous variables as median (interquartile range).
Abbreviations. CT, Computed tomography. PFT, pulmonary function tests. BMI, body mass index. COPD, chronic obstructive pulmonary disease. ED, Emergency Department. NLR, neutrophil to lymphocyte ratio. CRP, C reactive protein. LDH, lactate dehydrogenase. ICU, intensive care unit.
The median age was 58 (52–65) years and most patients were male (90%). The most frequent comorbidities were arterial hypertension (HTN, 40%) and diabetes mellitus (DM, 10%). None of the patients had a history of chronic obstructive pulmonary disease (COPD), 1 patient was asthmatic and 2 patients had a prior diagnosis of obstructive sleep apnea syndrome (OSAS). The median neutrophil to lymphocyte ratio (NLR) and C‐reactive protein (CRP) at presentation were, respectively, 8.2 (4.1–9.9) and 162.3 mg/dl (0.8–1.2). Median RALE score (radiographic assessment of lung oedema) was 14 (7–21). 27
All patients received mechanical ventilation (MV) via an endotracheal tube for a median of 11 (6–16) days. Twelve patients (24%) underwent tracheostomy. The median of maximum positive end‐expiratory pressure (PEEP) was 15 cmH2O (12–15) and median tidal volume/ideal body weight (TV/IBW) was 6.8 (5.71–7.67) ml/Kg. The median time between the presentation to the Emergency Department and admission to ICU was 2 days (0–4), the median length of stay in ICU was 12 days (8–18) and the median total length of stay was 34 days (24–52). Most patients received the standard of care in use during the first wave of the pandemic, consisting of lopinavir/ritonavir or darunavir/cobicistat and hydroxychloroquine (Table 2). Anakinra was administered to 29 (59%) patients, of whom 17 (35%) received high‐dose (5 mg/kg twice a day intravenously) and 12 (24%) received low‐dose (100 mg twice a day subcutaneously). Nine patients (18%) received tocilizumab. Corticosteroid therapy was administered to 14 patients (28%) (Table 2).
TABLE 2.
Therapy, ventilator support and complications during ICU stay of the cohort and differences in patients with or without lung CT scan or PFT abnormalities
| Entire cohort (n=49) |
Normal lung CT scan (n=17) |
Abnormal lung CT scan (n=25) |
p |
Normal PFT (n=15) |
Abnormal PFT (n=26) |
p | |
|---|---|---|---|---|---|---|---|
| Therapy | |||||||
| IL−1 therapeutic blockade | 29 (59.2) | 10 (58.8) | 15 (60) | 0.9 | 9 (60) | 14 (53.8) | 0.9 |
| Tocilizumab | 9 (18.4) | 2 (11.8) | 6 (24) | 0.6 | 3 (20) | 4 (15.4) | 0.9 |
| Remdesivir | 6 (12.2) | 3 (17.6) | 3 (12) | 4 (26.7) | 2 (7.7) | 0.2 | |
| Steroid | 14 (28.6) | 3 (17.6) | 9 (36) | 0.4 | 3 (20) | 11 (42.3) | 0.3 |
| Ventilatory support | |||||||
| Maximum PEEP a | 15 (12–15) | 14.5 (12–15) | 15 (12.8–15) | 0.9 | 12.5 (10–14.2) | 15 (12–15) | 0.1 |
| Mean TV/IBW b | 6.8 (6.9–7.5) | 6.2 (5.6–6.7) | 7.2 (6.7–7.7) | 0.0045 | 7.2 (6–7.8) | 6.7 (6–7.4) | 0.4 |
| Days of invasive ventilation | 11 (6–16) | 8 (5–12) | 13 (8–23) | 0.028 | 6 (3.5–9) | 14.5 (7.2–29) | 0.001 |
| Tracheostomy | 12 (24.5) | 3 (17.6) | 6 (24) | 0.9 | 1 (6.7) | 9 (34.6) | 0.10 |
| Complications | |||||||
| Bacterial pneumonia | 12 (24.5) | 3 (17.6) | 9 (36) | 0.4 | 4 (26.7) | 5 (19.2) | 0.9 |
| Pneumothorax | 6 (12.2) | 0 | 4 (16) | 0.2 | 1 (6.7) | 4 (15.4) | 0.8 |
| Pulmonary thromboembolism | 5 (10.2) | 0 | 3 (12) | 0.4 | 1 (6.7) | 3 (11.5) | 0.9 |
Categorical variables were expressed as count (percentage), whilst continuous variables as median (interquartile range).
Abbreviations. ICU, intensive care unit. CT, Computed tomography. PFT, pulmonary function tests. IL, interleukin. PEEP, positive end‐expiratory pressure. TV, tidal volume. IBW, ideal body weight.
Maximum PEEP reached during hospital stay.
Calculated as the mean of all TV/IBW values recorded during ICU stay.
Of the 49 patients observed at follow‐up, 42 patients underwent lung CT scan and 41 patients underwent PFTs (Table 3). The primary outcome of the study occurred, respectively, in 25 patients (59%) who had lung radiological sequelae and in 26 patients (63%) who had pulmonary function sequelae (Figure 2). The median quantitative chest extent of the disease‐free lung was 81% (72.8–87.7) and the median lung CT scan score was 9 (6–12). Radiological characteristics suggestive of lung fibrosis were found in 12 patients (28%) (Figure 3). Impairment in DLCO (<75% predicted) was observed in 29 patients (59%), with a median per cent of predicted DLCO‐SB of 72.1 (57.9–93.9) and 19 patients (46%) exhibited a restrictive impairment. No patient reached the criteria for obstructive abnormalities. Forced vital capacity (FVC) was normal, whilst TLC and RV were slightly reduced, respectively, 97% (90.3–106.3%), 79% (75–95%) and 60% (52–74%) predicted. The transfer coefficient for the diffusion of CO (DLCO/VA) was 97% (82–111%) of predicted (Table 3).
TABLE 3.
Lung CT scan and PFT in ICU COVID‐19 patients at follow‐up
| Lung CT scan | |
|---|---|
| Findings | n=42 |
| Total lung volume (mL) | 4447 (4034–5183) |
| Total healthy lung volume (mL) | 3469 (2901–4459) |
| Percentage of healthy lung | 81 (73–88) |
| Total lung CT scan score | 9 (6–12) |
| Fibrosis | 12 (28.6) |
| Pulmonary function tests | |
|---|---|
| Findings | n=41 |
| FVC (L) | 3.7 (3.2–4.5) |
| Per cent of predicted FVC (%) | 97 (90–106) |
| FEV1 (L) | 3.2 (2.6–3.7) |
| Per cent of predicted FEV1 (%) | 102 (90–112) |
| FEV1/FVC | 84 (81–88) |
| Per cent of predicted of FEV1/FVC (%) | 110 (104–114) |
| TLC (L) a | 5.3 (4.3–6.1) |
| Per cent of predicted TLC (%) | 80 (76–96) |
| RV (L) a | 1.3 (1.1–1.8) |
| Per cent of predicted RV (%) | 61 (53–74) |
| DLCO‐SB (mL/min/mm Hg) | 6.5 (5.3–8.1) |
| Per cent of predicted DLCO‐SB (%) | 72 (58–94) |
| DLCO/VA (mL/min/mmHg/L) | 1.5 (1.2–1.6) |
| Per cent of predicted DLCO/VA (%) | 97 (83–112) |
| DLCO <75% of predicted | 29 (59.2) |
| Obstructive pattern | 0 |
| Restrictive pattern | 19 (46.3) |
Categorical variables were expressed as count (percentage), whilst continuous variables as median (interquartile range).
Abbreviations. CT, computed tomography. FVC, forced vital capacity. FEV1, forced expiratory volume in 1 s. TLC, total lung capacity. RV, residual volume. DLCO‐SB, single breath‐diffusion lung capacity for carbon monoxide. DLCO/VA, ratio between diffusion lung capacity for carbon monoxide and alveolar volume. Dm, membrane diffusion.
Measured through helium dilution technique.
FIGURE 2.
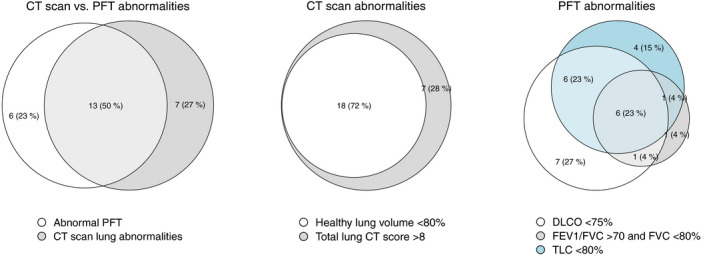
Venn's diagram for primary outcome. CT, chest tomography; DLCO, diffusion lung capacity for carbon monoxide; FEV1, forced expiratory volume in 1 s; FVC, forced vital capacity; PFT, pulmonary function tests; TLC, total lung capaci
FIGURE 3.
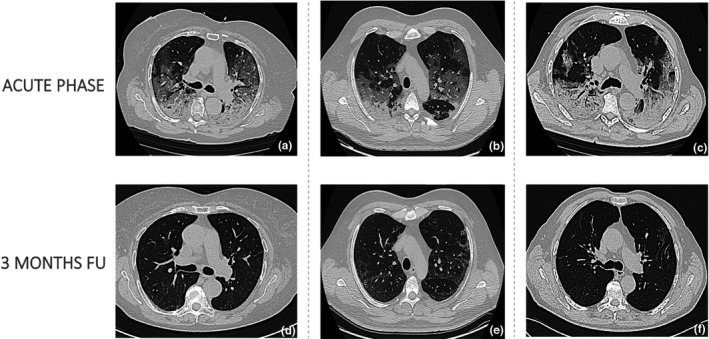
Axial chest tomography scans of three patient acquired (a, b, c) during the acute phase of the disease (bilateral ground glass opacities predominantly in subpleural locations together with consolidations in the lower lobes, thickened interlobular septa [b]) and (d, e, f) three months after intensive care unit discharge (residual subpleural reticular thickening)
Overall, the majority of patients of ARDS survivors had pulmonary sequelae, as reflected by the presence of architectural alterations or functional defects. Thirteen (50%) of these patients had both architectural alterations or functional defects as represented in the Venn diagram (Figure 2). The time between ICU discharge and follow‐up was similar in patients with and without sequelae (Table 1). In contrast, the length of stay in ICU and total hospital length of stay were significantly different (9 vs. 13 days, p = 0.02; 8 vs. 16.5 days, p = 0.001). Time on invasive mechanical ventilation were also significantly higher (8 vs. 13 days, p = 0.028; 6 vs. 14.5 days, p = 0.001). LDH and RALE score on presentation in the emergency department were significantly higher in patients with altered PFT, but not in patients with altered lung CT‐scan (343 vs. 510 U/L, p = 0.8; 5 vs. 14, p = 0.9) (Table 1). Mean TV/IBW was higher in patients with altered lung CT‐scan at the follow up (6.2 vs 7.2 mL/kgIBW, p = 0.004) but not for patients presenting with abnormal PFT. There were no differences observed in maximum PEEP, days of pronation and tracheostomy. Patients with or without pulmonary sequelae did not differ in terms of treatment with anti‐cytokine agents (anakinra or tocilizumab), antiviral agents or corticosteroids (Table 2).
Multivariable logistic regression analyses predicting CT scan and PFT abnormalities at follow‐up are graphically represented in Figure 4. Mean TV/IBW during invasive mechanical ventilation emerged as an independent predictor of persistent CT scan abnormalities. On the contrary, we found that the time on mechanical ventilation was an independent predictor of both CT (p = 0.047) and PFT abnormalities (p = 0.015). RALE score at hospital admission independently predicted the risk of persistent alterations in lung function (p = 0.03).
FIGURE 4.
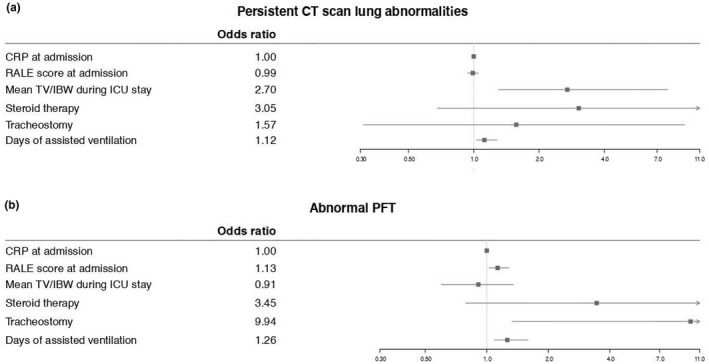
Forest plot for multivariate logistic regression analysis. CRP, C‐reactive protein; CT, chest tomography; IBW, ideal body weight; ICU, intensive care unit; PFT, pulmonary function tests; RALE, radiographic assessment of lung edema; TV, tidal volume
4. DISCUSSION
Radiological evidence of more than 20% of lung involved and/or HRCT score >8 was observed in 59% of patients, whilst restrictive ventilatory defects, and/or DLCO abnormalities, albeit mild, were found in 63% of patients at 3 months after ICU discharge indicating that viral clearance and clinical recovery do not reflect complete lung restitutio ad integrum.
Our findings are in agreement with those from previous studies reporting a high prevalence of CT abnormalities in COVID‐19 survivors at three months since discharge from an ICU. 28 , 29 , 30 , 31 Lerum and colleagues reported a low prevalence of PFT abnormalities in patients discharged from ICU (nearly 10%). 28 However, they included only 9 patients ventilated invasively out of a total cohort of 15 patients. In another case series, 29 nearly 40% of COVID‐19 survivors had abnormal PFT after approximately 6 weeks following discharge from ICU discharge, whilst Truffaut and colleagues reported 55% of PFT abnormality. 30 A much higher prevalence of PFT abnormalities, (nearly 90%), was observed by van Gassel et al, 31 possibly reflecting a longer duration of invasive mechanical ventilation and higher ICU length of stay. In line with our findings, the most frequent functional anomaly observed in all these studies was impaired DLCO, followed by restrictive impairment. Impaired DLCO was also observed in SARS and Middle East Respiratory Syndrome (MERS) survivors and persisted at 12 months in 11–45% of patients. In these conditions, PFTs improved with time. 31 , 32 , 33
In patients with ARDS due to other causes treated in the ICU, long‐term radiological lung abnormalities including reticular pattern and ground‐glass opacities are frequent findings. The percentage of abnormal lung parenchyma decreases over time, being less than 10% at one year after ARDS. A similar tendency is generally observed for PFTs, which indicates a good recovery in terms of lung volume at six months. 34 Conversely, impaired DLCO remains the most frequently impaired lung function test, in an average of 80% of patients after 1 year sometimes lingering even up to five years after ARDS. 35 , 36
In our cohort, the number of days on mechanical ventilation independently predicted the presence at follow‐up of both radiological and functional pulmonary abnormalities. This is in accordance with studies reporting the length of mechanical ventilation during ICU stay as a factor associated with the severity of lung damage at CT scan at three months in COVID‐19 survivors. 37 An inverse correlation between the duration of ventilation and DLCO at 4 months after ICU discharge has also been reported. 38 Longer time on mechanical ventilation may reflect an increased need for ventilatory support due to more severe pneumonia. Therefore, it remains to be clarified whether the higher risk of persistent pulmonary sequelae derives from direct ventilator‐mediated mechanisms or is an indirect consequence of a more aggressive underlying disease. The latter is supported by the finding that higher RALE scores predicted altered PFTs, indicating that more extensive lung involvement may be associated with a longer time to recovery or possibly with persistent lung function impairment.
High tidal volumes in patients with ARDS lead to ventilator‐induced lung injury and increased mortality. 39 , 40 , 41 Accordingly, we found that for each additional mL/Kg of TD/IBW received during ICU stay, the risk of persistent CT scan abnormalities at three months increased by almost threefold. High tidal volumes cause the disruption of lung epithelium and endothelium, which in turn leads to the release of inflammatory mediators. This superimposed inflammatory response boosts lung inflammation even further and exacerbates parenchymal injury. 39
SARS‐CoV‐2 infection, ARDS and mechanical ventilation may all promote lung fibrosis. Virus‐induced cell injury and mechanical stretch likely lead to prolonged lung injury. Without disease‐modifying drugs in COVID‐19 patients, protective lung ventilation strategies, with low tidal volumes and low inspiratory pressure, is currently the only way to limit injurious lung stretch and prevent ventilator‐associated pulmonary sequelae.
The strength of our study was the inclusion of only mechanically ventilated patients. Important limitations include the lack of baseline information on pulmonary function, the small sample size and incomplete matching between patients undergoing lung‐CT scan and PFT at follow‐up. The small sample size and absence of a pre‐determined analysis plan allow us an analysis of data mainly based on dichotomization of a numerical or ordinal variable.
Our findings indicate that mechanically ventilated COVID‐19 survivors require an integrated follow‐up. Different therapeutic strategies have been proposed for their therapeutic potential for treating severe COVID‐19 and preventing the long‐term pulmonary sequelae, but more studies are needed to identify the best strategy. 42 , 43 , 44 Data on longer term follow‐up of mechanically ventilated COVID‐19 survivors are also needed to verify whether these pulmonary sequelae persist.
5. CONCLUSION
We observed a high prevalence of radiological or functional lung sequelae in ICU survivors from COVID‐19 ARDS. Half of these patients had both architectural alterations or functional defects. Mechanical ventilation seems to play a role in lung injury, with time on invasive mechanical ventilation emerging as an independent predictor of persistent CT and PFT abnormalities and mean TV/IBW predicting CT scan abnormalities. RALE score at hospital admission independently predicted the risk of persistent alterations in lung function.
CONFLICTS OF INTEREST
All the authors have disclosed that they do NOT have any conflicts of interest or source of funding.
ACKNOWLEDGEMENTS
Respiratory medicine team: Abbà Cristina, D’aiuto Domenica, Fumagalli Antonella, Panella Lucia, Teodoro Concetta. COVID‐BioB Study Group: Castellani Jacopo, Cilla Marta, Cinel Elena, Conte Caterina, Di Tomasso Nora, Falbo Elisabetta, Faustini Carolina, Fedrizzi Monica, Ferrante Marica, Fresilli Stefano, Landoni Giovanni, Magnaghi Cristiano, Maimeri Nicolò, Martinenghi Sabina, Moizo Elena, Mucci Milena, Velati Mara.
Compagnone N, Palumbo D, Cremona G, et al; COVID‐BioB Study Group . Residual lung damage following ARDS in COVID‐19 ICU survivors. Acta Anaesthesiol Scand. 2022;66:223–231. doi: 10.1111/aas.13996
Nicola Compagnone and Diego Palumbo have contributed equally to the manuscript.
REFERENCES
- 1. WHO Coronavirus Disease . (COVID‐19) Dashboard. https://covid19.who.int/
- 2. Arentz M, Yim E, Klaff L, et al. Characteristics and outcomes of 21 Critically Ill patients With COVID‐19 in Washington State. JAMA. 2020;323(16):1612‐1614. 10.1001/jama.2020.4326 [DOI] [PMC free article] [PubMed] [Google Scholar]
- 3. Ciceri F, Castagna A, Rovere‐Querini P, et al. Early predictors of clinical outcomes of COVID‐19 outbreak in Milan, Italy. Clinical Immunology (Orlando, Fla). 2020;217:108509. 10.1016/j.clim.2020.108509 [DOI] [PMC free article] [PubMed] [Google Scholar]
- 4. Zangrillo A, Beretta L, Scandroglio AM, et al. Characteristics, treatment, outcomes and cause of death of invasively ventilated patients with COVID‐19 ARDS in Milan, Italy. Crit Care Resusc. 2020. Published online April 2020. [DOI] [PMC free article] [PubMed] [Google Scholar]
- 5. Schmidt M, Hajage D, Demoule A, et al. Clinical characteristics and day‐90 outcomes of 4244 critically ill adults with COVID‐19: a prospective cohort study. Intensive Care Med. 2021;47(1):60‐73. 10.1007/s00134-020-06294-x [DOI] [PMC free article] [PubMed] [Google Scholar]
- 6. Grasselli G, Greco M, Zanella A, et al. Risk factors associated with mortality among patients with COVID‐19 in intensive care units in Lombardy, Italy. JAMA Intern Med. 2020;180(10):1345‐1355. 10.1001/jamainternmed.2020.3539 [DOI] [PMC free article] [PubMed] [Google Scholar]
- 7. Ñamendys‐Silva SA, Gutiérrez‐Villaseñor A, Romero‐González JP. Hospital mortality in mechanically ventilated COVID‐19 patients in Mexico. Intensive Care Med. 2020;46(11):2086‐2088. 10.1007/s00134-020-06256-3 [DOI] [PMC free article] [PubMed] [Google Scholar]
- 8. Cheung OY, Chan JWM, Ng CK, Koo CK. The spectrum of pathological changes in severe acute respiratory syndrome (SARS). Histopathology. 2004;45(2):119‐124. 10.1111/j.1365-2559.2004.01926.x [DOI] [PMC free article] [PubMed] [Google Scholar]
- 9. McDonald LT. Healing after COVID‐19: are survivors at risk for pulmonary fibrosis? Am J Physiol Lung Cell Mol Physiol. 2021;320(2):L257‐L265. 10.1152/AJPLUNG.00238.2020 [DOI] [PMC free article] [PubMed] [Google Scholar]
- 10. Wang F, Kream RM, Stefano GB. Long‐term respiratory and neurological sequelae of COVID‐19. Med Sci Monit. 2020;26:1‐10. 10.12659/MSM.928996 [DOI] [PMC free article] [PubMed] [Google Scholar]
- 11. Zhao X, Nicholls JM, Chen YG. Severe acute respiratory syndrome‐associated coronavirus nucleocapsid protein interacts with Smad3 and modulates transforming growth factor‐β signaling. J Biol Chem. 2008;283(6):3272‐3280. 10.1074/jbc.M708033200 [DOI] [PMC free article] [PubMed] [Google Scholar]
- 12. Lal SK. Molecular biology of the SARS‐coronavirus. Springer. 2010:1‐328. 10.1007/978-3-642-03683-5 [DOI] [Google Scholar]
- 13. Gattinoni L, Marini JJ, Busana M, Chiumello D, Camporota L. Spontaneous breathing, transpulmonary pressure and mathematical trickery. Ann Intens Care. 2020;10(1):1‐2. 10.1186/s13613-020-00708-1 [DOI] [PMC free article] [PubMed] [Google Scholar]
- 14. Tobin MJ, Laghi F, Jubran A. Caution about early intubation and mechanical ventilation in COVID‐19. Ann Intens Care. 2020;10(1):4‐6. doi: 10.1186/s13613-020-00692-6 [DOI] [PMC free article] [PubMed] [Google Scholar]
- 15. Rovere‐Querini P, Tresoldi C, Conte C, et al. Biobanking for COVID‐19 research. Panminerva Med. 2020. 10.23736/S0031-0808.20.04168-3 [DOI] [PubMed] [Google Scholar]
- 16. Di Filippo L, De Lorenzo R, D'Amico M, et al. COVID‐19 is associated with clinically significant weight loss and risk of malnutrition, independent of hospitalisation: A post‐hoc analysis of a prospective cohort study. Clin Nutr (Edinburgh, Scotland). 2021;40(4):2420‐2426. 10.1016/j.clnu.2020.10.043 [DOI] [PMC free article] [PubMed] [Google Scholar]
- 17. De Lorenzo R, Conte C, Lanzani C, et al. Residual clinical damage after COVID‐19: a retrospective and prospective observational cohort study. PLoS One. 2020;15(10):1‐16. 10.1371/journal.pone.0239570 [DOI] [PMC free article] [PubMed] [Google Scholar]
- 18. Rovere‐Querini P, de Lorenzo R, Conte C, et al. Post‐COVID‐19 follow‐up clinic: depicting chronicity of a new disease. Acta Biomedica. 2020;91:22‐28. 10.23750/abm.v91i9-S.10146 [DOI] [PMC free article] [PubMed] [Google Scholar]
- 19. Belletti A, Palumbo D, Zangrillo A, et al. Predictors of Pneumothorax/Pneumomediastinum in mechanically ventilated COVID‐19 patients. J Cardiothorac Vasc Anesth. 2021;35(12):3642‐3651. 10.1053/j.jvca.2021.02.008 [DOI] [PMC free article] [PubMed] [Google Scholar]
- 20. De Cobelli F, Palumbo D, Ciceri F, et al. Pulmonary vascular thrombosis in COVID‐19 pneumonia. J Cardiothorac Vasc Anesth. 2021;35(12):3631–3641. 10.1053/j.jvca.2021.01.011 [DOI] [PMC free article] [PubMed] [Google Scholar]
- 21. Palumbo D, Campochiaro C, Belletti A, et al. Pneumothorax/pneumomediastinum in non‐intubated COVID‐19 patients: differences between first and second Italian pandemic wave. Eur J Intern Med. 2021;88:144–146. 10.1016/j.ejim.2021.03.018 [DOI] [PMC free article] [PubMed] [Google Scholar]
- 22. Mori M, Palumbo D, De Lorenzo R, et al. Robust prediction of mortality of COVID‐19 patients based on quantitative, operator‐independent, lung CT densitometry. Physica Med. 2021;85:63–71. 10.1016/j.ejmp.2021.04.022 [DOI] [PMC free article] [PubMed] [Google Scholar]
- 23. Lynch DA, Sverzellati N, Travis WD, et al. Diagnostic criteria for idiopathic pulmonary fibrosis: a Fleischner Society White Paper. Lancet Respir Med. 2018;6(2):138–153. 10.1016/s2213-2600(17)30433-2 [DOI] [PubMed] [Google Scholar]
- 24. Zhao Y‐M, Shang Y‐M, Song W‐B, et al. Follow‐up study of the pulmonary function and related physiological characteristics of COVID‐19 survivors three months after recovery. EClinicalMedicine. 2020;25:100463. 10.1016/j.eclinm.2020.100463 [DOI] [PMC free article] [PubMed] [Google Scholar]
- 25. Graham BL, Steenbruggen I, Miller MR, et al. Standardization of spirometry 2019 update. An official American Thoracic Society and European Respiratory Society Technical Statement. Am J Respir Crit Care Med. 2019;200(8):e70–e88. 10.1164/rccm.201908-1590st [DOI] [PMC free article] [PubMed] [Google Scholar]
- 26. Stanojevic S, Graham BL, Cooper BG, et al. Official ERS technical standards: Global Lung Function Initiative reference values for the carbon monoxide transfer factor for Caucasians. Eur Respir J. 2017;50(3):1700010. 10.1183/13993003.00010-2017 [DOI] [PubMed] [Google Scholar]
- 27. Mushtaq J, Pennella R, Lavalle S, et al. Initial chest radiographs and artificial intelligence (AI) predict clinical outcomes in COVID‐19 patients: analysis of 697 Italian patients. Eur Radiol. 2021;31(3):1770–1779. 10.1007/s00330-020-07269-8 [DOI] [PMC free article] [PubMed] [Google Scholar]
- 28. Lerum TV, Aaløkken TM, Brønstad E, et al. Dyspnoea, lung function and CT findings 3 months after hospital admission for COVID‐19. Eur Respir J. 2021;57(4):2003448. 10.1183/13993003.03448-2020 [DOI] [PMC free article] [PubMed] [Google Scholar]
- 29. Ramani C, Davis EM, Kim JS, et al. Post‐ICU COVID‐19 Outcomes. Chest. 2021;159(1):215–218. 10.1016/j.chest.2020.08.2056 [DOI] [PMC free article] [PubMed] [Google Scholar]
- 30. Truffaut L, Demey L, Bruyneel AV, et al. Post‐discharge critical COVID‐19 lung function related to severity of radiologic lung involvement at admission. Respir Res. 2021;22(1). 10.1186/s12931-021-01625-yxx [DOI] [PMC free article] [PubMed] [Google Scholar]
- 31. van Gassel RJJ, Bels JLM, Raafs A, et al. High prevalence of pulmonary sequelae at 3 months after hospital discharge in mechanically ventilated survivors of COVID‐19. Am J Respir Crit Care Med. 2021;203(3):371–374. 10.1164/rccm.202010-3823le [DOI] [PMC free article] [PubMed] [Google Scholar]
- 32. Ahmed H, Patel K, Greenwood D, et al. Long‐term clinical outcomes in survivors of severe acute respiratory syndrome and Middle East respiratory syndrome coronavirus outbreaks after hospitalisation or ICU admission: a systematic review and meta‐analysis. J Rehabil Med. 2020. 10.2340/16501977-2694xx [DOI] [PubMed] [Google Scholar]
- 33. Hui DS, Wong KT, Ko FW, et al. The 1‐year impact of severe acute respiratory syndrome on pulmonary function, exercise capacity, and quality of life in a cohort of survivors. Chest. 2005;128(4):2247–2261. 10.1378/chest.128.4.2247 [DOI] [PMC free article] [PubMed] [Google Scholar]
- 34. Chiumello D, Coppola S, Froio S, Gotti M. What's next after ARDS: long‐term outcomes. Respir Care. 2016;61(5):689–699. 10.4187/respcare.04644 [DOI] [PubMed] [Google Scholar]
- 35. Wilcox ME, Patsios D, Murphy G, et al. Radiologic outcomes at 5 years after severe ARDS. Chest. 2013;143(4):920–926. 10.1378/chest.12-0685 [DOI] [PubMed] [Google Scholar]
- 36. Orme J, Romney JS, Hopkins RO, et al. Pulmonary function and health‐related quality of life in survivors of acute respiratory distress syndrome. Am J Respir Crit Care Med. 2003;167(5):690–694. 10.1164/rccm.200206-542oc [DOI] [PubMed] [Google Scholar]
- 37. González J, Benítez ID, Carmona P, et al. Pulmonary function and radiologic features in survivors of critical COVID‐19. Chest. 2021;160(1):187–198. 10.1016/j.chest.2021.02.062 [DOI] [PMC free article] [PubMed] [Google Scholar]
- 38. Guler SA, Ebner L, Aubry‐Beigelman C, et al. Pulmonary function and radiological features 4 months after COVID‐19: first results from the national prospective observational Swiss COVID‐19 lung study. Eur Respir J. 2021;57(4):2003690. 10.1183/13993003.03690-2020 [DOI] [PMC free article] [PubMed] [Google Scholar]
- 39. Acute Respiratory Distress Syndrome Network . Ventilation with lower tidal volumes as compared with traditional tidal volumes for acute lung injury and the acute respiratory distress syndrome. Surv Anesthesiol. 2001;45(1):19–20. 10.1097/00132586-200102000-00017 [DOI] [PubMed] [Google Scholar]
- 40. Dreyfuss D, Saumon G. Ventilator‐induced lung injury. Am J Respir Crit Care Med. 1998;157(1):294–323. 10.1164/ajrccm.157.1.9604014 [DOI] [PubMed] [Google Scholar]
- 41. Ranieri VM, Suter PM, Tortorella C, et al. Effect of mechanical ventilation on inflammatory mediators in patients with acute respiratory distress syndrome. JAMA. 1999;282(1):54. 10.1001/jama.282.1.54 [DOI] [PubMed] [Google Scholar]
- 42. George PM, Wells AU, Jenkins RG. Pulmonary fibrosis and COVID‐19: the potential role for antifibrotic therapy. Lancet Respir Med. 2020;8(8):807–815. 10.1016/s2213-2600(20)30225-3 [DOI] [PMC free article] [PubMed] [Google Scholar]
- 43. Li Z, Niu S, Guo B, et al. Stem cell therapy for COVID‐19, ARDS and pulmonary fibrosis. Cell Prolif. 2020;53(12):12939. 10.1111/cpr.12939 [DOI] [PMC free article] [PubMed] [Google Scholar]
- 44. Myall KJ, Mukherjee B, Castanheira AM, et al. Persistent post–COVID‐19 interstitial lung disease. an observational study of corticosteroid treatment. Ann Am Thorac Soc. 2021;18(5):799–806. 10.1513/annalsats.202008-1002oc [DOI] [PMC free article] [PubMed] [Google Scholar]