

Abstract
Background
The contribution of HIV to COVID‐19 outcomes in hospitalized inpatients remains unclear. We conducted a multi‐centre, retrospective matched cohort study of SARS‐CoV‐2 PCR‐positive hospital inpatients analysed by HIV status.
Methods
HIV‐negative patients were matched to people living with HIV (PLWH) admitted from 1 February 2020 to 31 May 2020 up to a 3:1 ratio by the following: hospital site, SARS‐CoV‐2 test date ± 7 days, age ± 5 years, gender, and index of multiple deprivation decile ± 1. The primary objective was clinical improvement (two‐point improvement or better on a seven‐point ordinal scale) or hospital discharge by day 28, whichever was earlier.
Results
A total of 68 PLWH and 181 HIV‐negative comparators were included. In unadjusted analyses, PLWH had a reduced hazard of achieving clinical improvement or discharge [adjusted hazard ratio (aHR) = 0.57, 95% confidence interval (CI): 0.39–0.85, p = 0.005], but this association was ameliorated (aHR = 0.70, 95% CI: 0.43–1.17, p = 0.18) after additional adjustment for ethnicity, frailty, baseline hypoxaemia, duration of symptoms prior to baseline, body mass index (BMI) categories and comorbidities. Baseline frailty (aHR = 0.79, 95% CI: 0.65–0.95, p = 0.011), malignancy (aHR = 0.37, 95% CI 0.17, 0.82, p = 0.014) remained associated with poorer outcomes. The PLWH were more likely to be of black, Asian and minority ethnic background (75.0% vs 48.6%, p = 0.0002), higher median clinical frailty score [3 × interquartile range (IQR): 2–5 vs, 2 × IQR: 1–4, p = 0.0069), and to have a non‐significantly higher proportion of active malignancy (14.4% vs 9.9%, p = 0.29).
Conclusions
Adjusting for confounding comorbidities and demographics in a matched cohort ameliorated differences in outcomes of PLWH hospitalized with COVID‐19, highlighting the importance of an appropriate comparison group when assessing outcomes of PLWH hospitalized with COVID‐19.
Keywords: comorbidities, COVID‐19, HIV
INTRODUCTION
SARS‐CoV‐2 infection is estimated to cause mild to moderate disease (coronavirus disease 2019 or COVID‐19) in about 80% of people but can cause severe lower respiratory tract infection in approximately 15–20%, particularly among those in high‐risk groups, defined by advanced age (≥ 65 years), ethnicity (African and Asian), other social determinants of health, or presence of comorbidities or obesity [1, 2, 3, 4].
There is increasing evidence from large population‐based studies that suggest people living with HIV (PLWH) have a higher risk of severe COVID‐19 and worse outcomes. Reports from large population‐based cohorts from the USA [5], the UK [6, 7], South Africa [8] and the World Health Organization [9] suggest there is increased mortality from COVID‐19 amongst PLWH. However, these cohorts were often limited by incomplete data and lack of data on CD4 T‐cell count, viral load or HIV treatment. Mortality end‐points may miss non‐mortality outcomes such as time to recovery and long‐term disability. Apart from the OPENSAFELY cohort in the UK [6], these studies were not able to adjust for socio‐economic deprivation. Conversely, cohorts matched for various confounders [10, 11, 12, 13] and an unmatched cohort from South Africa [14] have not shown an increased risk of severe disease in PLWH.
It remains unclear if differences in COVID‐19 outcomes are driven by differences in HIV‐specific factors, underlying health conditions or adverse social determinants of health, the latter two factors disproportionately affecting PLWH [15]. In the OPENSAFELY cohort, people without comorbidities were not at increased risk of death. The study was not able to look at the impact of viral suppression on COVID‐19 mortality due to a lack of HIV‐specific data. A Spanish study found that although CD4 T cell count did not affect the risk of severe COVID‐19 in people with suppressed viraemia, a CD4 T cell count <500 was associated with increased risk of severe COVID‐19 outcomes in people with detectable viraemia [16].
We conducted a multi‐centre, retrospective analysis of people living with and without HIV hospitalized with COVID‐19 across England during the early pandemic, matched for age, gender and socioeconomic deprivation to estimate the association of HIV status and other confounding variables with hospitalization outcomes among PLWH hospitalized with COVID‐19.
METHODS
Study design
RECEDE‐C19 is a multi‐centre retrospective matched cohort study, analysing outcomes in PLWH admitted with COVID‐19 and a matched cohort of HIV‐negative individuals admitted with COVID‐19 up to a 1:3 ratio. Ethical approval was granted by the UK Health Research Authority (REC reference 20/HRA/2278).
Study setting and participants
Six large hospital trusts across England were included: four in London (Imperial College Healthcare NHS Foundation Trust, Barts Health NHS Trust, St George's Hospital NHS Foundation Trust, and Guy's and St Thomas’ NHS Foundation Trust), the Pennine Acute Hospitals NHS Trust in Greater Manchester, and the University Hospitals of Leicester NHS Trust in Leicester.
The inclusion criteria were PLWH aged 18 years and older admitted to hospital with a confirmed diagnosis of COVID‐19, identified from 1 February 2020 to the 31 May 2020. The comparator cohort of HIV‐negative individuals was identified from hospitalized patients with a presumed or confirmed negative HIV status and a confirmed diagnosis of COVID‐19. All patients were identified through comprehensive searches of hospital ICD‐10 diagnosis codes or COVID‐19 cases database.
Patients diagnosed with COVID‐19 not requiring admission at time of presentation were excluded.
Cohort matching
To select matched comparator patients, contemporary HIV‐negative individuals hospitalized at each site were retrospectively matched to each PLWH identified by the following criteria: hospital site, SARS‐CoV‐2 test date within 7 days, age within 5 years, same gender, and within one decile of each PLWH’s index of multiple deprivation decile (IMDD) based on postcode, a surrogate marker of socioeconomic status. Ethnicity data are often poorly defined and collected [17], and thus were not included in the matching criteria; IMDD was used instead to account for geographical deprivation. Investigators blinded to patient outcomes in the comparator cohort selected up to a ratio of three comparator patients meeting the above criteria to each PLWH. Matching was performed using the criteria described by investigators at each site who were blinded to the outcomes of the HIV‐negative individuals. Comparators were randomly selected if more than one individual was available to match with the index PLWH case.
Outcomes and data sources
The primary outcome was defined as time to clinical improvement or discharge from hospital by day 28, whichever was earlier. Clinical improvement was defined as an improvement of two points or more from the baseline status, on a seven‐point ordinal scale (1, not hospitalized with resumption of normal activities; 7, palliation or death) described by Cao et al. [18] (categories are given in Table S1).
Secondary outcomes include 28‐day mortality, time to death, length of hospitalization, proportion of patients requiring high dependency or intensive care admission, requirements for organ support including mechanical ventilation or renal replacement therapy, laboratory markers at baseline and most abnormal results during hospitalization. The data were collected by researchers from the direct care team reviewing electronic patient records.
Study definitions
Confirmed COVID‐19 diagnosis was defined with detectable SARS‐CoV‐2 RNA by real time polymerase chain reaction from a combined nose and throat swab or other respiratory samples. Deprivation scores were determined by mapping the patient's postcodes to the English index of multiple deprivation score [19] by decile, 1 referring to the least affluent decile, and 10 to the most affluent. Patient ethnicities are self‐reported and coded as part of the patient demographics records.
The Clinical Frailty Score (CFS) [20] is a seven‐point scale for assessment of frailty from a scale of 1 (very fit) to 9 (terminally ill) (Table S1). If not recorded at the time of admission, the CFS score was retrospectively applied by the study investigators based on the patient's documented activities of daily living from the admission history or physiotherapy documentation. Study investigators were not blinded to the outcome at the time of CFS scoring, and would have been part of the routine care team that often provided more accurate assessments of CFS if patients were known to them pre‐admission.
Study baseline was defined as date of admission (if admission reason was COVID‐19‐related) or date of first detectable SARS‐CoV‐2 result (if admission reason was not COVID‐19‐related); patients were included even if their admission was not COVID‐19‐related, as nosocomial SARS‐CoV‐2 transmission remains a significant concern [21]. Baseline HIV viral load results were recorded, if available, at time of admission or the most recent result within 6 months of admission, and baseline CD4 count, CD4 percentage and CD4:CD8 ratio were recorded from the first result available during or most recent to the admission date. Immunosuppressed PLWH were defined as those with CD4 count ≤ 200 cells/µL and CD4 percentage ≤ 14%. The number of comorbidities was summed from the 18 comorbidities categories recorded (the list of comorbidities is presented in Table S1).
The end of the study was defined as completion of the follow‐up period at day 28 from baseline, discharge from hospital, or death, where the cause of death was recorded (if known).
Study size and statistical analysis
Based on pilot data from a single centre [22], we assumed that HIV status did not have any impact on the primary outcome, that 20% of the cohort would either die or not recover by day 28, and that the median duration to improvement was 6 days in the remaining 80%. Data simulations indicated that a sample size of 50 PLWH and 100 HIV‐negative comparators were required to provide 80% power to show non‐inferiority at a lower limit for the hazard ratio of 0.81. The ratio was increased to up to three comparators for every case, to increase statistical power with more comparators available.
The primary outcome was assessed after patients had reached day 28, with failure to reach clinical improvement, hospital discharge or death before day 28 considered as right‐censored at day 28. Univariable and multivariable Cox proportional hazards regression was performed, stratified by matching cluster. Multiple imputation was used to account for missing data across 20 simulated datasets, and results were combined using Rubin's rules. Variable selection was performed using a global model determined by MJL (clinician) and CS (statistician), through careful consideration of biological mechanisms and potential confounding pathways. The following covariables were included a priori in the multivariable model, as they have been shown previously to be associated with COVID‐19 outcomes: ethnicity, clinical frailty score, body mass index (BMI), hypoxaemia at admission, days with symptoms at admission, hypertension, diabetes and chronic kidney disease. Other covariables were included if the associated p‐value was < 0.2 in univariable analysis. Matched factors were not included as covariables.
A number of sensitivity analyses were performed to assess the robustness of the association between HIV status and time to a two‐point improvement or discharge: (1) complete case analysis excluding those with missing data (n = 217); (2) excluding COVID‐related factors (baseline hypoxaemia at admission, duration of symptoms at admission); (3) excluding ethnicity; (4) additionally adjusting for age to account for any residual confounding (as clusters were matched to within 5 years); (5) excluding BMI; and (6) inclusion of lymphocyte count.
Secondary end‐points included the time to death, which was investigated using standard survival analysis. As numbers of events were small, only univariable analysis was performed. Additional secondary outcomes were summarized using n (%) or median (interquartile range, IQR) as appropriate and compared between groups using a χ2 test, Fisher's exact test or Mann–Whitney U‐test. Multiplicity in hypothesis testing was not accounted for, so results from secondary analyses should be seen as indicative findings. Analyses were performed using SAS, v.9.4 (SAS Institute Inc, Cary, NC, USA) and Stata, v.14 (Statacorp, College Station, TX, USA).
RESULTS
Patient population, characteristics and comorbidities at baseline
In all, 6612 people with COVID‐19 between 1 February and 31 May 2020 were hospitalized across the RECEDE‐C19 study sites, of which 69 patients (1.04%) had known HIV‐positive status. No HIV‐negative comparators within the same site were available for one PLWH, and the remaining 68 PLWH were matched to between one to three HIV‐negative comparator patients (Table S2); in total 181 patients were included in the comparator cohort for analysis.
Baseline characteristics data are displayed in Table 1 and further baseline characteristics are presented in Table S3. Reported smoking and excess alcohol use were not significantly different across groups, and although more PLWH reported recreational drug use, this field was poorly documented across both cohorts.
TABLE 1.
Baseline patient characteristics and investigations stratified by HIV status
| HIV‐positive individuals | HIV‐negative individuals | p‐value | |||
|---|---|---|---|---|---|
| N = 68 | %/IQR | N = 181 | %/IQR | ||
| Median age (years) | 57 | 50–63 | 56 | 51–62 | a |
| Median index of multiple deprivation decile | 3 | 2–4 | 3 | 2–4 | a |
| Gender | |||||
| Female | 26 | 38.2% | 67 | 37.0% | a |
| Male | 42 | 61.8% | 114 | 63.0% | |
| Median body mass index | 27.7 (n = 52) | 23.9–32.3 | 29.4 (n = 115) | 24.7–34.3 | 0.19 |
| Median Clinical Frailty Score | 3 | 2–5 | 2 | 1–4 | 0.0069 |
| Ethnicity | |||||
| White | 17 | 25.0% | 78 | 47.0% | – |
| Black African | 39 | 57.4% | 33 | 18.2% | |
| Black Caribbean | 1 | 1.5% | 14 | 7.7% | |
| Asian | 4 | 5.9% | 18 | 10.8% | |
| Mixed or other ethnic groups not listed | 7 | 10.3% | 23 | 13.9% | |
| Not documented | 0 | 0.0% | 15 | 8.3% | |
| Ethnicity categories | |||||
| Black, Asian and minority ethnic | 51 | 75.0% | 88 | 48.6% | 0.0002 |
| White | 17 | 25.0% | 93 | 51.4% | |
| Comorbidities | |||||
| Hypertension | 35 | 51.5% | 74 | 40.9% | 0.13 |
| Diabetes mellitus (type 1 or type 2) | 18 | 26.5% | 53 | 29.3% | 0.66 |
| History of diabetic complications | 6 | 8.8% | 19 | 10.5% | 0.70 |
| Asthma | 3 | 4.4% | 24 | 13.3% | 0.045 |
| Chronic pulmonary disease | 6 | 8.8% | 21 | 11.6% | 0.53 |
| Chronic cardiac disease | 12 | 17.6% | 22 | 12.1% | 0.26 |
| Liver disease (Child–Pugh score B or C) | 3 | 4.4% | 1 | 0.6% | 0.031 |
| Chronic hepatitis B | 1 | 1.5% | 4 | 2.2% | 0.71 |
| Chronic hepatitis C (untreated) | 2 | 2.9% | 1 | 0.6% | 0.12 |
| Chronic neurological disorder | 9 | 13.2% | 19 | 10.5% | 0.54 |
| Mental health disorder | 12 | 17.6% | 30 | 16.6% | 0.84 |
| Active malignancy | 10 | 14.7% | 18 | 9.9% | 0.29 |
| Chronic haematological disorder | 6 | 8.8% | 9 | 5.0% | 0.26 |
| Rheumatological disease | 0 | 0.0% | 19 | 10.5% | 0.0054 |
| Dementia | 4 | 5.9% | 10 | 5.5% | 1.00 |
| Malnutrition | 0 | 0.0% | 5 | 2.8% | 0.33 |
| Chronic kidney disease (stage 3 or worse) | 24 | 35.3% | 23 | 12.7% | < 0.0001 |
| End‐stage renal failure requiring dialysis | 13 | 19.2% | 9 | 5.0% | 0.0005 |
| Number of comorbidities | 2 | 1–3 | 2 | 1–3 | 0.16 |
| Median duration from symptom onset (days) at baseline | 6 (n = 47) | 1–10 | 7 (n = 173) | 3–10 | 0.23 |
| Hypoxaemia on presentation (oxygen saturations < 94%) | 38 | 55.9% | 104 | 57.5% | 0.82 |
| Admission reason related to COVID‐19 | 57 | 83.8% | 157 | 86.7% | 0.58 |
| Baseline investigations | |||||
| White cell count (×109/L) | 6.1 (n = 66) | 4.7–8.4 | 7.5 (n = 177) | 5.5–9.8 | 0.016 |
| Lymphocytes (×109/L) | 1.2 (n = 65) | 0.85–1.6 | 0.9 (n = 178) | 0.64–1.3 | 0.0008 |
| C‐reactive protein (mg/L) | 108.5 (n = 68) | 44–178.5 | 92 (n = 176) | 44–192.4 | 0.92 |
Abbreviation: IQR, interquartile range.
Matched demographics between cohorts.
Baseline symptoms and laboratory markers
Prior to their COVID‐19 diagnosis, the durations of onset of COVID‐19‐associated symptoms were similar between PLWH and the HIV‐negative cohort (median 6 vs. 7 days, p = 0.23) (Table 1), and the proportions of patients presenting with hypoxaemia (peripheral oxygen saturations < 94% on air) were also similar (55.9% vs. 57.5%, p = 0.82). The proportions of PLWH and HIV‐negative individuals admitted for COVID‐19‐related reasons were 83.8% and 86.7%, respectively, and the remainder had incidental COVID‐19 diagnoses during admissions. Symptoms reported at time of diagnosis were similar between PLWH and HIV‐negative patients (Table S4).
With regard to laboratory markers, PLWH were more likely to be anaemic, to have a lower white cell count, and higher lymphocyte count at baseline compared with HIV‐negative patients (Table 1). Platelet count, estimated glomerular filtration rate (eGFR), C‐reactive protein (CRP) and alanine transaminase were similar between cohorts (Table S4).
Baseline HIV disease characteristics in PLWH cohort
Table 2 summarizes the characteristics of HIV infection and antiretroviral therapy (ART) for the PLWH cohort. The median CD4 count of PLWH was 352 cells/µL (IQR: 235–619), the median time since HIV diagnosis was 14.8 years, and 97.1% had a viral load of < 200 HIV RNA copies/mL. The number receiving ART at baseline was 63/68 (92.6%). Three individuals who were not on ART but who were virally suppressed at the time of admission were either elite or post‐treatment controllers.
TABLE 2.
Characteristics of HIV infection in cohort of people living with HIV (PLWH)
| N/median | %/IQR | |
|---|---|---|
| All PLWH (n = 68) | ||
| Median time since HIV diagnosis (years) (n = 59) | 14.8 | 10.2–18.8 |
| Median CD4 T‐cell count at time of COVID‐19 diagnosis (cells/µL) (n = 67) | 352 | 235–619 |
| Median CD4:CD8 ratio (n = 52) | 0.88 | 0.4–1.2 |
| Median CD4 percentage (n = 57) | 30 | 21–36 |
| Patients with viral load < 200 HIV RNA copies/mL (n = 68) | 66 | 97.1% |
| At time of COVID‐19 diagnosis, number of patients on antiretroviral regimens containing the following: (n = 63) | ||
| Tenofovir disoproxil | 17 | 27.0% |
| Tenofovir alafenamide | 21 | 33.3% |
| Integrase strand transfer inhibitors | 30 | 47.6% |
| Protease inhibitors | 21 | 33.3% |
| Nonnucleoside reverse transcriptase inhibitors | 17 | 27.0% |
| Number of patients not receiving antiretrovirals | 5 | 7.4% |
| PLWH with CD4 count < 200 cells/µL and CD4 percentage < 14% (n = 5) | ||
| Median time since HIV diagnosis (years) (n = 5) | 9 | 3–12 |
| Median CD4 T‐cell count at time of COVID‐19 diagnosis (cells/µL) (n = 5) | 83 | 76–139 |
| Median CD4:CD8 ratio (n = 5) | 0.2 | 0.17–0.2 |
| Median CD4 T‐cell percentage (n = 5) | 12 | 10–12 |
| Patients with viral load < 200 copies/mL (n = 5) | 4 | 80.0% |
| At time of COVID‐19 diagnosis, number of patients on antiretroviral regimens containing the following: | ||
| Tenofovir disoproxil | 0 | 0.0% |
| Tenofovir alafenamide | 1 | 20.0% |
| Integrase strand transfer inhibitor | 2 | 40.0% |
| Protease inhibitors | 1 | 20.0% |
| Nonnucleoside reverse transcriptase inhibitor | 1 | 20.0% |
| Not on antiretrovirals | 1 | 20.0% |
Of the immunosuppressed patients with HIV, the median time since HIV diagnosis was shorter at 9 years, and the median (IQR) CD4 count was 83 (76–139) cells/µL. Four out of five (80%) had viral load < 200 copies/mL and were receiving ART.
Clinical outcomes
The unadjusted cumulative hazard of patients reaching the primary outcome was 43% lower in PLWH than in HIV‐negative patients (p = 0.005) (Figure 1). After adjustment for ethnicity, frailty, baseline hypoxaemia, duration of symptoms prior to baseline, BMI categories, and comorbidities including hypertension, chronic cardiac disease, chronic lung disease, active malignancy, diabetes and chronic renal disease, HIV status was associated with a 30% reduced hazard for clinical improvement or discharge, but this finding was not statistically significant [adjusted hazard ratio (aHR) = 0.70, 95% confidence interval (CI): 0.43–1.17, p = 0.18] (Table 3). Greater baseline clinical frailty scores (aHR = 0.79, 95% CI: 0.65, 0.95, p = 0.011) and malignancy (aHR = 0.37, 95% CI: 0.17–0.82, p = 0.014) remained associated after adjustment. There was a trend for patients at either end of the BMI categories being associated with lower hazards to achieving the primary outcome (BMI < 25 kg/m2: aHR = 0.46, 95% CI: 0.21–0.99, p = 0.047).
FIGURE 1.
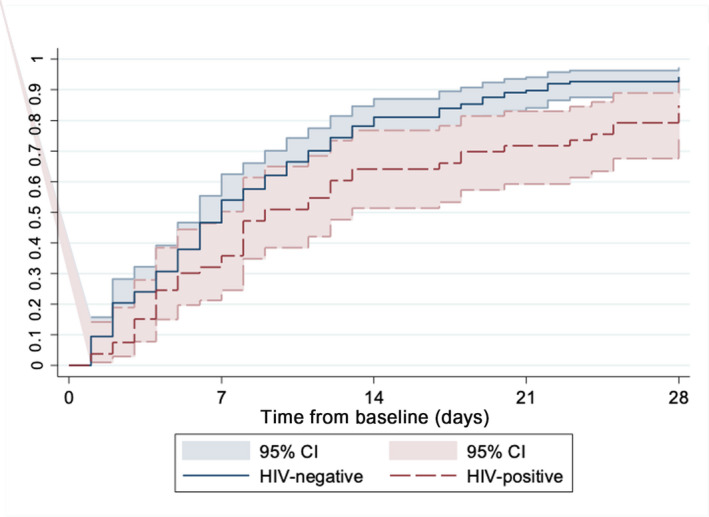
Proportion who achieved improvement by two or more points or discharged from hospital [Colour figure can be viewed at wileyonlinelibrary.com]
TABLE 3.
Primary outcomes and mortality outcomes analysis
| Variable | Reference variable | Univariable | Multivariable | ||||
|---|---|---|---|---|---|---|---|
| HR | 95% CI | p‐value | HR | 95% CI | p‐value | ||
| Primary outcome analysis – factors associated with time to clinical improvement or discharge | |||||||
| HIV‐positive status | HIV‐negative status | 0.57 | 0.39–0.85 | 0.005 | 0.70 | 0.43–1.17 | 0.18 |
| Ethnicity – BAME | White | 0.59 | 0.39–0.89 | 0.012 | 0.86 | 0.52–1.42 | 0.55 |
| Clinical Frailty Score – per 1 higher | 0.74 | 0.63–0.86 | < 0.0001 | 0.79 | 0.65–0.95 | 0.011 | |
| BMI (kg/m2) | 25–30 | 1.00 | 1.00 | ||||
| < 25 | 0.49 | 0.26–0.96 | 0.12 | 0.46 | 0.21–0.99 | 0.047 | |
| 30–35 | 0.96 | 0.49–1.90 | 0.99 | 0.47–2.11 | 0.98 | ||
| > 35 | 0.65 | 0.32–1.32 | 0.65 | 0.29–1.48 | 0.30 | ||
| Hypoxic at admission | Not hypoxic at admission | 0.80 | 0.54–1.18 | 0.27 | 0.67 | 0.41–1.09 | 0.10 |
| Days with symptoms at admission – per 1 day longer | 1.02 | 0.98–1.06 | 0.28 | 1.00 | 0.95–1.04 | 0.94 | |
| Hypertension | No comorbidity | 0.70 | 0.46–1.06 | 0.094 | 0.88 | 0.52–1.47 | 0.63 |
| Chronic cardiac disease | No comorbidity | 0.49 | 0.24–0.99 | 0.048 | 0.77 | 0.34–1.74 | 0.53 |
| Chronic lung disease | No comorbidity | 0.76 | 0.38–1.55 | 0.45 | 1.08 | 0.48–2.41 | 0.85 |
| Asthma | No comorbidity | 1.37 | 0.75–2.50 | 0.31 | |||
| Neurological condition | No comorbidity | 1.17 | 0.62–2.21 | 0.62 | |||
| Active malignancy | No comorbidity | 0.38 | 0.19–0.77 | 0.007 | 0.37 | 0.17–0.82 | 0.014 |
| Diabetes | No comorbidity | 0.79 | 0.50–1.22 | 0.29 | 0.73 | 0.43–1.25 | 0.26 |
| Rheumatological disease | No comorbidity | 1.57 | 0.74–3.33 | 0.24 | |||
| Chronic renal disease | No comorbidity | 0.51 | 0.29–0.90 | 0.019 | 0.79 | 0.40–1.58 | 0.51 |
| Mortality analysis – Factors associated with time to death | |||||||
| HIV‐positive status | HIV‐negative status | 1.18 | 0.54–2.60 | 0.68 | |||
| Ethnicity – BAME | White | 2.29 | 0.90–5.86 | 0.083 | |||
| Clinical Frailty Score – per 1 higher | 1.24 | 0.97–1.60 | 0.092 | ||||
| Hypoxic at admission | Not hypoxic at admission | 2.08 | 0.69–6.26 | 0.20 | |||
| Days with symptoms at admission – per 1 day longer | 0.98 | 0.89–1.09 | 0.72 | ||||
| BMI (kg/m2) | 25–30 | 1.00 | |||||
| < 25 | 1.17 | 0.30–4.55 | 0.72 | ||||
| 30–35 | 1.28 | 0.22–7.27 | |||||
| > 35 | 2.56 | 0.43–15.2 | |||||
| Comorbidities – per one additional | 1.16 | 0.89–1.52 | 0.28 | ||||
| Hypertension | No comorbidity | 1.46 | 0.55–3.85 | 0.45 | |||
| Chronic cardiac disease | No comorbidity | 1.66 | 0.65–4.28 | 0.29 | |||
| Chronic lung disease | No comorbidity | 2.38 | 0.75–2.55 | 0.14 | |||
| Asthma | No comorbidity | 0.80 | 0.19–3.40 | 0.77 | |||
| Neurological condition | No comorbidity | 0.64 | 0.15–2.78 | 0.56 | |||
| Active malignancy | No comorbidity | 2.59 | 0.80–8.40 | 0.11 | |||
| Diabetes | No comorbidity | 1.00 | 0.44–2.27 | 1.00 | |||
| Rheumatological disease | No comorbidity | 3.00 | 0.25–35.8 | 0.39 | |||
| Chronic renal disease | No comorbidity | 1.48 | 0.61–3.55 | 0.39 | |||
Abbreviations: BAME, black, Asian and minority ethnic; BMI, body mass index; CI, confidence interval; HR, hazard ratio.
Results from Cox proportional hazards model stratified by matching clusters, with missing data accounted for using multiple imputation with chained equations (20 simulated datasets combined using Rubin's rules). Clinical centre, date of admission, gender, age and index of multiple deprivation decile were not included as covariables as these were matching variables.
The sensitivity analyses (Table 4) generally found consistent results. A complete case analysis (n = 217) led to greater attenuation (aHR = 0.90, 95% CI: 0.51–1.59, p = 0.72). When not adjusting for ethnicity, the association between HIV and the primary outcome then reached statistical significance at the 5% level (aHR = 0.62, 95% CI: 0.39–0.96, p = 0.031), suggesting the contribution of confounding effect of ethnicity was not fully explained by matching for geographical deprivation. Analyses adjusted for the matching variables instead of stratifying by clusters led to an attenuated association (aHR = 0.90, 95% CI: 0.63–1.30, p = 0.58).
TABLE 4.
Sensitivity analyses considering the association between HIV status and time to improvement or discharge
| Adjustments made for: | Change from primary analysis | HR PLWH vs HIV‐negative | 95% CI | p‐value |
|---|---|---|---|---|
| Primary analyses | ||||
| Ethnicity, CFS, hypoxaemia, days symptoms, hypertension, cardiac, pulmonary, active malignancy, diabetes, CKD | – | 0.70 | 0.43–1.17 | 0.18 |
| Sensitivity analyses | ||||
| Complete case analyses | Exclude cases with missing data (n = 217) | 0.9 | 0.51–1.59 | 0.72 |
| Ethnicity, CFS, number of comorbidities | Exclude COVID‐related factors (hypoxaemia, duration of symptoms) | 0.68 | 0.43–1.06 | 0.088 |
| CFS, hypoxaemia, duration of symptoms (days), number of comorbidities | Exclude ethnicity | 0.62 | 0.39–0.96 | 0.031 |
| Age a , ethnicity, CFS, hypoxaemia, duration of symptoms (days), number of comorbidities | Add age | 0.67 | 0.42–1.06 | 0.088 |
| Ethnicity, CFS, hypoxaemia, duration of symptoms, number of comorbidities | Exclude BMI | 0.76 | 0.48–1.21 | 0.25 |
| Ethnicity, CFS, hypoxaemia, duration of symptoms, number of comorbidities, lymphocytes | Include lymphocytes | 0.70 | 0.42–1.18 | 0.18 |
All results from Cox proportional hazards model, stratified by matching cluster and using multiple imputation with chained equations to account for missing data (20 simulations, results combined using Rubin's rules).
Abbreviations: PLWH, people living with HIV; HR, hazard ratio; CI, confidence interval; CFS, Clinical Frailty Score; CKD, chronic kidney disease.
Additionally adjusting for age to account for any residual confounding (clusters were age‐matched to within 5 years).
HIV status was not associated with difference in mortality rates (HR = 1.18, 95% CI: 0.54–2.60, p = 0.68) (Table 3; Figure 2). Secondary outcomes are summarized in Table 5. The PLWH had longer overall duration of hospitalization from COVID‐19 diagnosis (median 10 vs. 7.5 days, p = 0.0061). A higher proportion of PLWH required mechanical ventilation (23.5% vs. 17.1%, p = 0.25) during admission but did not meet significance, and if admitted to critical care, the median duration in critical care was similar between groups (14 vs. 15; p = 0.83) (Table S4). A minority of patients received COVID‐19‐specific trial medications: four PLWH (two received high‐dose steroids, one tocilizumab and one remdesivir), and five HIV‐negative patients (two received high‐dose steroids, two tocilizumab and one lopinavir/ritonavir).
FIGURE 2.
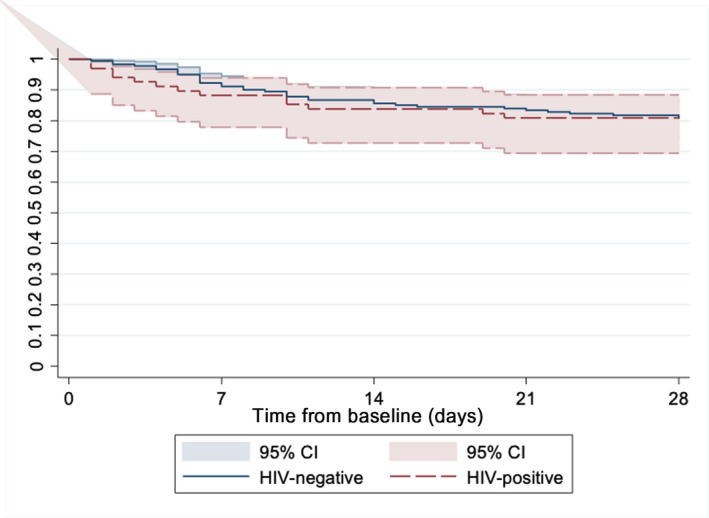
Proportion of patient deaths within 28 days of COVID‐19 diagnosis [Colour figure can be viewed at wileyonlinelibrary.com]
TABLE 5.
Secondary outcomes by day 28 following hospitalization, stratified by HIV status
| HIV‐positive individuals | HIV‐negative individuals | p‐values | |||
|---|---|---|---|---|---|
| N = 68 | %/IQR | N = 181 | %/IQR | ||
| Patients achieving primary outcome (two or more points improvement or discharge from hospital) | 47 | 69.1% | 138 | 76.2% | 0.25 |
| Recorded outcome by day 28 | 0.266 | ||||
| Left hospital alive | 45 | 66.2% | 133 | 73.4% | |
| Remained inpatient on ward | 5 | 7.4% | 8 | 4.4% | |
| Remained inpatient in critical care (ICU + HDU) | 5 | 7.4% | 5 | 2.8% | |
| Death | 13 | 19.1% | 35 | 19.3% | |
| Median duration of hospitalization (days) | 10 (n = 65) | 6, 23 | 7.5 (n = 178) | 4, 14 | 0.0061 |
| Required mechanical ventilation during admission | 16 | 23.5% | 31 | 17.1% | 0.25 |
| Received trial drug or specific COVID−19 therapy | 4 | 5.8% | 5 | 2.8% | – |
| Most abnormal investigation result during admission | |||||
| Peak white cell count (× 109/L) | 10.3 (n = 56) | 6.9, 14.3 | 9.9 (n = 170) | 6.6, 14.9 | 0.739 |
| Nadir lymphocytes count (× 109/L) | 0.8 (n = 54) | 0.5, 1.0 | 0.7 (n = 172) | 0.5, 1.0 | 0.694 |
| Peak C‐reactive protein (mg/L) | 191 (n = 54) | 106, 315 | 165 (n = 172) | 79, 287 | 0.247 |
| Disease severity on seven‐point scale by day 28 | 0.379 | ||||
| 1 – not hospitalized with resumption of normal activities | 11 | 16.2% | 31 | 17.1% | |
| 2 – not hospitalized but unable to resume normal activities | 34 | 50.0%% | 102 | 56.4% | |
| 3 – hospitalized not requiring supplemental oxygen | 5 | 7.4% | 5 | 2.8% | |
| 4 – hospitalized requiring supplemental oxygen | 1 | 1.5% | 4 | 2.2% | |
| 5 – hospitalized requiring nasal high‐flow oxygen therapy, non‐invasive ventilation, or both | 0 | 0.0% | 0 | 0.0% | |
| 6 – hospitalized, requiring ECMO, invasive mechanical ventilation, or both | 4 | 5.9%% | 4 | 2.2% | |
| 7 – death or palliation | 13 | 19.9% | 35 | 19.3% | |
| PLWH with CD4 T‐cell counts < 200cells/µL and CD4 percentage < 14% (n = 5) | |||||
| Death by day 28 | 0 | 0.0% | |||
| Median length of hospitalization (days) | 11 | 10, 16 | |||
| Patients requiring mechanical ventilation | 2 | 40.0% | |||
Abbreviations: IQR, interquartile range; ECMO, extracorporeal membrane oxygenation; ITU, intensive care unit; HDU, high‐dependency unit.
The PLWH were more likely to have a lower nadir haemoglobin level during admission compared with HIV‐negative patients (103 vs. 116g/L, p = 0.0029); however, there was no significant difference between the most abnormal results for white cell count, lymphocyte count, C‐reactive protein (Table 5), platelet count, and renal or liver function results during admission (Table S4).
There were no deaths in the five immunosuppressed patients who were HIV‐positive (Table 5). The median length of hospitalization was 11 days. Two out of five (40%) required mechanical ventilation.
DISCUSSION
Key results and interpretation
There is growing consensus that PLWH cohorts have worse outcomes for COVID‐19 infection than do people without HIV. The relative contribution of HIV compared with underlying health conditions, socioeconomic deprivation and frailty is still unclear and often disproportionately represented in PLWH, emphasizing the importance of appropriate comparison groups in observational studies. In our cohort matched for age, gender and deprivation, the effect of HIV was ameliorated, although larger studies with additional power would overcome the wide confidence intervals seen in our primary outcome.
There is a disproportionate impact on COVID‐19 in people with black, Asian and minority ethnic (BAME) backgrounds, even when age, sex and comorbidities are adjusted for [4]. When considering matching criteria, ethnicity was not included, as ethnicity has been previously reported to be poorly defined or collected [17]. Instead, IMDD was used to address the contribution of geographical deprivation to COVID‐19 outcomes. Ethnicity was subsequently adjusted for in the multivariable analysis and explored further in the sensitivity analyses. The change in significance level when ethnicity was removed from the multivariable model suggests that the study size was underpowered to fully explain the confounding effect of ethnicity on COVID‐19 outcomes by geographical deprivation alone, or that other possible reasons for poorer outcomes of COVID‐19 infections in BAME people were contributing to inequalities in outcomes by ethnicity. Other studies have raised the contributions of racial discrimination, measurement bias of pulse oximetry, cultural factors, poor housing and overcrowding, likelihood of lower‐paying essential jobs, and the prevalence of comorbidities towards these inequalities [23, 24, 25].
People living with HIV were frailer, as measured by the CFS, than their matched HIV comparators and greater frailty predicted worse outcomes. The CFS has been recommended by UK national guidelines for COVID‐19 [26] for assessment of all adults on admission, and while not validated in those aged < 65 years, the COPE study showed that the CFS was predictive of increased mortality and longer duration of hospitalization, even after adjustment for age and comorbidities, including in patients under 65 [27]. The CFS may be useful as a tool to guide decision‐making even in PLWH admitted with COVID‐19.
Comparison with other studies
This study adds to the growing literature describing the complex interplay between HIV and COVID‐19 [6, 7, 9, 11, 12, 14, 16, 28]. The ISARIC findings [7] suggest that PLWH had an age‐adjusted 47% increased risk of mortality by day 28, which increased to 100% after adjustment. The UK population‐wide OPENSAFELY database showed a 3.8‐fold higher risk of COVID‐19 death in PLWH, but both studies were unmatched, unable to include HIV markers, ART use and possibility of incomplete or misclassified HIV coding. Similarly, HIV was associated with higher hazards for mortality in South Africa [8] and the USA [12, 33]. In comparison, the association of HIV status with differences in time to clinical improvement or discharge from hospital were attenuated once confounders were adjusted for in cohorts matched for age, gender and deprivation. This study was also able to adjust for baseline frailty and comorbidities, and to provide details of HIV disease characteristics. Compared with the other studies that demonstrated increased mortality, the follow‐up period may not have been sufficient to account for the time lag between COVID‐19 diagnosis and mortality. The effect of worse outcomes associated with a lower BMI (< 25 kg/m2) was not consistent with that seen in other studies [8, 12, 13] and may merit further investigation in cohorts of PLWH.
Immunosuppression and COVID‐19
In this study, the numbers of immunosuppressed PLWH were small, and it was not possible to draw definitive comparisons of the severity of COVID‐19 outcomes in people with low CD4 counts. Reports of COVID‐19 in immunosuppressed patients are still limited [11, 28, 30, 36]. A recent study suggested that a CD4 count < 350 cells/µL or nadir CD4 count < 200 cells/µL was associated with severity of COVID [36]. While the OPENSAFELY platform showed patients with other immunosuppressive conditions had a 2.21‐fold adjusted increased risk for COVID‐19‐related mortality [37], and a meta‐analysis of eight studies similarly showed a 3.29‐fold increased risk of severe COVID‐19 disease [38], these studies did not provide details of HIV infection or treatment in PLWH included in the immunodeficiency categories. Larger studies with detailed markers of immunity are required to further evaluate the risk of severe COVID‐19 disease in immunosuppressed PLWH.
Strengths and limitations
This study provides direct comparison to account not just for baseline demographics and key comorbidities, but also socioeconomic deprivation and baseline frailty, and describes HIV disease characteristics and HIV treatment detail. We were also able to analyse time to clinical improvement or hospital discharge as a primary non‐mortality outcome.
There were some limitations. First, the study was restricted to hospitalized patients only, which might introduce collider bias, where variables that lead to hospitalization may also directly affect outcomes; caution is required in generalizing the findings beyond hospitalized patients. Sites in this study were predominantly within the Greater London area, but London was the epicentre of the first peak of COVID‐19 hospitalizations in the UK, and the data were therefore likely to be reflective of hospitalized cases across the UK. A total of 10.5% of patients included in the HIV‐negative cohort were presumed negative due to the lack of availability of an HIV test result within the previous 12 months. These patients were included because the estimated numbers of people living with undiagnosed HIV in the UK have fallen dramatically, with 6% of all PLWH estimated to have undiagnosed HIV in 2019 [39]. Thus the probability of an undiagnosed HIV‐positive person being included in the HIV‐negative cohort was low.
Data were collected retrospectively and may reflect retrospective case ascertainment, as well as fields with missing data, such as BMI, resulting in bias as patients who were discharged early may not have results available. At the other extreme, patients may have been too unwell to have their height or weight measured accurately. However, results excluding BMI from the multivariable analyses were consistent with the primary analysis. Hospitalization duration may be biased where clinical decision‐making was influenced by the patient's HIV status, leading to longer hospitalizations in the early phase of the pandemic when outcomes of PLWH admitted with COVID‐19 were still unclear. However, analyses of 28‐day mortality did not show worse outcomes compared with the HIV‐negative cohort. Follow‐up was ended at the time of discharge, and the question of whether patients could resume their usual activities in full was only assessed on the day of discharge. Thus, it was not possible to capture whether patients subsequently improved or deteriorated with follow‐up complications. We were also not able to include complications or mortality outcomes beyond 28 days and are unable to comment on long‐term complications of COVID‐19.
The study ordinal scale end‐points described by Cao et al. [18] were originally described for use in therapeutic trials. The use of the ordinal scale in this retrospective observation study allowed finer inspection of non‐mortality outcomes, as compared with the larger sample sizes and longer follow‐up required to account for the lag in mortality data. Finally, although these data were collected during the early pandemic, and despite the fact that, at the time of writing, the advent of SARS‐CoV‐2 variants is associated with rising cases and hospitalizations across many countries, and there is also an uneven distribution of the vaccination, particularly in the global south, the results remain pertinent to informing treatment guidelines and decision‐making, particularly in areas with limited vaccination or interventions available. Further data are required to understand the impact of SARS‐CoV‐2 vaccination and novel variants on COVID‐19 outcomes in PLWH, particularly in immunosuppressed individuals [40].
CONCLUSIONS
This study highlights the importance of an appropriate comparison group when assessing outcomes of PLWH hospitalized with COVID‐19. Other important factors, including increased frailty and comorbidities, may be more prevalent in an ageing population of PLWH with well‐controlled HIV in the era of effective ART, contributing to differences in COVID‐19 outcomes associated with HIV status.
CONFLICT OF INTEREST
MJL has received grants and honoraria from Gilead Sciences and Viiv Healthcare not related to this work. SF has received research grants to her institution from National Institutes of Health (NIH), Medical Research Council (MRC) and Bill and Melinda Gates Foundation (BMGF). JT has received support for virtual conference registration from ViiV Healthcare and research grants from the Medical Research Council and the British HIV Association not related to this work. CvH has received educational grants, conference support and advisory board fees from ViiV Healthcare, Gilead Sciences and Merck, Sharkp & Dohme not related to this work. MP reports grants and personal fees from Gilead Sciences and personal fees from Qiagen, outside the submitted work. MP is supported by a National Institute for Health Research (NIHR) Development and Skills Enhancement Award (NIHR301192) and in receipt of funding from UK Research & Innovation (UKRI) / MRC (MR/V027549/1). He acknowledges the support from UKRI, the NIHR Leicester Biomedical Research Centre (BRC) and NIHR Applied Research Collaboration (ARC) East Midlands. No other competing interests, financial relationships with any organizations that might have an interest in the submitted work, or other relationships or activities that could appear to have influenced the submitted work have been reported by other authors.
AUTHOR CONTRIBUTIONS
MJL, RK, AN, JF and CS conceptualized and designed the study. LBS, JL, NF and RS contributed to pilot data extraction. STD, SF, CO, AP, JT, CvH, AN, JF and LH contributed to obtaining ethics and local regulatory approvals. MJL, LG, LH, SL, RM, AP, PP, MP, KR, HS, ESK, RS, JJT, JT, M Williamson and M Wiselka contributed to data collection. MJL and CS, performed data analysis. MJL, SF, RK, AN, JF and CS wrote the manuscript draft. All authors provided critical review of the findings and reviewed the final submission.
Supporting information
Table S1‐S4
ACKNOWLEDGEMENTS
This study used data collected in the routine care of NHS patients, by the NHS staff involved in their care and we acknowledge both patients and staff in their contributions to this study. We acknowledge the support of Alice Sharp, Elizabeth Bruna, Marie‐Rose Dwek, Jo Bagshaw, Venkateshwaran Sivaraj and Shirin Hussein.
Lee MJ, Snell LB, Douthwaite ST, et al. Clinical outcomes of patients with and without HIV hospitalized with COVID‐19 in England during the early stages of the pandemic: a matched retrospective multi‐centre analysis (RECEDE‐C19 study). HIV Med. 2022;23:121–133. doi: 10.1111/hiv.13174
Meetings presented: AIDS 2020: Virtual, June 2020; virtual CROI 2021, March 2021; 5TH Joint virtual BHIVA‐BASHH conference, April 2021.
REFERENCES
- 1. Zhou F, Yu T, Du R, et al. Clinical course and risk factors for mortality of adult inpatients with COVID‐19 in Wuhan, China: a retrospective cohort study. Lancet 2020; 395(10229):1054‐1062. [DOI] [PMC free article] [PubMed] [Google Scholar]
- 2. Richardson S, Hirsch JS, Narasimhan M, et al. Presenting characteristics, comorbidities, and outcomes among 5700 patients hospitalized with COVID‐19 in the New York City area. JAMA 2020;323(20):2052. [DOI] [PMC free article] [PubMed] [Google Scholar]
- 3. Docherty AB, Harrison EM, Green CA, et al. Features of 20 133 UK patients in hospital with covid‐19 using the ISARIC WHO clinical characterisation protocol: prospective observational cohort study. BMJ 2020; 369:m1985. Epub ahead of print. [DOI] [PMC free article] [PubMed] [Google Scholar]
- 4. Sze S, Pan D, Nevill CR, et al. Ethnicity and clinical outcomes in COVID‐19: a systematic review and meta‐analysis. EClinicalMedicine 2020;29‐30:100630. [DOI] [PMC free article] [PubMed] [Google Scholar]
- 5. Sun J, Patel RC, Zheng Q, Madhira V, Olex AL & Islam JY et al. COVID‐19 Disease Severity among People with HIV Infection or Solid Organ Transplant in the United States: A Nationally‐representative. Multicenter, Observational Cohort Study. medRxiv, 2021.
- 6. Bhaskaran K, Rentsch CT, MacKenna B, et al. HIV infection and COVID‐19 death: a population‐based cohort analysis of UK primary care data and linked national death registrations within the OpenSAFELY platform. Lancet HIV 2020;E24–E32. Epub ahead of print. [DOI] [PMC free article] [PubMed] [Google Scholar]
- 7. Geretti AM, Stockdale AJ, Kelly SH, et al. Outcomes of COVID‐19 related hospitalization among people with HIV in the ISARIC WHO Clinical Characterization Protocol (UK): a prospective observational study. Clin Infect Dis 2020;ciaa1605. Epub ahead of print. [DOI] [PMC free article] [PubMed] [Google Scholar]
- 8. Boulle A, Davies M‐A, Hussey H, et al. Risk factors for COVID‐19 death in a population cohort study from the Western Cape Province, South Africa. Clin Infect Dis 2020;ciaa1198. Epub ahead of print. [DOI] [PMC free article] [PubMed] [Google Scholar]
- 9. Bertagnolio S. Clinical characteristics and proctnostic factors in people living with HIV hospitalized with COVID‐19: findings from the WHO Global Clinical Platform. In: 11th International AIDS Society Conference on HIV Science. 2021.
- 10. Karmen‐Tuohy S, Carlucci PM, Zervou FN, et al. Outcomes among HIV‐positive patients hospitalized With COVID‐19. J Acquir Immune Defic Syndr 2020;85(1):6‐10. [DOI] [PMC free article] [PubMed] [Google Scholar]
- 11. Sigel K, Swartz T, Golden E, et al. Coronavirus 2019 and people living with human immunodeficiency virus: outcomes for hospitalized patients in New York City. Clin Infect Dis 2020;71(11):2933‐2938. [DOI] [PMC free article] [PubMed] [Google Scholar]
- 12. Hadi YB, Naqvi SFZ, Kupec JT, Sarwari AR. Characteristics and outcomes of COVID‐19 in patients with HIV: a multicentre research network study. AIDS 2020;34(13):F3‐F8. [DOI] [PMC free article] [PubMed] [Google Scholar]
- 13. Stoeckle K, Johnston CD, Jannat‐Khah DP, et al. COVID‐19 in hospitalized adults with HIV. Open Forum Infect Dis 2020;7(8):ofaa327. [DOI] [PMC free article] [PubMed] [Google Scholar]
- 14. Venturas J, Zamparini J, Shaddock E, et al. Comparison of outcomes in HIV‐positive and HIV‐negative patients with COVID‐19. J Infect 2021;83(2):217‐227. [DOI] [PMC free article] [PubMed] [Google Scholar]
- 15. Schouten J, Wit FW, Stolte IG, et al. Cross‐sectional comparison of the prevalence of age‐associated comorbidities and their risk factors between HIV‐infected and uninfected individuals: The AGEhIV Cohort Study. Clin Infect Dis 2014;59(12):1787‐1797. [DOI] [PubMed] [Google Scholar]
- 16. Nomah DK, Reyes‐Uruena J, Diaz Y, Moreno S, Aceiton J, Bruguera A, et al. Unsuppressed plasma HIV‐RNA viral load is associated with worse COVID‐19 outcomes among people living with HIV [Internet]. 11th International AIDS Society Conference on HIV Science abstract OALB0301. 2021.
- 17. Bokor‐Billmann T, Langan EA, Billmann F. The reporting of race and/or ethnicity in the medical literature: a retrospective bibliometric analysis confirmed room for improvement. J Clin Epidemiol 2020; 119: 1‐6. [DOI] [PubMed] [Google Scholar]
- 18. Cao B, Wang Y, Wen D, et al. A trial of lopinavir‐ritonavir in adults hospitalized with severe Covid‐19. N Engl J Med 2020;382 (19):1787–1799. [DOI] [PMC free article] [PubMed] [Google Scholar]
- 19. Ministry of Housing Communities and Local Government . English indices of deprivation. 2019.
- 20. Rockwood K, Song X, MacKnight C, et al. A global clinical measure of fitness and frailty in elderly people. CMAJ 2005;173(5):489‐495. [DOI] [PMC free article] [PubMed] [Google Scholar]
- 21. Wake RM, Morgan M, Choi J, Winn S. Reducing nosocomial transmission of COVID‐19: Implementation of a COVID‐19 triage system. Clin Med J R Coll Physicians Lond 2020;20(5):e141‐e145. [DOI] [PMC free article] [PubMed] [Google Scholar]
- 22. Lee MJ, Smith C, Snell LB, Lwanga J, Simons R, Fitzgerald N, et al. Comparative outcomes in hospital admissions with COVID‐19 in people living with HIV and people living without HIV: A retrospective study. In: 23rd International AIDS Conference. 2020. p. Abstract LBPEB09.
- 23. Khunti K, Singh AK, Pareek M, Hanif W. Is ethnicity linked to incidence or outcomes of covid‐19? BMJ 2020; 369. [DOI] [PubMed] [Google Scholar]
- 24. Sjoding MW, Dickson RP, Iwashyna TJ, Gay SE, Valley TS. Racial bias in pulse oximetry measurement. N Engl J Med 2020;383(25):2477‐2478. [DOI] [PMC free article] [PubMed] [Google Scholar]
- 25. Batty GD, Gaye B, Gale C, Hamer M, Lassale C. Explaining ethnicity disparities in COVID‐19 mortality: population‐based, prospective cohort study. medRxiv Prepr Serv Heal Sci. 2021.
- 26. NICE . COVID‐19 rapid guideline: critical care in adults. Natl Inst Heal Care Excell 2020. www.nice.org.uk/guidance/ng159. Accessed September 1, 2020. [PubMed] [Google Scholar]
- 27. Hewitt J, Carter B, Vilches‐Moraga A, et al. The effect of frailty on survival in patients with COVID‐19 (COPE): a multicentre, European, observational cohort study. Lancet Public Heal 2020;5(8):e444‐e451. [DOI] [PMC free article] [PubMed] [Google Scholar]
- 28. Blanco JL, Ambrosioni J, Garcia F, et al. COVID‐19 in patients with HIV: clinical case series. Lancet HIV 2020;7:e314‐e316. [DOI] [PMC free article] [PubMed] [Google Scholar]
- 29. Inciarte A, Gonzalez‐Cordon A, Rojas J, et al. Clinical characteristics, risk factors, and incidence of symptomatic coronavirus disease 2019 in a large cohort of adults living with HIV: a single‐center, prospective observational study. AIDS 2020;34(12):1775‐1780. [DOI] [PMC free article] [PubMed] [Google Scholar]
- 30. Härter G, Spinner CD, Roider J, Bickel M, Krznaric I, Grunwald S, et al. COVID‐19 in people living with human immunodeficiency virus: A case series of 33 patients. 10.1101/2020.04.28.20073767 [DOI] [PMC free article] [PubMed]
- 31. Mirzaei H, McFarland W, Karamouzian M, Sharifi H. COVID‐19 among people living with HIV: a systematic review. AIDS and Behavior, Springer, 2020. [DOI] [PMC free article] [PubMed]
- 32. Gudipati S, Brar I, Murray S, McKinnon JE, Yared N, Markowitz N. Descriptive analysis of patients living with HIV affected by COVID‐19. J Acquir Immune Defic Syndr 2020;85(2):123‐126. [DOI] [PMC free article] [PubMed] [Google Scholar]
- 33. Tesoriero JM, Swain C‐AE, Pierce JL, et al. COVID‐19 outcomes among persons living with or without diagnosed HIV infection in New York State. JAMA Netw Open 2021;4(2):e2037069. [DOI] [PMC free article] [PubMed] [Google Scholar]
- 34. Mondi A, Cimini E, Colavita F, et al. COVID‐19 in people living with HIV: clinical implications of dynamics of the immune response to SARS‐CoV‐2. J Med Virol 2021;93(3):1796‐1804. [DOI] [PMC free article] [PubMed] [Google Scholar]
- 35. Cooper TJ, Woodward BL, Alom S, Harky A. Coronavirus disease 2019 (COVID‐19) outcomes in HIV/AIDS patients: a systematic review. HIV Med 2020;21(9):567‐577. [DOI] [PMC free article] [PubMed] [Google Scholar]
- 36. Hoffmann C, Casado JL, Härter G, et al. Immune deficiency is a risk factor for severe COVID‐19 in people living with HIV. HIV Med 2021;22(5):372‐378. [DOI] [PubMed] [Google Scholar]
- 37. Williamson EJ, Walker AJ, Bhaskaran K, et al. Factors associated with COVID‐19‐related death using OpenSAFELY. Nature 2020;584(7821):430‐436. [DOI] [PMC free article] [PubMed] [Google Scholar]
- 38. Gao Y, Chen Y, Liu M, Shi S, Tian J. Impacts of immunosuppression and immunodeficiency on COVID‐19: a systematic review and meta‐analysis. J Infect 2020;81:e93‐e95. [DOI] [PMC free article] [PubMed] [Google Scholar]
- 39. Public Health England . Trends in HIV testing, new diagnoses and people receiving HIV‐related care in the United Kingdom: data to the end of December 2019. 2020.
- 40. Kemp SA, Collier DA, Datir RP, et al. SARS‐CoV‐2 evolution during treatment of chronic infection. Nature 2021;592:277‐282. [DOI] [PMC free article] [PubMed] [Google Scholar]
Associated Data
This section collects any data citations, data availability statements, or supplementary materials included in this article.
Supplementary Materials
Table S1‐S4