CONFLICT OF INTEREST
The authors declare that there are no competing interest in relation to this work.
To the Editor,
The coronavirus disease 2019 (COVID‐19) pandemic is caused by severe acute respiratory syndrome coronavirus 2 (SARS‐CoV‐2). To better understand COVID‐19 the genetic and environmental factors on susceptibility and severity, detailed knowledge of regulation of genes required for viral entry into respiratory epithelial cells is needed.
We assessed the gene expression of SARS‐CoV‐2 receptors and activating proteases, and their regulation by smoking, inhaled‐corticosteroids (ICS), genetics/epigenetics using nasal and bronchial samples from nine independent cohorts (see extended methods, Table S1).
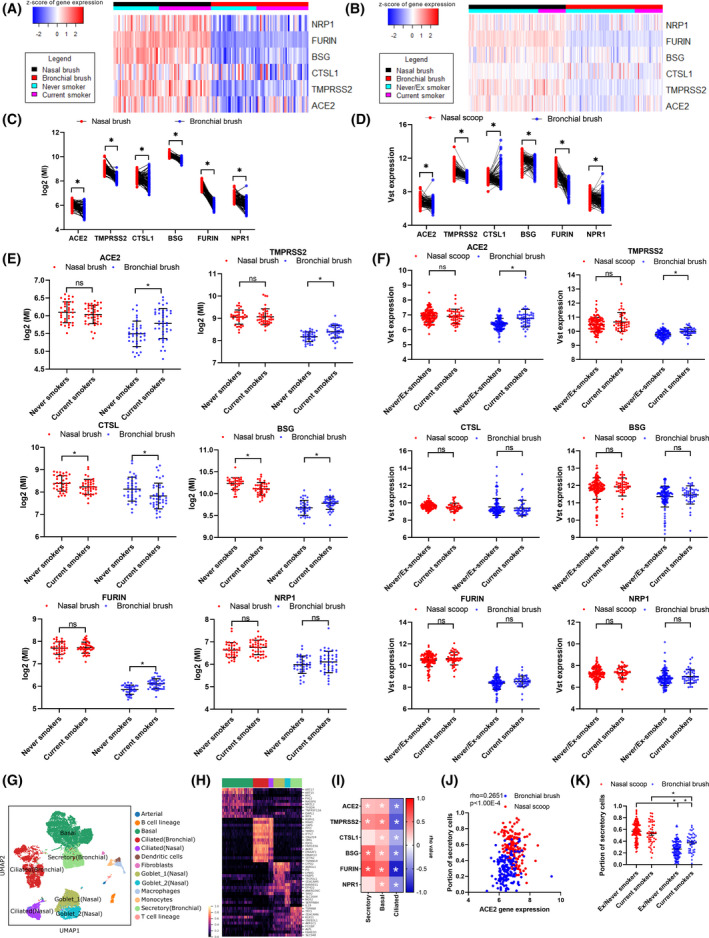
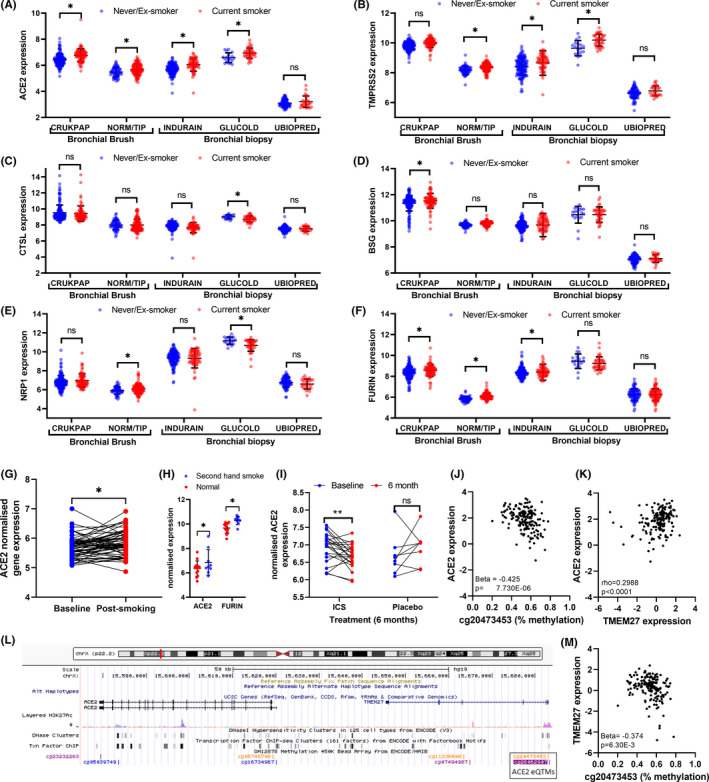
SARS‐CoV‐2 cell entry factor (SCEF) genes have higher expression levels in nose than bronchi in matched samples across two cohorts (Figure 1A–D, Table S2), mirroring results from previous smaller studies. 1 , 2 Smoking was associated with higher expression of ACE2, TMPRSS2, FURIN, and BSG in bronchial brushes, supporting a recent meta‐analysis, 3 but not in nasal brushes (Figure 1E,F). In contrast, smoking was associated with lower expression of CTSL in nasal and bronchial brushings (Table S3). The impact of smoking on the expression of ACE2 and BSG gene expression differs significantly between these tissues (Table S4). None of these genes were associated with sex or age. Cell‐type deconvolution of RNA‐seq data revealed that all SCEF genes strongly correlated with predicted secretory cell proportions across tissues (Figure 1G–I), in particular ACE2 (Figure 1J), in line with recent scRNA‐seq data. 3 , 4 We observed higher proportions of secretory cells (goblet & club cells) in bronchial samples from current smokers compared to ex/never‐smokers, which was not observed in nasal brushes (Figure 1K), which may explain the lack of increase of ACE2 expression in nasal samples. We next performed a cross‐sectional analysis for nasal samples in four adult cohorts (NORM/OLIVA (n = 76), CRUKPAP (n = 405), U‐BIOPRED (n = 89), and INCI (n = 79)); and one pediatric cohort: PIAMA (n = 291); and for bronchial samples in five populations: INDURAIN (n = 184), U‐BIOPRED (n = 108), GLUCOLD (n = 56), CRUKPAP (n = 228) and NORM/TIP (n = 167). In upper airways, CTSL expression was lower in current smokers compared to non‐smokers (Table S5). In lower airways, higher levels of ACE2 and TMPRSS2 were identified in current versus never/ex‐smokers, whereas smoking was associated with higher FURIN and BSG levels in brushed cells only (Figure 2A–F, Table S6). Acute smoke exposure (n = 63) and secondhand smoking (infants of parents who smoked n = 9 or did not smoke, n = 13) were found to associate with higher ACE2 expression (Figure 2G,H, Table S7 and S8).
FIGURE 1.

Expression genes required for SARS‐CoV‐2 entry into cells in nasal and bronchial brushes and relationship with goblets cells. Heatmaps and plots of SARS‐CoV‐2 cell entry related in matched nasal and bronchial brushes from the NORM (n = 77) (A & C) and CRUKPAP (n = 162) cohorts (B & D). Plots comparing ACE2, TMPRSS2, CTSL, BSG, FURIN, and NRP1 expression in current and ex/never‐smokers in nasal and bronchial brushes, (E) NORM and (F) CRUKPAP. Plots comparing ACE2 expression in ex‐smokers and duration of smoke cessation in nasal and bronchial brushes. (G) UMAP of merged bronchial biopsy and nasal brush single cell datasets. (H) Heatmap of selected genes associated with each epithelial cell type. (I) Correlation heatmap of cellular deconvolution cell proportions compared to SARS‐CoV‐2 cell entry related (Spearman's (rho) correlation was conducted). (J) Association of cellular deconvolution of Goblet cells with ACE2 expression. (K) Goblet/secretory cell fraction separated based on tissue type and smoking status. Cellular deconvolution was performed using AutoGeneS. Statistics for deconvolution results were conducted using Mann‐Whitney test, while the correlation heatmap was analyzed using Spearman correlation. *p < 0.05, ***p value < 0.001 Abbreviations: MI, microarray intensity; VST, variance‐stabilizing transformation. Statistics for deconvolution results were conducted using Mann‐Whitney test for unpaired and Wilcoxon for paired
FIGURE 2.

Transcriptional response of SARS‐CoV‐2 cell entry related genes to clinical characteristics, methylation, and environmental stimuli. Expression of (A) ACE2, (B) TMPRSS2, (C) CTSL, (D) BSG, (E) NRP1, and (F) FURIN in bronchial biopsies; INDURAIN (n = 207), U‐BIOPRED (n = 108) and GLUCOLD (n = 56) and bronchial brushes CRUKPAP dataset (n = 228) and NORM/TIP (n = 167), separated based on smoking status. The effect of acute smoke exposure on (G) ACE2 in bronchial brushings 24 h after smoking and not smoking 3 cigarettes. (H) The influence of secondhand smoke in children of SARS‐CoV‐2 cell entry related in bronchial biopsies. The influence of 6 month ICS and Placebo compared to baseline from bronchial biopsies of COPD patients, (I) ACE2. Top eQTM for (J) ACE2. (K) Correlation of ACE2 and TMEM27 (Spearman's (rho) correlation was conducted). (L) Diagram of the top CpG site associated with ACE2 expression. (M) EQTM for TMEM27 and the top CpG site associated with ACE2 expression. Statistics was done using an unpaired t‐test. *p < 0.05 Abbreviations: MI, microarray intensity VST, variance‐stabilizing transformation
No studies have investigated the longitudinal effects of ICS on SCEF genes in paired biopsies. 5 , 6 In steroid‐naive COPD patients, 6 months ICS ± LABA treatment decreased ACE2 expression (p = 0.009, Figure 2I, Table S9) compared to placebo in bronchial biopsies, while BSG and FURIN increased (p = 0.012 and p = 0.046, respectively).
No association of genetic variation with expression of SCEF genes was found in a well‐powered meta‐analysis of nasal: NORM (n = 93), CRUKPAP (n = 339) and PIAMA (n = 303), and bronchial samples: NORM/TIP (n = 150) and CRUKPAP (n = 215, Table S10). We next investigated whether DNA‐methylation is associated with SCEF expression. In pediatric nasal samples (PIAMA; n = 245), we identified eQTMs for CTSL, BSG, NRP1, FURIN, and TMPRSS2 expression (Table S11). Bronchial eQTMs were analyzed in an adult cohort (INDURAIN; n = 169). We identified 143 eQTMs for the different SCEF genes (Figure 2J, Table S12). The nasal eQTMs were influenced by age and sex, but not smoking (Table S13), whereas bronchial eQTMs for TMPRSS2 were associated with smoking and age (Table S14). ACE2 expression in bronchial biopsies was associated with 6 CpG sites, two of which were in the promoter region of the adjacent TMEM27 gene. ACE2 and TMEM27 expression was correlated (Figure 2K.L) and both associated with methylation of cg20473453 (Figure 2M), indicating possible co‐regulation of ACE2 and TMEM27.
In conclusion, although SCEF genes are more highly expressed in upper airways, first and secondhand smoke exposure only appears to influence the expression of these genes in the lower airways. CpG methylation, but not genetic variation, was associated with expression of several SCEF genes in bronchus and nose, which was associated with age, gender, and smoking. Finally, ICS decreases expression of ACE2 in bronchial biopsies. Together, these results indicate that the enhanced SCEF expression in the lower airways due to cigarette smoke exposure and the reduced expression in subjects taking ICS may underlie the increased susceptibility to COVID‐19 in smokers and the clinical efficacy of ICS.
Supporting information
Supplementary Material
Table S1‐S14
Appendix S1
Shared first author: Hananeh Aliee, Florian Massip, Cancan Qi, Maria Stella de Biase, Jos van Nijnatten, Elin T.G. Kersten, Nazanin Z. Kermani, Basil Khuder.
Shared senior author: Robert C Rintoul, Paul A. Reyfman, Fabian J. Theis, Corry‐Anke Brandsma, Ian M. Adcock, Wim Timens, Cheng‐Jian Xu, Maarten van den Berge, Roland F. Schwarz, Gerard H. Koppelman, M.C. Nawijn, Alen Faiz.
REFERENCES
- 1. Hou YJ, Okuda K, Edwards CE, et al. SARS‐CoV‐2 reverse genetics reveals a variable infection gradient in the respiratory tract. Cell. 2020;182(2):429‐446.e14. [DOI] [PMC free article] [PubMed] [Google Scholar]
- 2. Chen M, Shen W, Rowan NR, et al. Elevated ACE‐2 expression in the olfactory neuroepithelium: implications for anosmia and upper respiratory SARS‐CoV‐2 entry and replication. Eur Respir J. 2020;56(3):2001948. [DOI] [PMC free article] [PubMed] [Google Scholar]
- 3. Cai G, Bossé Y, Xiao F, et al. Tobacco smoking increases the lung gene expression of ACE2, the receptor of SARS‐CoV‐2. Am J Respir Crit Care Med. 2020;201(12):1557‐1559. [DOI] [PMC free article] [PubMed] [Google Scholar]
- 4. Muus C, Luecken MD, Eraslan G, et al. Single‐cell meta‐analysis of SARS‐CoV‐2 entry genes across tissues and demographics. Nat Med. 2021;27(3):546‐559. [DOI] [PMC free article] [PubMed] [Google Scholar]
- 5. Finney LJ, Glanville N, Farne H, et al. Inhaled corticosteroids downregulate the SARS‐CoV‐2 receptor ACE2 in COPD through suppression of type I interferon. Allergy Clin Immunol. 2021;147(2):510‐519. [DOI] [PMC free article] [PubMed] [Google Scholar]
- 6. Peters MC, Sajuthi S, Deford P, et al. COVID‐19 related genes in sputum cells in asthma: relationship to demographic features and corticosteroids. Am J Respir Crit Care Med. 2020;202(1):83‐90. [DOI] [PMC free article] [PubMed] [Google Scholar]
Associated Data
This section collects any data citations, data availability statements, or supplementary materials included in this article.
Supplementary Materials
Supplementary Material
Table S1‐S14
Appendix S1


