

Abstract
COVID‐19 has caused the global pandemic and had a serious impact on people's daily lives. The respiratory droplets produced from coughing and talking of an infected patient were possible transmission routes of coronavirus between people. To avoid the infection, the US Centers for Disease Control and Prevention (CDC) advised to wear face masks while maintaining a social distancing of 2 m. Can the social distancing be reduced if people wear masks? To answer this question, we measured the mass of inhaled droplets by a susceptible manikin wearing a mask with different social distances, which was produced by coughing and talking of an index “patient” (human subject) also wearing a mask. We also used the computational fluid dynamics (CFD) technology with a porous media model and particle dispersion model to simulate the transmission of droplets from the patient to the susceptible person with surgical and N95 masks. We compared the CFD results with the measured velocity in the environmental chamber and found that the social distancing could be reduced to 0.5 m when people wearing face masks. In this case, the mass concentration of inhaled particles was less than two people without wearing masks and with a social distancing of 2 m. Hence, when the social distancing was difficult, wearing masks could protect people. We also found that the leakage between the face mask and the human face played an important role in the exhaled airflow pattern and particle dispersion. The verified numerical model can be used for more scenarios with different indoor environments and HVAC systems. The results of this study would make business profitable with reduced social distancing in transportation, education, and entertainment industries, which was beneficial for the reopening of the economy.
Keywords: computational fluid dynamics, chamber test, N95 mask, particle mass concentration, porous media model, surgical mask
Practical Implications.
This is the first research to study the relationship between mass of inhaled droplets and social distancing for people wearing face masks based on scientific measurements and simulations.
By comparing the measured mass concentration of inhaled particles, the social distancing could be reduced to 0.5 m when wearing face masks without increasing the inhaled mass concentration.
According to the measurements and simulations, the velocity of exhaled air in front of the “patient” when coughing and wearing face masks was less than 0.4 m/s.
The leakage between the face mask and human face played a crucial role in the exhaled airflow pattern and particle dispersion.
1. INTRODUCTION
COVID‐19 has caused the global pandemic and had a serious impact on people's daily lives. 1 It is very necessary to control the spread of the coronavirus and reduce the risk of infection. The respiratory droplets produced from coughing and talking of an infected patient were possible transmission routes of SARS‐CoV‐2 between people. 2 , 3 Dry cough was one of the typical symptoms of COVID‐19 for nearly 70% of infected people. 4 The respiratory droplets carrying virus could fall on the mouth and nose area and be inhaled by a susceptible person in the proximity of an infected person. Therefore, World Health Organization (WHO) 5 and US Centers for Disease Control and Prevention (CDC) 6 advised to maintain social distancing of 2 m/6 ft and to wear face masks.
The social distancing rule was identified a long time ago. 7 The current rule assumed that the dominant routes of transmission of SARS‐CoV‐2 were via respiratory droplets inhaled and falling on surfaces. 7 , 8 Large droplets might fall on the ground quickly, while very small droplets could travel a much longer distance in the air. 9 , 10 Thus, particle size was an important factor in aerosolized transmission. 11 Li et al. 15 measured the concentration of respiratory particles in various horizontal distances and found that the concentration decreased with the distance. However, some studies pointed out that 2 m distancing may not be sufficient, especially when people sneezed with a high‐speed jet 12 and the airborne transmission of SARS‐CoV‐2, 13 , 14 which was defined as droplet nuclei or aerosols that remained infectious when suspended in the air over long distance and time. Therefore, it is urgent to scientifically study the social distancing. 16 The social distancing should also be related to many other factors, such as occupancy level and sound level of speaking or even shouting. 17 Although WHO 4 shows that the symptoms of COVID‐19 did not include sneezing, but there were many asymptomatic infected people who may sneeze to spread the virus. Moreover, 2 m social distancing was very difficult in many places, such as in public transportation vehicles, elevators, classrooms, theaters, and sport stadiums. 18 The social distancing rules in such places have reduced the economic benefits significantly, and the success in reopening economy depends on reducing the social distancing. Recently, van den Berg et al. 19 did a statistical study and pointed out that the risk of infection between 3 versus 6 ft social distancing had no difference among primary and secondary school students wearing masks.
On the contrary, wearing a face mask could reduce the concentration of inhaled particles and limit the risk of infections of respiratory diseases. 20 However, the filtration efficiency varied greatly for different types of face masks. For example, N95 respirator meeting the US National Institute for Occupational Safety and Health (NIOSH) classification of air filtration had an efficiency of at least 95%. 21 , 22 Surgical mask was a loose‐fitting and disposable device made of three‐layer non‐woven fabric. 23 It could block large droplets and adsorb very fine particles, but it may not capture some small particles whose diameter ranged between 0.01~5 μm in the air. Previous studies 22 , 24 , 25 , 26 , 27 , 28 found that the surgical masks and N95 masks could reduce the penetration of exhaled droplet when coughing and talking by 50% and over 90%, respectively. Pan et al. 29 compared the efficiency of surgical mask and mouth coverings for exhalation and inhalation. The results showed that outward efficiency was higher than inward efficiency, but lower than material filtration efficiency. As some previous tests measured the filtration efficiency for the surface material by only comparing the concentration on both sides while not on the head, thus the leakage and fit were not considered. So that the material efficiency cannot represent the actual efficiency of protection level. As for cloth masks, they were usually made of one layer of cotton with the overall capture efficiency around 20%, which was lower than the surgical masks. 25 , 30 In addition to the filtration efficiency, the fit of face mask was also very important. 31 It was found that the efficiency of non‐fitting masks was extremely low. 21 , 32 Some studies tested double‐layer masks 33 to improve the efficiency of face masks.
If wearing a face mask supplemented with social distancing, it could greatly reduce the spread of droplets. For instance, Hui 34 and Leung 37 found that cough propagation distances can be greatly reduced with various masks. Chen et al. 35 found that simple mouth covering could reduce the distance of droplet transmission between two people. Chen 36 measured the number of cough droplets deposited on mouth, eye, and nose area, and found that the number reduced very much as horizontal distance increased. Li et al. 38 measured the size distribution of airborne particles generated by coughing indoors and various distancing when wearing masks and face shield. Bandiera et al. 39 measured the number of droplets in flight and landed on table height at up to 2 m. It was found that wearing a face covering decreased the number of projected droplets by 1000 times. These studies implied that the social distancing can be reduced if people wear masks. The question is what a suitable social distancing should be for people wearing face masks. Would mass concentration of inhaled particles increase when people wear face masks but reduce the social distancing?
These questions have not been answered according to our literature search. Currently, variants of COVID‐19 are still spreading worldwide, and the effectiveness of vaccines may be reduced due to the variants. The American may need to wear masks by 2022 40 or even seasonally after the pandemic. 41 SARS‐CoV‐2 could coexist with us in the foreseeable future. In order to keep the economy open, wearing masks to reduce the social distancing is needed. The aim of this investigation is to provide guidance on reducing social distancing without increasing the risk of infection of COVID‐19 and other respiratory diseases.
2. METHODS
To determine the suitable social distancing when people wear face masks, this study first reviewed the existing research methods, including visualizations, experimental measurements, and numerical simulations. Subsequently, we measured the size distribution of inhaled droplets when facing an infected “patient” coughing/talking and wearing different kinds of face masks in various distancing in an environmental chamber. We also built CFD models to simulate the particle dispersion and airflow. Finally, the numeral models were validated by the measured data so that we confirmed the suitable social distancing for people wearing face masks.
2.1. Review of existing research methods
To study social distancing and efficiency of mask, the key is respiratory airflow. Many visualizations 42 , 43 , 44 , 45 , 46 , 47 showed that the respiratory airflow was very complex when wearing face masks. In more detail, mask worn by infected people could limit the coughing jet speed through the material, so that the jet and exhaled particles could not travel very far with the reduced momentum. 42 Mask material could filter the exhaled droplets, so the concentration was not as high as those without a mask. 39 , 48 However, it was also worth noting that there were still leakages at the nose, ear side, and under the chin when wearing a face mask. 45 For instance, N95 masks were equipped with a tighter rope and steel nose clip to make it fit to face as much as possible. Thus, the flow through leakages was limited, 42 , 45 but some N95 masks were equipped with breathing valves through which air could flow out easily. 49 As for the surgical mask, it was only equipped with a soft nose clip. However, many people did not clamp it close to the nose, and some people even did not cover their noses by the surgical mask. The results of visualization 45 showed that part of the air flowed out through the leakages, which greatly reduced the filtration efficiency of the surgical mask. The high‐quality simulations by Tsubokura 50 showed that airflow direction changed to upward, downward, and sideway through the leakages between surgical mask and human face. The analytical model developed by Xu et al. 51 showed that the filtration efficiency was only 40%–60% of that without leakages when the ratio between leakage area to mask area was 0.05. At last, cloth mask was soft without any structure to maintain the shape. Although the cloth mask could fit to the human face well, the leakage at the nose was even greater without the metal clip. Thus, the visualizations showed that the complex respiratory airflow and particle dispersion were caused by the irregular shape of face masks and the leakage.
The previous visualizations have shown the complex airflow pattern when coughing and wearing face masks, but most results were qualitative. In order to obtain quantitative and detailed results of airflow and particle motion, numerical simulation was a powerful tool. Although it was very challenging to simulate the exhaled airflow with the use of a mask model, there were some recent successful CFD studies. For example, Feng et al. 52 analyzed the influence of wind and relative humidity on the travel distancing of droplets with a mask model. They found that six feet social distancing policy may not be sufficient in conditions of ambient wind and high relative humidity. Hui et al. 34 measured and simulated the dispersion of exhaled air by smoke when wearing a surgical mask or N95 mask for a lying patient. Dbouk et al. 53 used Eulerian‐Lagrangian framework to simulate the cough droplets with a complex surgical mask geometry model with leakages. Pendar and Páscoa 54 used CFD and a face mask model to simulate the impact of mouth opening area and injection angle on particle dispersion when sneezing. They found that wearing a face mask during a sneeze could reduce the contamination area to one‐third. Moreover, Khosronejad et al. 55 found that the airflow through the leakage between mask and face could transport very fast over large distances. The CFD simulation could provide many detailed results, including velocity distribution and particle dispersion. It could also be used to analyze many complex indoor spaces when it was very difficult to do measurements. However, the numerical simulation used many assumptions and approximations, especially for the filtration efficiency of masks and behaviors of droplets. Some of the studies did not rigorously validate the air velocity and particle concentration in simulations. Although conducting experiments was expensive and time‐consuming, it is essential to obtain data for validating CFD results. The validated CFD model can be used to study more complex scenarios.
2.2. Experiment in an environmental chamber
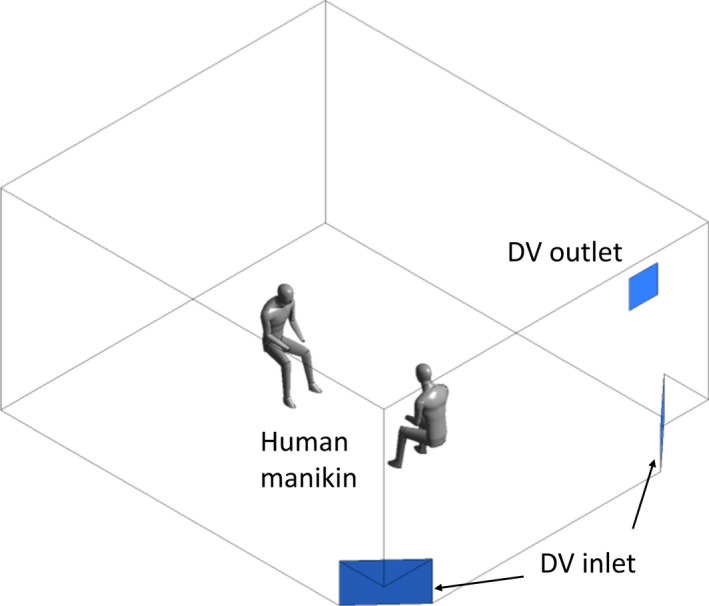
In order to measure exhaled air velocity and size distribution of inhaled droplets, this investigation recruited eight healthy people as the “index patients.” Each patient sat on a chair in an empty, ventilated environmental chamber with a size of 6 m (W) ×5 m (L) ×3 m (H) as shown in Figure 1. The chamber was ventilated by a displacement ventilation (DV) system under a near isothermal condition with 100% outdoor air and no recirculation. There were MERV7 filters with 70% efficiency in the air handling unit to remove the particle concentration in the supply air. The ventilation created a minimum flow in the chamber but provided adequate ventilation for the human subject. Before and after each test to be described below, the chamber was disinfected by a UV lamp and ventilated to have minimal amount of particles in the air.
FIGURE 1.
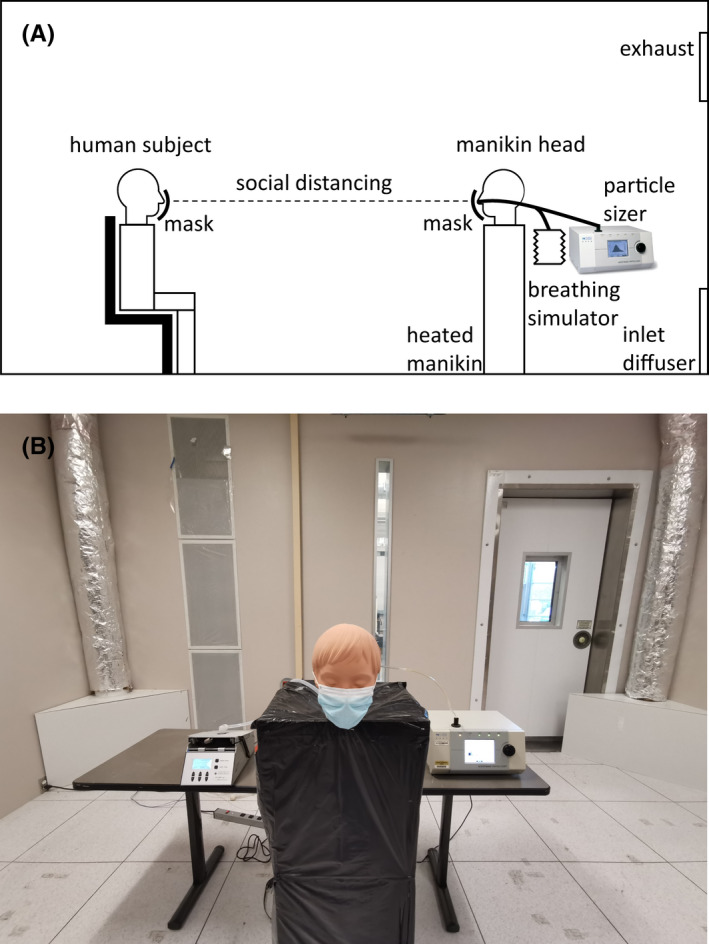
(A) Illustration of measuring size distribution of inhaled droplets when wearing face masks in various social distancing in the environmental chamber. (B) Photograph of the measurement devices in the environmental chamber
Figure 1 shows that the susceptible person was a manikin with a human‐shaped head sitting face‐to‐face with the “patient.” The nose of the manikin head was connected to a breathing simulator pump that could simulate human breathing process of both inhalation and exhalation. We used the “eupnea” mode for the breathing simulator, which represented normal, unlabored, and quiet breathing. The breathing rate was set to be 12 breaths per minute so that the breathing cycle was 5 s. The breathing volume of each cycle was 500 ml. A TSI 3321 aerodynamic particle sizer was connected to the inhaled flow from the respiratory tract of manikin head to measure the size distribution of inhaled particles, as shown in Figure 1B. The TSI 3321 aerodynamic particle sizer provided high‐resolution, real‐time aerodynamic measurements of particles ranged from 0.5 to 20 μm with 10% variation of reading. The head of the manikin was placed on a heated body‐sized box to represent the impact of thermal plume of human body on the airflow. This investigation used a social distancing of 2 m between the “infected patient” and susceptible manikin without wearing face masks as a reference, as WHO 5 advised.
This research studied three different masks, surgical masks, N95 masks, and cloth masks. Although CDC also recommended face covering by the cloth mask for public, the filtration efficiency was very low. Hence, this study mostly focused on surgical masks and N95 masks. When an infected patient wore face masks, the face mask material could change the direction of exhaled airflow and filter part of the exhaled droplets. Similarly, it could also reduce the inhaled droplets when susceptible occupant wore face masks. For each test, the index patient and the susceptible manikin wore a new surgical, N95, or cloth mask. Each “patient” coughed five times for coughing cases and read the rainbow passage for 30 s in 60–70 dB 56 for talking cases. The rainbow passage contained a mixture of oral and nasal consonants in the approximate proportion found in everyday speech. 57 Hence, it provided a reflection of the possible combination of flow rates that can be found in a conversation. The expiratory droplets were volatile and could evaporate in the room air quickly. 58 The expiratory droplets consisted of liquid and solid matter. The liquid matter was volatile and was around 90% of the total volume of the droplets. 59 The droplets could evaporate within a second 58 to its non‐volatile content (particles) for respiratory droplets. Thus, what we measured was particles rather than droplets.
Table 1 shows the measurement cases of coughing and talking for each human subject. Case 0 was a reference case. Comparison of inhaled droplets between cases 0 and 1 could reveal the reduced risk of infections due to the social distancing. Comparison between case 0 and cases 2 to 4 could find the reduced risks when an infected patient wore masks. Similarly, comparison between case 0 and cases 5 or 6 could identify the reduced risks when a susceptible occupant wore masks. Since the measurements were also for different particle diameters, the filtration efficiency would be a function of the particle size.
TABLE 1.
Measurement cases with various face masks and distancing
| Case | Infected patient | Susceptible occupant | Distance | Activity |
|---|---|---|---|---|
| 0 | No mask | No mask | 0.5 m | Cough/Talk |
| 1 | No mask | No mask | 2.0 m | |
| 2 | Surgical mask | No mask | 0.5 m | |
| 3 | N95 mask | No mask | 0.5 m | |
| 4 | Cloth mask | No mask | 0.5 m | |
| 5 | No mask | Surgical mask | 0.5 m | |
| 6 | No mask | N95 mask | 0.5 m |
When both the patient and susceptible occupant wore face masks, the inhaled droplets from respiratory tract by susceptible occupant were filtered twice after exhaled by the patient. Such double filtering could be safer than only one person wearing a face mask, so that the social distancing could be further reduced. But considering that some people's masks did not fit face and nose well, nor some people did not cover their noses when wearing masks, we did the measurements for only one person wearing mask to find out the suitable social distancing. The situations that both patient and susceptible persons wearing face masks could be simulated by a validated CFD model but the resulting distancing should be shorter.
Each measurement took about two hours for preparing the chamber, adjusting the distancing, measuring, recording the data, and cleaning the air. The detailed procedures were as follows:
First, we activated the ventilation system for 30 minutes with 100% outdoor air to minimize the impact of existing indoor particle concentration on measured results.
Then, one human subject entered the chamber and rested for 5 minutes.
Performed experiment for one case as Table 1 shows.
Waited for 5 minutes for measuring the size distribution of inhaled droplets.
Repeated steps (3) and (4) for various cases in Table 1.
Completed all measurements and ventilated the room for additional 30 minutes to ensure that all exhaled air was exhausted.
Additionally, we also measured the air velocity in front of the face masks when “infected patient” coughing with the use of hot sphere anemometer HT‐400 manufactured by Sensor Electronic. The hot sphere anemometer could measure the air velocity magnitude ranged from 0 to 5.5 m/s, and the repeatability was 0.02 m/s. Figure 2. shows how the air velocity in various horizontal distancing in the environmental chamber were measured.
FIGURE 2.
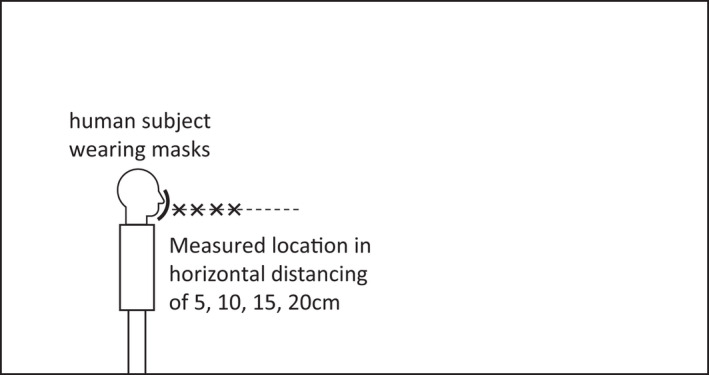
Illustration of measuring air velocity in front of face masks when coughing
2.3. Computational fluid dynamics simulation
The measurements in Section 2.2 provided concrete data on the impact of face masks on inhaled particles by the susceptible person with different social distancing. However, the data obtained were limited. The experiments were not easy to be extended to more complicated situations, such as with multiple people indoors and different ventilation systems. Therefore, this investigation also used CFD simulations.
To simulate the cough airflow with face masks by CFD, we built geometry models of masks according to actual shapes and sizes. We first drew the control curves based on the actual edge of the surgical mask and added some curves in the middle. Then, we used the “lofting” and “deform” function in Solidworks to generate the complex shape of the surgical mask as shown in Figure 3. The N95 mask model was 3 M 1860, which was widely used in the United States. 21 , 22 The type of mask shape was cup, and it did not deform very much during use. 27 We also found that the middle layer of the N95 mask was thicker than that of the surgical mask. After building the geometry model of face masks, we matched them with a geometry model of human head. The mask models were put as close to the human head as possible, and the leakages in between were less than 2 mm. We neglected the rope of the masks around the human head in the numerical models.
FIGURE 3.
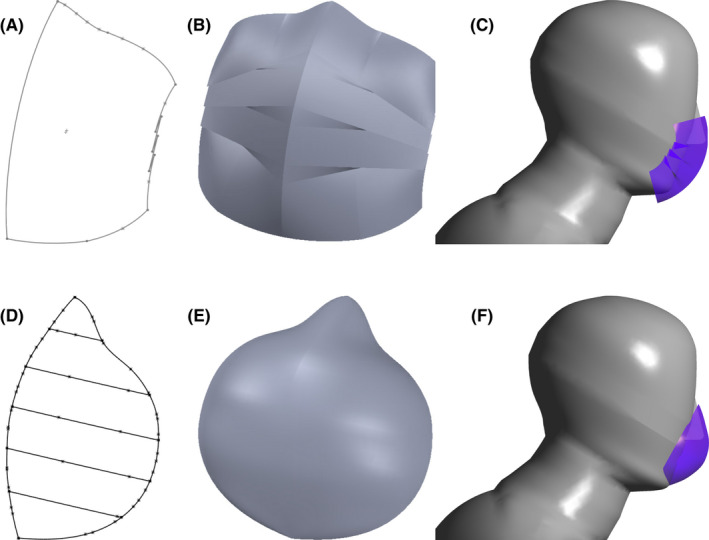
Development of the geometric model for surgical and N95 masks: (A) Control curves for half of the surgical mask model, (B) Geometry model of the surgical mask, (C) Surgical mask matched with human head, (D) Control curves for a half of the N95 mask model, (E) Geometry model of the N95 mask, and (F) N95 mask matched with human head
As for the boundary conditions of exhaled and inhaled air, Figure 4 shows the flow rate for coughing and breathing. The flow rate was calculated by the measurements and equations in a previous study, 60 which was based on an average male with height of 1.75 m and weight of 70 kg. Similarly, we also calculated the average mouth/nose opening area and flow direction of coughing and breathing from previous literature 60 , 61 for the boundary conditions. The opening area of nose for breathing and mouth for coughing were 0.71 cm2 and 4 cm2, respectively. We set the exhaled air temperature and relative humidity according to literature. 62 Table 2 also shows the exhaled air was warm at 33℃ and humid at 85%.
FIGURE 4.
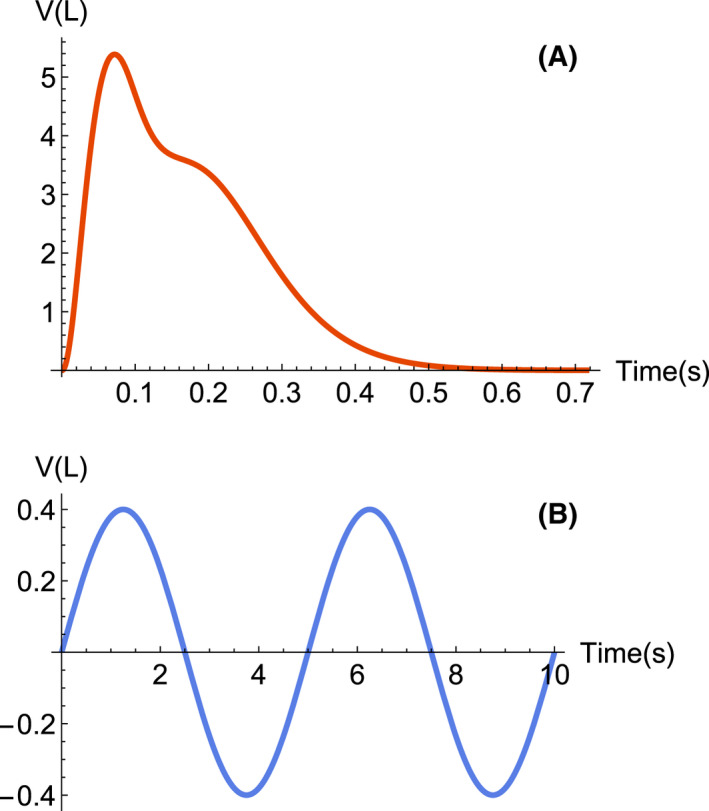
Volume flow rate of exhaled and inhaled air for (A) coughing and (B) breathing
TABLE 2.
Boundary condition settings for computational fluid dynamics simulation
| Boundaries | Setting | Velocity | Temperature | Species | Particle |
|---|---|---|---|---|---|
| Air supply | Velocity inlet | V = 0.01 m/s | T=22℃ |
H2O=0.003 O2=0.23 |
Reflect |
| Exhaust outlet | Pressure outlet | P = 0pa | Zero flux | Zero flux | Escape |
| Wall | Non‐slip wall | V = 0 | Adiabatic | Zero flux | Trap |
| Body | Non‐slip wall | V = 0 | T = 31°C | Zero flux | Trap |
|
Mouth /nose |
Mass flow inlet | Profiles in Figure 4 | T = 33°C |
H2O = 0.026 O2 = 0.23 |
Escape |
Table 2 lists the other detailed boundary conditions in the CFD simulation. The relative humidity of supply air was 25%. We used Boussinesq assumption to simulate the buoyancy effect in the air. We built the geometry model of sitting manikin in the environmental chamber the same as that in the experiments in Section 2.2 as shown in Figure 5.
FIGURE 5.
Geometry model of the environmental chamber for computational fluid dynamics simulation
We used a porous media model to simulate the surface of face masks. This model can be used for various CFD simulations with pressure drop/loss, including flow through filters and perforated plates by using an additional momentum source term:
| (1) |
where Si was the momentum source term, μ the dynamic viscosity of air, α the permeability, vi the velocity component, ρ the density of air, and C 2 a pressure‐jump coefficient.
There were two parts in the momentum source term of Eq (1). The first was the main part for viscous loss term, and it followed Darcy's law. The other was an inertial loss term. The pressure drop can be obtained from the source term as
| (2) |
where Δm is the thickness of the mask surface. This study used 0.5 mm for the surgical mask and 2 mm for the N95 mask.
Figure 6 shows the data from studies 30 , 63 of the filtration efficiency of face masks for particles of different diameters. The material for three kinds of face masks could filter all the particles larger than 20 μm. The N95 mask could filter the particles larger than 0.5 μm and smaller than 0.01 μm with nearly 100% efficiency, and over 95% efficiency from 0.01 to 0.5 μm. The efficiency of the surgical mask exceeded 75% for particles smaller than 2 μm. The cloth mask was least efficient. We used this information for the CFD simulations.
FIGURE 6.
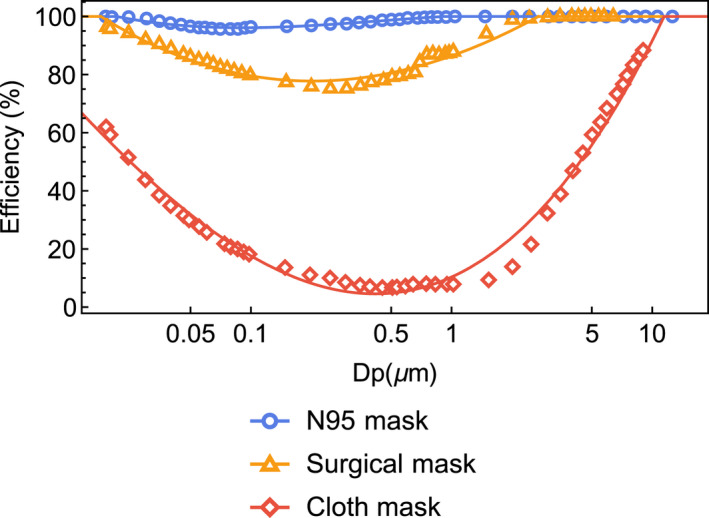
The filtration efficiency of N95 mask, surgical mask, and cloth mask for particles with diameter ranged from 0 to 20 μm
This study used the Lagrangian method 64 to directly track the motion of individual particle in our CFD simulations. The Lagrangian method determined the particle motion according to Newton's law. The turbulent dispersion of particles, which was associated with instantaneous flow fluctuations, was one of the main mechanisms of particle deposition. We set the type of particle as droplet with volatile component fraction of 90%. This study used the discrete random walk model. 65 The model simulated the interaction of a particle with a succession of discrete stylized fluid‐phase turbulent eddies. In the CFD simulations, we released the droplets from mouth and nose to simulate the human coughing and breathing, respectively. Figure 7 shows the size distribution of cough droplets as measured in previous studies. 66 , 67 The size distribution of exhaled cough droplets varied a lot with very large uncertainties over 50% in different studies. 68 Compared with the droplets produced when coughing, breathing only produced a very small number of droplets smaller than 5 μm. 69
FIGURE 7.
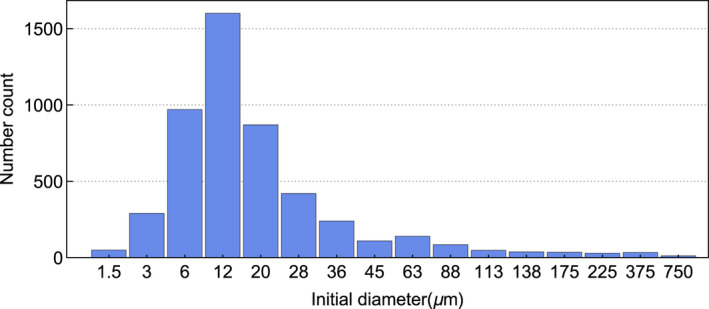
Size distribution of exhaled droplets in one cough 66
The numerical grid number for the environmental chamber used three different sets at 3 million, 5 million, and 7 million, respectively. Through the grid‐independent study, we found that the 5 million of total cell number could lead to a grid‐independent solution, so we used this set of grid. The size of grid on human body was 0.01 m and on the mouth/nose/mask was 0.002 m. We refined the grid at the region around mask and breathing zone with 0.005 m and around human body with 0.05 m. The size of grid on other indoor space was 0.1 m.
This investigation used transient simulation and RNG k‐ε model to predict airflow in the environmental chamber with the infected “patient” and the susceptible manikin. The RNG k‐ε model calculated turbulence kinetic energy (k) and its dissipation rate (ε) by two more independent transport equations. The model was isotropic but very stable, and it was shown to be the most suitable model for indoor airflow with acceptable computing costs. 70 There were inflations for the boundary layer on human head and body. y+ on the wall was about 1. We used a time step of 0.02 s since we found it produced the same results as 0.001 s. The CFD simulations were performed with ANSYS Fluent 2020R3 on a computational cluster node with 24 cores.
3. RESULTS
This section shows the results of the measurements and CFD simulations. By comparing the mass concentration of inhaled droplets in various distancing, we could determine the suitable social distancing for people wearing face masks and without increasing the risk of infections of respiratory diseases. Then, we further analyzed the results of CFD simulations of air velocity, airflow pattern, and particle dispersion, which were difficult to measure in the experiments.
3.1. Measured and simulated results of inhaled particles
Figure 8 shows the measured and simulated size distribution of particles inhaled by a susceptible occupant that accumulated in 1 minute after the infected “patient” coughed/talked. The figure compares the results of various cases listed in Table 1. The box‐whisker chart shows the upper and lower bound, first and third quantile, and median of measurements from different human subjects, respectively. Due to the social distancing rule and wearing face masks, the number concentration of inhaled particles was much smaller than the exhaled concentration in Figure 7. Note that we have excluded the particles from the supply air and released from human body and clothes as a background concentration in the result analysis. When the infected “patient” coughed without wearing face masks but maintaining the social distancing of 2 m in case 1, the median of total number of inhaled particles for each diameter was less than 70. The measurements also showed that the number of inhaled particles was concentrated in a very small size around 0.5 μm. A comparison between case 0 and 1 showed that the current social distancing of 2 m was useful for reducing the inhaled concentration and the risk of infection. When the social distancing was reduced to 0.5 m, even if the infected “patient” wore surgical, N95, and cloth masks, the number of inhaled particles in cases 2 to 4 was still less than that of case 1. These results indicated that face mask could be a compensation when 2 m social distancing could not be met. However, the uncertainty of measurements among different occupants was very large. For each particle size, the measured maximum value could be twice or three times of the median value. We also found that the largest diameter of the inhaled particles was 3.7 μm for the cases without wearing face masks. But after wearing masks, the inhalation of particles with diameter larger than 1 μm reduced a lot, especially in the cases of talking.
FIGURE 8.
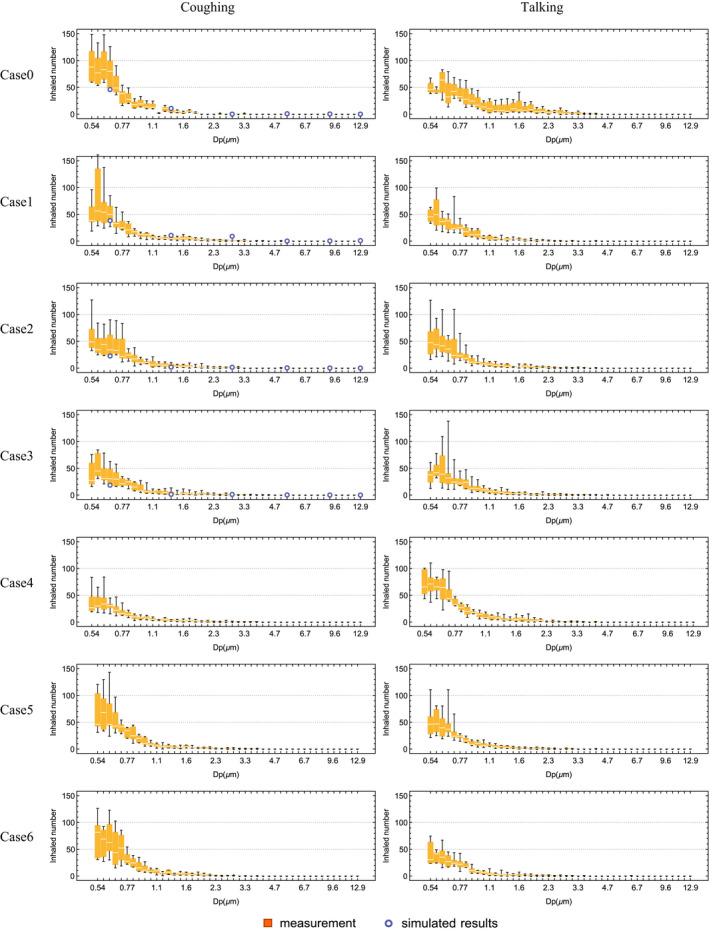
Measured and simulated size distribution of particles inhaled by the susceptible occupant that accumulated in 1 minute after the infected “patient” coughing/talking for the cases listed in Table 1
When the susceptible occupant wearing a surgical mask or N95 mask in cases 5 and 6, the number of inhaled particles also reduced compared with that in case 1. However, the values were higher than cases 2 to 4 when infected “patient” wearing masks. Such measured results showed that the infected “patient” wearing masks was more useful than the susceptible person. This was the same as the general habit of the public that sick people with symptom like coughing should wear face masks to avoid infecting others. The masks worn by infected “patient” could not only filter the exhaled droplets, but also prevent the high‐speed coughing jet. In this way, the exhaled particles could not travel very far. The results of wearing face masks for the cases of talking were similar. We also compared the measured data with the CFD simulations in Figure 8. The simulated results were lower than the measured results for small diameter, as shown by the dots in cases 0 to 3. The reason could be that we did not consider the broken up of respiratory particles after exhalation and hitting face mask in the CFD simulations. 53 , 75 Another possible reason for the discrepancy was the sampling losses inside the nasal cavity and on the inner wall of the connecting tube, as we did not model the complex geometry in the simulations. In the CFD simulation, we only used one set of weight and height to calculate the exhaled flow rate as the boundary value without considering the individual differences in the measurements. We also simplified the mouth structure without considering the area variation; thus, the simulated exhaled air velocity may be different from the actual velocity. What is more, talking cases with masks were not simulated because the measured flow rate of reading rainbow passage showed very unsteady values ranged from 0 to 2 L/s 61 and mouth opening area varied greatly during talking. Thus, it was very hard to validate the talking cases when wearing masks.
After analyzing the measured and simulated size distribution of particles inhaled by the susceptible occupant, we calculated the mass concentration with and without wearing face masks. The inhaled mass concentration was one important parameter related to the risks of infection. Figure 9 shows the measured mass concentration of inhaled particles by the susceptible occupant within 1 minute after infected “patient” coughed and talked. It was calculated by using the following equation,
| (3) |
where DP is the particle diameter, ρ the density of particles, and N the measured size distribution in different diameters in Figure 8.
FIGURE 9.
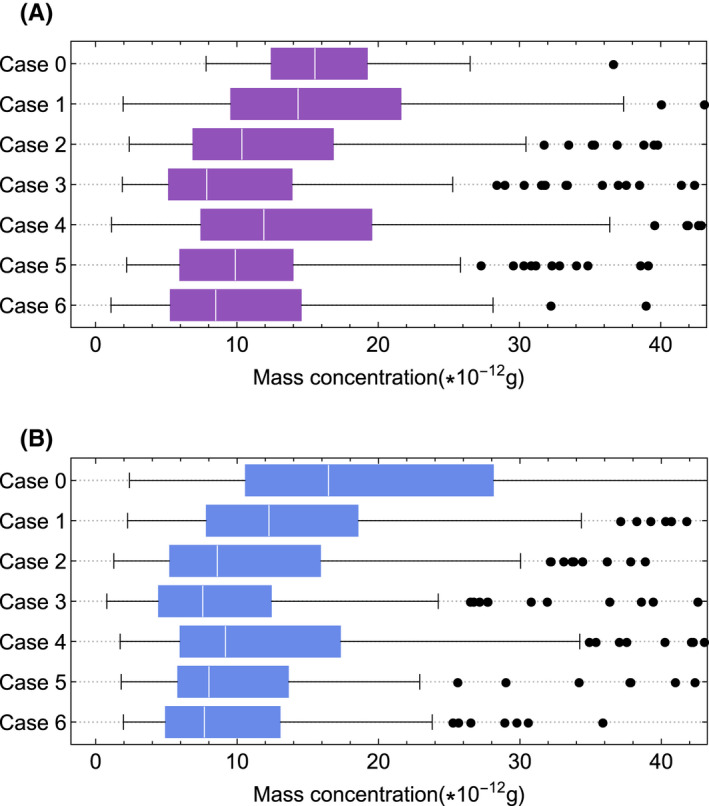
Measured mass concentration of particles inhaled by a susceptible person within 1 minute for different cases after infected “patient” (A) coughing and (B) talking
Figure 9 shows that when wearing a face mask and maintaining a reduced social distancing of 0.5 m in cases 2 to 6, the median mass concentration of inhaled particles was lower than that in case 1, which was the current social distancing rule of 2 m and without wearing face masks. In details, the median mass concentration of cases 2 and 3 when wearing surgical mask and N95 mask was a little more than half of the concentration in case 1. Although the results of wearing cloth mask in case 4 were not as good as wearing surgical and N95 mask, it was still better than only with the 2 m social distancing rule. As for cases 5 and 6 when suspectable occupant wearing masks, the results showed a little difference between surgical mask and N95 mask. The reason could be that part of the inhaled particles by suspectable person were through the leakages between mask and the person's face. The analysis of all the cases concluded that the social distancing could be reduced to 0.5 m if people wearing face masks. In these cases, the corresponding risk of infection did not increase compared to current social distancing rule of 2 m without masks. However, there were very large uncertainties in the measured mass concentration, as shown by the whiskers and dots. The reason was that inhalation of one large diameter particle dominated the entire mass concentration. In short, the average mass of inhaled droplets for 0.5 m social distancing when wearing face masks was lower than 2 m social distancing without masks.
3.2. Comparison of respiratory air velocity when wearing face masks
After analyzing the size distribution and mass concentration of inhaled particles, we found that wearing face masks was very effective in reducing the inhalation of respiratory particles and the risk of infection. In order to understand the mechanism, we further analyzed the airflow when wearing face masks. Figure 10 shows the measured air velocity at various horizontal distances in front of the infected “patient.” The “patient” wore surgical masks, N95 masks, cloth masks, or no mask. When coughing without wearing a mask, the air velocity decayed from 5 m/s to 1 m/s along the horizontal distance from 5 to 20 cm. The peak velocity of coughing jet could exceed 10 m/s when leaving the mouth. 60 Figure 10 shows the high uncertainty of measurements since coughing was a transient process in less than 1 s. 60 The reason was that the individual differences among the subjects were great for exhaled air flow rate and mouth opening area. 60
FIGURE 10.
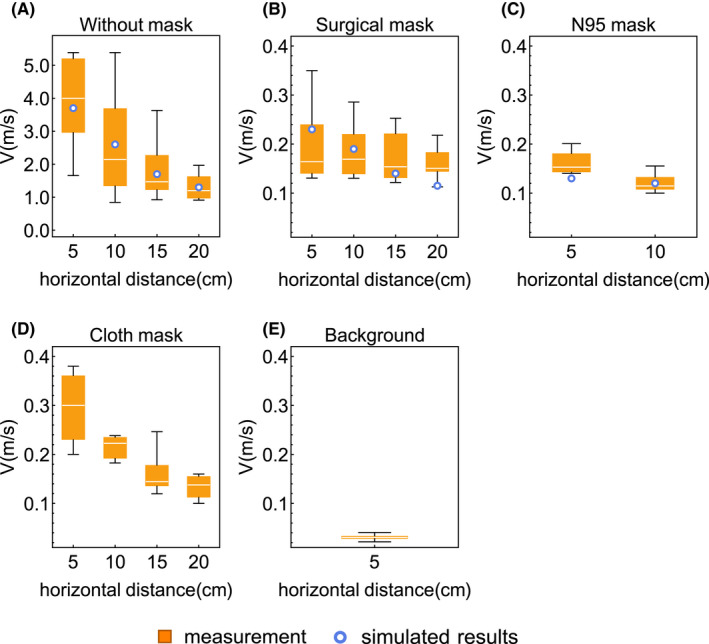
Measured and simulated respiratory air velocity along the horizontal distances when coughing (A) without face mask; (B) with surgical mask; (C) with N95 mask; and (D) with cloth mask as well as (E) background air velocity without respiratory activity
Figure 10 also shows that when an infected “patient” coughed with the surgical mask, the exhaled air velocity was significantly reduced to 0.15 – 0.35 m/s, which demonstrated the significant resistance of the three‐layer non‐woven fabric material. The visualizations from the literature showed the similar flow pattern of reduced speed. 42 , 48 For the N95 mask with thicker material and better fit, the air speed in front of the “patient” was further reduced. Thus, it was very difficult for the exhaled air and droplets to move forward after passing through the N95 mask. However, the air velocity was a little high for the cloth mask since it was typically made of a single layer of cotton. The background air velocity was less than negligible, which meant the uncertainties of measurements due to ventilation and thermal plumes were limited.
This study also compared the CFD simulated results with the measured data. The CFD results were plotted as small circles in Figure 10. The simulated air velocities at various horizontal positions were within the measured range. Therefore, the CFD results were reliable. Then, we could use CFD to quantitatively analyze the respiratory flow pattern and particle dispersion with face masks, which was very difficult to measure in the experiments.
3.3. CFD simulation results of respiratory airflow pattern and particle dispersion with face masks
Figure 11 shows the simulated air velocity distribution within 2 seconds after the infected “patient” coughed while wearing the surgical mask and the N95 mask. The highest air speed occurred at 0.4 s, as the peak of coughing flow rate from the mouth shown in Figure 4A. The figures show that most of the exhaled air flowed through the leakages at the top and bottom with relative high speed when the “patient” wore a surgical mask. The velocity magnitude through the mask material was much smaller than the velocity through the leakages. As a result, it can be concluded that the face mask mainly changed the direction of exhaled airflow. The leakages between the mask and human face played an important role in the airflow pattern. Figure 11B shows the simulated airflow pattern with the N95 mask. N95 mask prevented the coughing ejection very well, and only a small amount of exhaled warm air moved upward after penetrating the mask. Similarly, part of exhaled air flowed through the leakage at the top with a higher speed. Such simulated airflow patterns were very similar to several previous visualizations. 45 , 46 , 50 Thus, the exhaled particles could not move far away in front of the infected “patient” when wearing masks. Hence, it explained the less inhalation by the susceptible occupant in Section 3.1, and the social distancing could be reduced for people wearing face masks.
FIGURE 11.
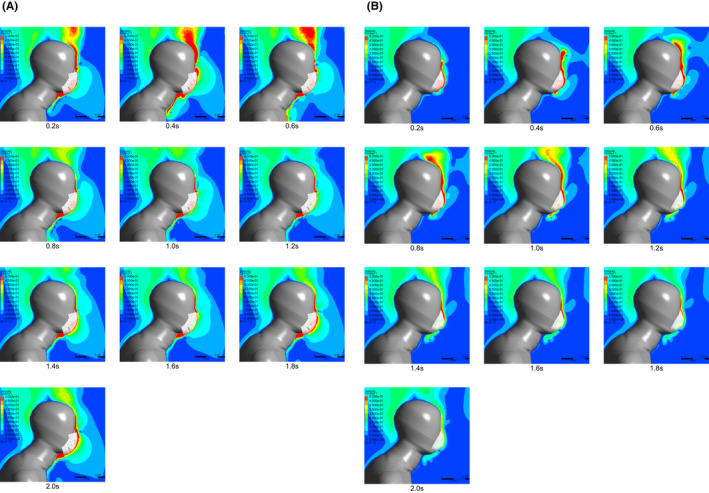
Computational fluid dynamics simulated air velocity distribution within 2 s when infected “patient” coughing while wearing (a) surgical mask and (b) N95 mask
Figure 12 shows the simulated trajectory of cough droplets when the infected “patient” wore surgical mask and N95 mask. It was worth noting that the number of trajectories of exhaled particles was reduced proportionally for clear display. The droplets coming out of the human mouth evaporated quickly in less than 0.1 s, and the rest was droplet nuclei. The figures show that most of the particles moved following the exhaled air through the leakages rather than through the face masks surface. The particles passing through the top, bottom, and side leakages then moved upward, downward and to two sides, respectively. As a result, the trajectory of the particles was like a cross emitted from the surgical mask in the front view. The diameter of particles through leakage could be around 8 μm as aerosols. As for the rest, only a small number of particles could penetrate the surgical mask, then they still moved upward since the exhaled air was warm. Figure 12B shows the trajectory of cough droplets when wearing an N95 mask, the most of which moved upward and to two sides through the leakages. Hence, when facing an infected “patient” wearing face mask, the mass of inhaled droplets were less than other directions.
FIGURE 12.
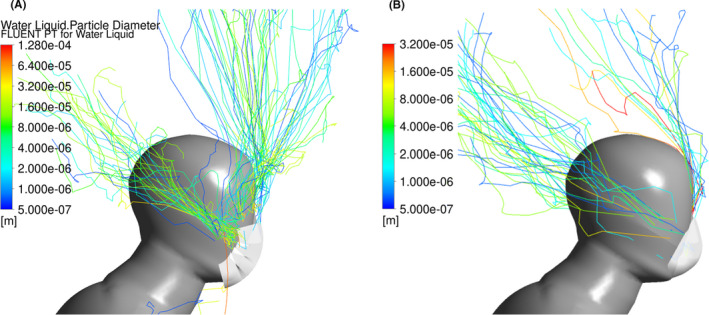
Simulated trajectory of exhaled particles when infected occupant coughing while wearing (a) surgical mask and (b) N95 mask by computational fluid dynamics
Figure 13 shows the statistical results of cough droplets in percentage when infected “patient” wearing surgical mask and N95 mask by CFD simulations. We found that a small portion of fine droplets smaller than 20 μm escaped from the leakage between surgical mask and human face. The percentage ranged from 10% to 20%. For penetration through mask material, it was far less than 10%. Most of the exhaled droplets were filtered out by the surgical mask material. As for wearing the N95 mask, the percentage of particle escaping from the leakage was similar with that of surgical mask. The percentage of penetration was neglected because N95 mask could filter out over 95% of particles less than 1 μm and all particles larger than 1 μm, as the curves shown in Figure 6.
FIGURE 13.
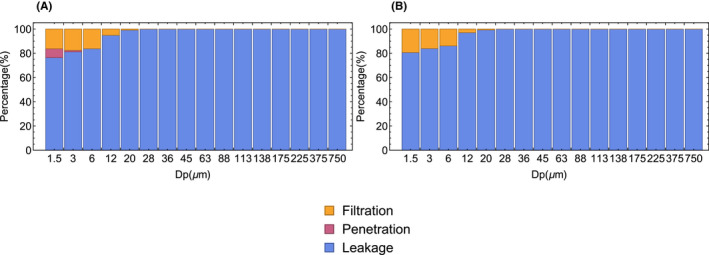
The percentage of exhaled particle filtered by face mask, penetrating the mask and moving through the leakage by computational fluid dynamics simulation for (A) surgical mask and (B) N95 mask
4. DISCUSSION
This is the first research to study the relationship between mass of inhaled droplets and social distancing for people wearing face masks based on scientific measurements and simulations. We recruited volunteers to take the measurements in the environmental chamber. We measured the size distribution and mass concentration of particles inhaled by the susceptible occupant. The breathing simulator could accurately simulate both inhalation and exhalation of the susceptible occupant in the experiments. To measure the size distribution of inhaled particles, we used the particle sizer TSI 3321 connected to the respiratory tract of manikin. However, sampling losses between the manikin and particle sizer may occur as inhaled particles deposited inside the nasal cavity of the manikin head and on the inner wall of the connecting tube between the manikin head and particle sizer. Moreover, in actual scenarios, the particles could be deposited in various locations of the respiratory system after inhalation, such as nasal cavity, throat, trachea, and bronchi. 71 The deposition location may be related to the airflow velocity and particle size. However, we did not build the complex geometry of the respiratory tract in the CFD simulation to analyze the deposition. The inhaled virus‐carrying droplets deposited in different locations may lead to various risks of infection for the susceptible occupant. This complex interaction is worth continuing to study. 47 Furthermore, we could only recruit healthy human subjects for the measurements according to the requirements of Institutional Review Board (IRB). But there was still a certain difference between infected “patients” and healthy people, especially for the respiratory activities. Finally, the time that a mask being used was also an uncertainty factor. After a period of use, the filtration efficiency was not as good as a new one, so the results may be different.
In this study, we compared the results of CFD simulations with the measured data and they matched well. So, the results of exhaled airflow distribution and particle dispersion when wearing face masks were reliable. We found that when wearing face masks, the airflow was extremely different from not wearing face masks. The air may flow through leakages and move upward, downward and to the side ways, similar to the previous visualizations. 45 , 50 As a result, when wearing face masks, maybe two people facing each other was not the most dangerous situation. The risk of infection at the location on the side and back of an infected person still remains to be investigated. For example, in the public transportation vehicles, movie theaters, and sports stadiums, there were people sitting on the sides and back of others. In the present study, the results were applicable for the environments without ventilation impact. We will study the impact of ventilation on exhaled airflow through face mask in the future. Although the leakage size between human face and mask influenced the exhaled particle movement and airflow, there was insufficient measurements and information for the leakage size in the literature. The size and shape of human head made the fit and leakage size vary greatly. In previous numerical simulations, the used leakage size varied greatly, such as 18 mm, 52 4–5 mm, 53 and 4–11 mm. 54 The leakage size needs to be measured for accurate modeling in the future.
Finally, we compared the mass concentration of inhaled particles with/without wearing face masks and in various social distancing. The face masks could significantly reduce the amount of exhalation and inhalation of respiratory viruses. 72 However, for SARS‐CoV‐2 and especially the different variants, the amount of virus carried by respiratory droplets varied widely. 73 , 74 The individual's health status and whether to take the vaccine also made it extremely difficult to assess of risk of infection. Systematic analysis requires cooperation among researchers from different disciplines.
5. CONCLUSION
This investigation used experimental and numerical methods to determine the suitable social distancing for people wearing surgical masks and N95 masks. This investigation led to the following conclusions:
By comparing the measured mass concentration of inhaled particles with the 2.0 m social distancing rule and wearing face masks, the social distancing could be reduced to 0.5 m without increasing the inhaled mass concentration. When the social distancing was difficult, wearing masks could help protect people.
The velocity of exhaled air when wearing face masks was less than 0.4 m/s in front of the “patient.” The mask material could reduce the momentum of cough jet so that the exhaled droplets could not travel far away. We simulated and validated the face masks by using porous media model in CFD simulations successfully.
When the infected “patient” wore face masks, the direction of exhaled airflow and particle dispersion were very different from those without wearing masks. The velocity of air through the leakages was very large. The leakage between the face mask and human face played a crucial role in the airflow pattern and particle dispersion.
CONFLICT OF INTEREST
The authors declare that they have no known competing financial interests or personal relationships that could have appeared to influence the work reported in this paper.
AUTHOR CONTRIBUTIONS
Zhipeng Deng involved in data curation, investigation, resources, methodology, software, validation, visualization, and writing‐original draft. Qingyan Chen involved in conceptualization, project administration, supervision, and writing‐review and editing.
ACKNOWLEDGMENTS
The authors would like to thank Dr. Orkan Kurtulus in the Center for High Performance Buildings at Purdue University for the assistance in setting the ventilation system in the environmental chamber. We would also like to thank all the participants for human tests of obtaining the data. The data collection in this study was approved by Purdue University IRB Protocol #2020‐775.
Deng Z, Chen Q. What is suitable social distancing for people wearing face masks during the COVID‐19 pandemic? Indoor Air. 2022;32:e12935. 10.1111/ina.12935
Funding information
This research did not receive specific funding.
REFERENCES
- 1. WHO . Coronavirus disease (COVID‐19) pandemic. https://www.who.int/emergencies/diseases/novel‐coronavirus‐2019
- 2. WHO . Q&A on coronaviruses. https://www.who.int/emergencies/diseases/novel‐coronavirus‐2019/question‐and‐answers‐hub/q‐a‐detail/q‐a‐coronaviruses
- 3. CDC . Coronavirus Disease 2019 (COVID‐19) Transmission. https://www.cdc.gov/coronavirus/2019‐ncov/faq.html
- 4. WHO . Report of the WHO‐China Joint Mission on Coronavirus Disease 2019 (COVID‐19). https://www.who.int/docs/default‐source/coronaviruse/who‐china‐joint‐mission‐on‐covid‐19‐final‐report.pdf
- 5. WHO . COVID‐19: physical distancing. https://www.who.int/westernpacific/emergencies/covid‐19/information/physical‐distancing
- 6. CDC . Social distancing. https://www.cdc.gov/coronavirus/2019‐ncov/prevent‐getting‐sick/social‐distancing.html
- 7. Wells WF. On air‐borne infection. Study II. Droplets and droplet nuclei. Am J Hygiene. 1934;20:611‐618. [Google Scholar]
- 8. Qureshi Z, Jones N, Temple R, Larwood JPJ, Greenhalgh T, Bourouiba L. What is the evidence to support the 2‐metre social distancing rule to reduce COVID‐19 transmission. Accessed on: https://www.cebm.net/covid‐19/what‐is‐the‐evidenceto‐support‐the‐2‐metre‐social‐distancing‐rule‐to‐reduce‐covid‐19‐transmission (2020).
- 9. Xie X, Li Y, Chwang ATY, Ho PL, Seto WH. How far droplets can move in indoor environments–revisiting the Wells evaporation–falling curve. Indoor Air. 2007;17(3):211‐225. [DOI] [PubMed] [Google Scholar]
- 10. Liu L, Li Y, Nielsen PV, Wei J, Jensen RL. Short‐range airborne transmission of expiratory droplets between two people. Indoor Air. 2017;27(2):452‐462. [DOI] [PubMed] [Google Scholar]
- 11. Gralton J, Tovey E, McLaws M‐L, Rawlinson WD. The role of particle size in aerosolised pathogen transmission: a review. J Infect. 2011;62(1):1‐13. [DOI] [PMC free article] [PubMed] [Google Scholar]
- 12. Bourouiba L. Turbulent gas clouds and respiratory pathogen emissions: potential implications for reducing transmission of COVID‐19. JAMA. 2020;323(18):1837‐1838. [DOI] [PubMed] [Google Scholar]
- 13. Setti L, Passarini F, De Gennaro G, et al. Airborne Transmission Route of COVID‐19: Why 2 Meters/6 Feet of Inter‐Personal Distance Could Not Be Enough. Int J Environ Res Public Health. 2020;17(8):2932. [DOI] [PMC free article] [PubMed] [Google Scholar]
- 14. Seminara G, Carli B, Forni G, Fuzzi S, Mazzino A, Rinaldo A. Biological fluid dynamics of airborne COVID‐19 infection. Rendiconti Lincei. Scienze Fisiche E Naturali. 2020;31(3):505‐537. [DOI] [PMC free article] [PubMed] [Google Scholar]
- 15. Li Y, Chunbin WU, Cao G, Guan D, Zhan C. Transmission characteristics of respiratory droplets aerosol in indoor environment: an experimental study. Int J Environ Health Res. 2021;1‐12. [DOI] [PubMed] [Google Scholar]
- 16. Rosti ME, Olivieri S, Cavaiola M, Seminara A, Mazzino A. Fluid dynamics of COVID‐19 airborne infection suggests urgent data for a scientific design of social distancing. Scientific Rep. 2020;10(1):1‐9. [DOI] [PMC free article] [PubMed] [Google Scholar]
- 17. Jones NR, Qureshi ZU, Temple RJ, Larwood JPJ, Greenhalgh T, Bourouiba L. Two metres or one: what is the evidence for physical distancing in covid‐19? BMJ. 2020;m3223. [DOI] [PubMed] [Google Scholar]
- 18. Chen Q. Can we migrate COVID‐19 spreading risk? Front Environ Sci Eng. 2021;15(3):1‐4. [DOI] [PMC free article] [PubMed] [Google Scholar]
- 19. van den Berg P, Schechter‐Perkins EM, Jack RS, et al. Effectiveness of 3 Versus 6 ft of Physical Distancing for Controlling Spread of Coronavirus Disease 2019 Among Primary and Secondary Students and Staff: A Retrospective, Statewide Cohort Study. Clin Infect Dis. 2021. 10.1093/cid/ciab230 [DOI] [PMC free article] [PubMed] [Google Scholar]
- 20. CDC . Use of cloth face coverings to help slow the spread of COVID‐19. https://www.cdc.gov/coronavirus/2019‐ncov/prevent‐getting‐sick/diy‐cloth‐face‐coverings.html
- 21. Coffey CC, Lawrence RB, Zhuang Z, Campbell DL, Jensen PA, Myers WR. Comparison of five methods for fit‐testing N95 filtering‐facepiece respirators. Appl Occup Environ Hygiene. 2002;17(10):723‐730. [DOI] [PubMed] [Google Scholar]
- 22. Bałazy A, Toivola M, Adhikari A, Sivasubramani SK, Reponen T, Grinshpun SA. Do N95 respirators provide 95% protection level against airborne viruses, and how adequate are surgical masks? Am J Infect Control. 2006;34(2):51‐57. [DOI] [PubMed] [Google Scholar]
- 23. Chua MH, Cheng W, Goh SS, et al. Face Masks in the New COVID‐19 Normal: Materials, Testing, and Perspectives. Research (Wash D C). 2020;2020:7286735. [DOI] [PMC free article] [PubMed] [Google Scholar]
- 24. Grinshpun SA, Haruta H, Eninger RM, Reponen T, McKay RT, Lee S‐A. Performance of an N95 filtering facepiece particulate respirator and a surgical mask during human breathing: two pathways for particle penetration. J Occup Environ Hyg. 2009;6(10):593‐603. [DOI] [PMC free article] [PubMed] [Google Scholar]
- 25. Rengasamy S, Eimer B, Shaffer RE. Simple respiratory protection—evaluation of the filtration performance of cloth masks and common fabric materials against 20–1000 nm size particles. Ann Occup Hyg. 2010;54(7):789‐798. [DOI] [PMC free article] [PubMed] [Google Scholar]
- 26. Shakya KM, Noyes A, Kallin R, Peltier RE. Evaluating the efficacy of cloth facemasks in reducing particulate matter exposure. J Exposure Sci Environ Epidemiol. 2017;27(3):352‐357. [DOI] [PubMed] [Google Scholar]
- 27. Lawrence RB, Duling MG, Calvert CA, Coffey CC. Comparison of performance of three different types of respiratory protection devices. J Occup Environ Hyg. 2006;3(9):465‐474. [DOI] [PubMed] [Google Scholar]
- 28. Loeb M, Dafoe N, Mahony J, et al. Surgical Mask vs N95 Respirator for Preventing Influenza Among Health Care Workers. JAMA. 2009;302(17):1865‐1871. [DOI] [PubMed] [Google Scholar]
- 29. Pan J, Harb C, Leng W, Marr LC. Inward and outward effectiveness of cloth masks, a surgical mask, and a face shield. Aerosol Sci Technol. 2021;55(6):718‐733. [Google Scholar]
- 30. Zangmeister CD, Radney JG, Vicenzi EP, Weaver JL. Filtration efficiencies of nanoscale aerosol by cloth mask materials used to slow the spread of SARS‐CoV‐2. ACS Nano. 2020;14(7):9188‐9200. [DOI] [PubMed] [Google Scholar]
- 31. MacIntyre CR, Wang Q, Cauchemez S, et al. A cluster randomized clinical trial comparing fit‐tested and non‐fit‐tested N95 respirators to medical masks to prevent respiratory virus infection in health care workers. Influenza Other Respir Viruses. 2011;5(3):170‐179. [DOI] [PMC free article] [PubMed] [Google Scholar]
- 32. O’Kelly E, Arora A, Pirog S, Ward J, John Clarkson P. Comparing the fit of N95, KN95, surgical, and cloth face masks and assessing the accuracy of fit checking. PLoS One. 2021;16(1):e0245688. [DOI] [PMC free article] [PubMed] [Google Scholar]
- 33. Brooks JT, Beezhold DH, Noti JD, et al. Maximizing fit for cloth and medical procedure masks to improve performance and reduce SARS‐CoV‐2 transmission and exposure, 2021. Morb Mortal Wkly Rep. 2021;70(7):254. [DOI] [PMC free article] [PubMed] [Google Scholar]
- 34. Hui DS, Chow BK, Chu L, et al. Exhaled air dispersion during coughing with and without wearing a surgical or N95 mask. PLoS One. 2012;7(12):e50845. [DOI] [PMC free article] [PubMed] [Google Scholar]
- 35. Chen C, Lin C‐H, Jiang Z, Chen Q. Simplified models for exhaled airflow from a cough with the mouth covered. Indoor Air. 2014;24(6):580‐591. [DOI] [PubMed] [Google Scholar]
- 36. Chen W, Zhang N, Wei J, Yen H‐L, Li Y. Short‐range airborne route dominates exposure of respiratory infection during close contact. Build Environ. 2020;176:106859. [Google Scholar]
- 37. Leung CC, Cheng KK, Lam TH, Migliori GB. Mask wearing to complement social distancing and save lives during COVID‐19. Int J Tuberc Lung Dis. 2020;24(6):556‐558. [DOI] [PubMed] [Google Scholar]
- 38. Li L, Niu M, Zhu Y. Assessing the effectiveness of using various face coverings to mitigate the transport of airborne particles produced by coughing indoors. Aerosol Sci Technol. 2020;1‐12.32308568 [Google Scholar]
- 39. Bandiera L, Pavar G, Pisetta G, et al. Face coverings and respiratory tract droplet dispersion. Royal Soc Open Sci. 2020;7(12):201663. [DOI] [PMC free article] [PubMed] [Google Scholar]
- 40. Fauci Warns It’s “Possible” Americans Will Still Be Wearing Face Masks in 2022. https://slate.com/news‐and‐politics/2021/02/fauci‐warns‐wearing‐face‐masks‐2022.html
- 41. Fauci says face masks could become seasonal after Covid pandemic. https://www.cnbc.com/2021/05/09/fauci‐says‐face‐masks‐could‐become‐seasonal‐after‐covid‐pandemic.html
- 42. Verma S, Dhanak M, Frankenfield J. Visualizing the effectiveness of face masks in obstructing respiratory jets. Phys Fluids. 2020;32(6):061708. [DOI] [PMC free article] [PubMed] [Google Scholar]
- 43. Prasanna Simha P, Mohan Rao PS. Universal trends in human cough airflows at large distances. Phys Fluids. 2020;32(8):081905. [DOI] [PMC free article] [PubMed] [Google Scholar]
- 44. Bhagat RK, Davies Wykes MS, Dalziel SB, Linden PF. Effects of ventilation on the indoor spread of COVID‐19. J Fluid Mech. 2020;903:1–18. [DOI] [PMC free article] [PubMed] [Google Scholar]
- 45. Viola IM, Peterson B, Pisetta G, et al. Face Coverings, Aerosol Dispersion and Mitigation of Virus Transmission Risk. IEEE Open J Eng Med Biol. 2021;2:26‐35. [DOI] [PMC free article] [PubMed] [Google Scholar]
- 46. Tang JW, Liebner TJ, Craven BA, Settles GS. A schlieren optical study of the human cough with and without wearing masks for aerosol infection control. J Royal Soc Interface. 2009;6(suppl_6):S727‐S736. [DOI] [PMC free article] [PubMed] [Google Scholar]
- 47. Sosnowski TR. Inhaled aerosols: Their role in COVID‐19 transmission, including biophysical interactions in the lungs. Curr Opin Colloid Interface Sci. 2021;54:101451. [DOI] [PMC free article] [PubMed] [Google Scholar]
- 48. Sickbert‐Bennett EE, Samet JM, Clapp PW, et al. Filtration efficiency of hospital face mask alternatives available for use during the COVID‐19 pandemic. JAMA Intern Med. 2020;180(12):1607‐1612. [DOI] [PMC free article] [PubMed] [Google Scholar]
- 49. Verma S, Dhanak M, Frankenfield J. Visualizing droplet dispersal for face shields and masks with exhalation valves. Phys Fluids. 2020;32(9):091701. [DOI] [PMC free article] [PubMed] [Google Scholar]
- 50. Tsubokura Makoto. Prediction and Countermeasures for Infection by Virus Contaminated Droplet in Indoor Environment. https://www.covid19‐ai.jp/ja‐jp/organization/riken/articles/article001
- 51. Xu M, Lee P, Collins D. The critical importance of mask seals on respirator performance: An analytical and simulation approach. PLoS One. 2021;16(2):e0246720. [DOI] [PMC free article] [PubMed] [Google Scholar]
- 52. Feng YU, Marchal T, Sperry T, Yi H. Influence of wind and relative humidity on the social distancing effectiveness to prevent COVID‐19 airborne transmission: A numerical study. J Aerosol Sci. 2020;147:105585. [DOI] [PMC free article] [PubMed] [Google Scholar]
- 53. Dbouk T, Drikakis D. On respiratory droplets and face masks. Phys Fluids. 2020;32(6):063303. [DOI] [PMC free article] [PubMed] [Google Scholar]
- 54. Pendar M‐R, Páscoa JC. Numerical modeling of the distribution of virus carrying saliva droplets during sneeze and cough. Phys Fluids. 2020;32(8):083305. [DOI] [PMC free article] [PubMed] [Google Scholar]
- 55. Khosronejad A, Santoni C, Flora K, et al. Fluid dynamics simulations show that facial masks can suppress the spread of COVID‐19 in indoor environments. AIP Adv. 2020;10(12):125109. [Google Scholar]
- 56. Fairbanks G. Voice and articulation drillbook. Laryngoscope. 1941;51(12):1141. [Google Scholar]
- 57. Seaver EJ, Dalston RM, Leeper HA, Adams LE. A study of nasometric values for normal nasal resonance. J Speech Language Hearing Res. 1991;34(4):715‐721. [DOI] [PubMed] [Google Scholar]
- 58. Morawska L. Droplet fate in indoor environments, or can we prevent the spread of infection? Indoor Air. 2006;16(5):335‐347. [DOI] [PubMed] [Google Scholar]
- 59. Potter JL, Matthews LW, Lemm J, Spector S. Human pulmonary secretions in health and disease. Ann N Y Acad Sci. 1963;106(2):692‐697. [DOI] [PubMed] [Google Scholar]
- 60. Gupta JK, Lin C‐H, Chen Q. Flow dynamics and characterization of a cough. Indoor Air. 2009;19(6):517‐525. [DOI] [PubMed] [Google Scholar]
- 61. Gupta JK, Lin C‐H, Chen Q. Characterizing exhaled airflow from breathing and talking. Indoor Air. 2010;20(1):31‐39. [DOI] [PubMed] [Google Scholar]
- 62. Morawska LJGR, Johnson GR, Ristovski ZD, et al. Size distribution and sites of origin of droplets expelled from the human respiratory tract during expiratory activities. J Aerosol Sci. 2009;40(3):256‐269. [Google Scholar]
- 63. Balachandar S, Zaleski S, Soldati A, Ahmadi G, Bourouiba L. Host‐to‐host airborne transmission as a multiphase flow problem for science‐based social distance guidelines. Int J Multiphase Flow. 2020;132:103439. [Google Scholar]
- 64. Zhang Z, Chen Q. Prediction of particle deposition onto indoor surfaces by CFD with a modified Lagrangian method. Atmos Environ. 2009;43(2):319‐328. [Google Scholar]
- 65. Gosman AD, Loannides E. Aspects of computer simulation of liquid‐fueled combustors. J Energy. 1983;7(6):482‐490. [Google Scholar]
- 66. Nicas M, Nazaroff WW, Hubbard A. Toward understanding the risk of secondary airborne infection: emission of respirable pathogens. J Occup Environ Hyg. 2005;2(3):143‐154. [DOI] [PMC free article] [PubMed] [Google Scholar]
- 67. Duguid JP. The size and the duration of air‐carriage of respiratory droplets and droplet‐nuclei. Epidemiol Infect. 1946;44(6):471‐479. [DOI] [PMC free article] [PubMed] [Google Scholar]
- 68. Chao C, Wan MP, Morawska L, et al. Characterization of expiration air jets and droplet size distributions immediately at the mouth opening. J Aerosol Sci. 2009;40(2):122‐133. [DOI] [PMC free article] [PubMed] [Google Scholar]
- 69. Fabian P, McDevitt JJ, DeHaan WH, et al. Influenza virus in human exhaled breath: an observational study. PLoS One. 2008;3(7):e2691. [DOI] [PMC free article] [PubMed] [Google Scholar]
- 70. Zhang Z, Zhang W, Zhai ZJ, Chen QY. Evaluation of various turbulence models in predicting airflow and turbulence in enclosed environments by CFD: Part 2—Comparison with experimental data from literature. HVAC&R Res. 2007;13(6):871‐886. [Google Scholar]
- 71. Kleinstreuer C, Zhang Z. Airflow and particle transport in the human respiratory system. Ann Rev Fluid Mech. 2010;42:301‐334. [Google Scholar]
- 72. Leung NHL, Chu DKW, Shiu EYC, et al. Respiratory virus shedding in exhaled breath and efficacy of face masks. Nat Med. 2020;26(5):676‐680. [DOI] [PMC free article] [PubMed] [Google Scholar]
- 73. Stadnytskyi V, Bax CE, Bax A, Anfinrud P. The airborne lifetime of small speech droplets and their potential importance in SARS‐CoV‐2 transmission. Proc Natl Acad Sci. 2020;117(22):11875‐11877. [DOI] [PMC free article] [PubMed] [Google Scholar]
- 74. Wang P, Casner RG, Nair MS, et al. Increased resistance of SARS‐CoV‐2 variant P. 1 to antibody neutralization. Cell Host Microbe. 2021;29(5):747‐751. [DOI] [PMC free article] [PubMed] [Google Scholar]
- 75. Abkarian M, Stone HA. Stretching and break‐up of saliva filaments during speech: a route for pathogen aerosolization and its potential mitigation. Phys Rev Fluids. 2020;5(10):102301. [Google Scholar]