Abstract
We compared readings of Kirby-Bauer plates by the Sirscan, an automated image analyzer that measures zone diameters, to those of experienced clinical microbiologists measuring zones with a hand-held caliper interfaced to a computer and with a ruler. To read plates of Escherichia coli, Morganella morganii, and Pseudomonas aeruginosa containing 12 antibiotic disks the Sirscan took 11 s; technologists took 28 s by caliper and 39 s by ruler. Reading times of four different technologists ranged from 22 to 44 s with the caliper and 10 to 12 s with Sirscan. Upon repeated testing zone size variation rarely exceeded 3 mm by caliper and 1 mm by Sirscan. Over a 4-month period, 368 clinical isolates were tested prospectively by both methods in the Clinical Microbiology Laboratory of the Miriam Hospital. There was good correlation of zone sizes for most antibiotics, but Sirscan zone diameter measurements tended to be 3 to 5 mm larger than caliper readings for ciprofloxacin, norfloxacin, aztreonam, erythromycin, clindamycin, and trimethoprim-sulfamethoxazole. Very major errors (resistant by caliper and susceptible by Sirscan) occurred with 10 of 3,770 readings (0.3%), mainly where breakpoint criteria lacked an intermediate zone. They occurred in testing staphylococci with amoxicillin-clavulanate (5 of 127 isolates, 3.9%), pseudomonas with piperacillin (1 of 28, 3.6%), coagulase-negative staphylococci with oxacillin (2 of 74, 2.7%), gram-negative bacilli with cefuroxime (1 of 209, 0.5%), and mixed species with trimethoprim-sulfamethoxazole (1 of 366, 0.3%). The Sirscan zone reader facilitates accurate, fully quantitative susceptibility testing in clinical microbiology laboratories.
Early detection of emerging resistance mechanisms requires quantitative susceptibility testing, either zone diameter measurements or full panel MICs, as recommended by the ASM Task Force on Antibiotic Resistance (2). However, most commonly used automated methods provide only breakpoint values of antibiotic susceptibility. Single disk diffusion provides more endpoint values, about 35, than most full-panel dilution methods, about 12, but measuring zone sizes is tedious, time-consuming, and fraught with transcription errors. An automated method of measuring zone sizes would obviate these limitations.
In our clinical microbiology laboratory, we evaluated the Sirscan (i2a, Montpelier, France), an automated image analyzer that measures zone diameters and provides a user-programmed expert system that screens the results of each isolate. The program also extrapolates zone sizes to MICs and reports both.
Susceptibility tests.
Testing was performed by the Kirby-Bauer single disk diffusion method according to National Committee on Clinical Laboratory Standards (NCCLS) guidelines (4), using 150-mm round plates of Mueller-Hinton agar purchased from BBL, Becton-Dickinson, Cockeysville, Md.
Strains tested.
Strains were fresh clinical isolates from the Clinical Microbiology Laboratory of the Miriam Hospital. The number of isolates tested per species are as follows: 101 isolates of Escherichia coli, 74 isolates of coagulase-negative staphylococci, 53 isolates of Staphylococcus aureus, 28 isolates of Pseudomonas aeruginosa, 25 isolates of Klebsiella pneumoniae, 15 isolates of Serratia marcescens, 13 isolates of Klebsiella oxytoca, 13 isolates of Proteus mirabilis, 12 isolates of Enterobacter cloacae, 8 isolates of Citrobacter freundii, 8 isolates of Acinetobacter baumanii, 8 isolates of S. maltophilia, 7 isolates of Enterobacter aerogenes, and 1 isolate each of Serratia liquefaciens, Proteus penneri, and Salmonella sp. Thirty-five percent were urine isolates, 21% were from sputum, 19% were from blood, 11% were from wounds, and the remainder came from miscellaneous sources.
Control strains were E. coli ATCC 25922, P. aeruginosa ATCC 27853, and S. aureus ATCC 25923.
Zone diameter readings with a ruler.
A technologist experienced in reading zones with a ruler placed the Kirby-Bauer (K-B) plate (150-mm diameter and round) on a view box with reflected light against a black background and measured the zone diameters manually. She dictated the readings to a colleague who recorded the results. When performing repeat readings of multiple plates, the technologist cycled the different plates.
Caliper readings.
Six technologists in the clinical microbiology laboratory participated in these studies. They placed the K-B plates on the viewer and measured zones by using a digital caliper (Sylvac; Fowler Tools and Instruments, Boston, Mass.) connected to a foot pedal. When the pedal was depressed, the zone diameter automatically entered a database (WHONET) on a desktop personal computer.
Sirscan readings.
After putting the K-B plate on a sliding tray, a keystroke initiates the zone readings. An image of the plate appears on the screen, with the zone diameters encircled by a green (susceptible), yellow (intermediate), or red (resistant) circle. At this point the reader can modify the zone readings. Another keystroke automatically enters the values into the Sirscan database. The timing tests performed on the quality control strains and the three clinical isolates were done without modifying the Sirscan readings. In the prospective study of 368 clinical isolates, the reader did not adjust the Sirscan readings (automatic readings) with the first 114 isolates; the remainder were adjusted as judgment dictated (reviewed readings).
Timing studies.
A stopwatch was used to time all readings. Timing began when the technologist commenced reading the zone sizes of the K-B plate on the viewer. With the Sirscan, timing began when the keystroke initiated the reading of the K-B plate in the loading tray.
Time required to measure zone diameters.
Table 1 shows the results of readings of clinical isolates of S. aureus, E. coli, and Morganella morganii by the three different methods. The median time to read the 12 disk diameters on the plates with gram-negative bacilli was 39 s by ruler, 28 s by caliper, and 11 seconds by Sirscan.
TABLE 1.
Repeated zone diameter measurements of three clinical isolates and three quality control strains by ruler, caliper, and Sirscan
| Isolate, reader(s), and method (n)a | Time (s), (mean ± SD) | Diam (mm, mean ± SD) of zone of inhibitionb | |||||||||||
|---|---|---|---|---|---|---|---|---|---|---|---|---|---|
| E. coli (CI) | FUR | KEF | AMP | GEN | SXT | FTX | IMP | AUG | FRX | MEZ | NOR | ATM | |
| J.C., ruler (5) | 39.4 ± 2.7 | 19.8 ± 0.4 | 17 ± 0 | 19 ± 0 | 18 ± 0 | 25.8 ± 0.4 | 28.8 ± 0.4 | 27.4 ± 0.5 | 19.6 ± 0.5 | 22 ± 0.9 | 24 ± 0 | 25.6 ± 0.8 | 28.6 ± 0.5 |
| S.M., caliper (5) | 26.2 ± 2.0 | 19.8 ± 0.4 | 17 ± 0 | 19.2 ± 0.4 | 18 ± 0.6 | 25.6 ± 0.5 | 28.8 ± 0.4 | 27.2 ± 0.4 | 19.4 ± 0.5 | 21.8 ± 0.4 | 24 ± 0 | 26 ± 0.6 | 28.4 ± 0.5 |
| 4 Techs, caliper (4) | 32 ± 6.0 | 19.8 ± 0.4 | 17.3 ± 0.4 | 19.5 ± 0.5 | 18.8 ± 1.3 | 26 ± 0 | 29.8 ± 0.8 | 28.3 ± 0.8 | 19.8 ± 0.8 | 22.3 ± 1.5 | 25 ± 0 | 27.3 ± 1.3 | 29 ± 1.6 |
| J.C., Sirscan (10) | 10.7 ± 0.6 | 20 ± 0 | 16.6 ± 0.5 | 19 ± 0 | 20.6 ± 0.7 | 27.7 ± 0.6 | 31.8 ± 0.4 | 27.7 ± 0.9 | 19 ± 0 | 22.2 ± 0.4 | 25.2 ± 0.4 | 31.9 ± 0.3 | 31.2 ± |
| M. morganii (CI) | KEF | AMP | GEN | SXT | FTX | IMP | FRX | MEZ | ATM | FOX | PIP | CIP | |
| J.C., ruler (5) | 37.2 ± 3.4 | 6 ± 0 | 6 ± 0 | 17. ± 0 | 22.2 ± 0.7 | 17 ± 0 | 19 ± 0.6 | 8 ± 0 | 11.2 ± 0.4 | 21.2 ± 1.2 | 16 ± 0 | 16 ± 0.6 | 28.4 ± 0.8 |
| S.M., caliper (5) | 26.2 ± 4.5 | 6 ± 0 | 6 ± 0 | 17 ± 0 | 22.2 ± 0.4 | 16.6 ± 0.5 | 19.2 ± 0.4 | 6.4 ± 0.8 | 12.4 ± 0.5 | 22 ± 0 | 16 ± 0 | 15.8 ± 0.4 | 27.6 ± 0.5 |
| 4 Techs, caliper (4) | 33 ± 6.7 | 6.3 ± 0.4 | 6 ± 0 | 17.3 ± 0.4 | 22.3 ± 1.3 | 17 ± 0 | 19.5 ± 0.5 | 7.5 ± 0.9 | 12 ± 0.7 | 23 ± 1.2 | 16.5 ± 0.5 | 16 ± 0.7 | 28.8 ± 2.3 |
| J.C., Sirscan (10) | 11 ± 0.6 | 6 ± 0 | 6 ± 0 | 17.7 ± 1.0 | 25.7 ± 1.9 | 17 ± 0 | 23.3 ± 0.5 | 6 ± 0 | 13.5 ± 0.7 | 24.2 ± 0.4 | 16.2 ± 0.4 | 16 ± 0 | 366 ± 2.2 |
| S. aureus (CI) | GEN | AUG | CIP | PEN | ERY | CLI | OXA | VAN | |||||
| J.C., ruler (5) | 27 ± 2.8 | 20.2 ± 0.4 | 26.6 ± 0.5 | 21 ± 0 | 14.0 ± 0 | 6 ± 0 | 23.6 ± 0.5 | 17.8 ± 0.4 | 18.8 ± 0.4 | ||||
| S.M., caliper (5) | 17.6 ± 1.2 | 20 ± 0 | 26 ± 0 | 21 ± 0 | 14.2 ± 0.4 | 6 ± 0 | 24 ± 0 | 18 ± 0 | 18.8 ± 0.4 | ||||
| 4 Techs, caliper (4) | 21.8 ± 5.4 | 20.5 ± 0.5 | 26.8 ± 0.8 | 22 ± 1.2 | 14.5 ± 0.5 | 6.5 ± 0.9 | 24 ± 0.7 | 18.8 ± 0.4 | 19.3 ± 0.8 | ||||
| J.C., Sirscan (10) | 11 ± 0.6 | 20.8 ± 0.4 | 27 ± 0 | 21.4 ± 0.5 | 14.6 ± 0.5 | 9.6 ± 0.5 | 27.2 ± 0.7 | 17.4 ± 0.5 | 18 ± 0 | ||||
| E. coli 25922 (QC) | KEF | AMP | GEN | SXT | FRX | IMP | FRX | MEZ | ATM | FOX | PIP | CIP | |
| L.S., caliper (6) | 22 ± 2.6 | 18.3 ± 0.5 | 19.7 ± 0.5 | 19 ± 0.6 | 25 ± 0.6 | 29.3 ± 0.9 | 25.7 ± 0.7 | 22.7 ± 0.5 | 24.7 ± 0.5 | 29.17 ± 1.1 | 25.3 ± 0.5 | 25 ± 0 | 31.5 ± 1.3 |
| 3 Techs, caliper (3) | 29 ± 5.1 | 17.3 ± 0.5 | 18.7 ± 0.9 | 19.3 ± 0.5 | 25 ± 0 | 29 ± 0 | 26 ± 0.8 | 21.7 ± 0.9 | 23.3 ± 0.5 | 29 ± 0.8 | 25.3 ± 0.5 | 25 ± 0.8 | 31.7 ± 0.5 |
| J.C., Sirscan (10) | 11.1 ± 0.3 | 17.2 ± 0.4 | 18.2 ± 0.4 | 21.8 ± 0.9 | 25 ± 0 | 31.9 ± 0.3 | 30.3 ± 0.5 | 22.3 ± 0.5 | 25.2 ± 0.4 | 31.9 ± 0.3 | 24.8 ± 0.6 | 27.2 ± 0.4 | 36 ± 0 |
| P. aeruginosa 27853 (QC) | GEN | SXT | IMP | MEZ | ATM | PIP | CIP | CHL | TOB | AMK | CAR | CAZ | |
| L.S., caliper (6) | 20.5 ± 1.0 | 18.3 ± 0.5 | 6 ± 0 | 23 ± 0.6 | 19.8 ± 0.7 | 25.3 ± 0.5 | 26.2 ± 0.4 | 25.5 ± 0.5 | 6 ± 0 | 20.8 ± 0.4 | 21.67 ± 0.5 | 19.5 ± 0.8 | 26.3 ± 0.5 |
| 3 Techs, caliper (3) | 29.7 ± 5.1 | 18 ± 0 | 6 ± 0 | 22.3 ± 0.5 | 20 ± 0 | 25 ± 0.8 | 26.3 ± 0.5 | 26 ± 1.4 | 6 ± 0 | 20.3 ± 0.5 | 21.7 ± 0.5 | 20 ± 0 | 26 ± 1.4 |
| J.C., Sirscan (10) | 11 ± 0 | 18.1 ± 0.3 | 6 ± 0 | 23 ± 0.6 | 20.1 ± 0.3 | 26 ± 0 | 28.9 ± 0.3 | 30.8 ± 0.6 | 6 ± 0 | 20.3 ± 0.6 | 21.8 ± 0.9 | 21.1 ± 0.3 | 27 ± 0 |
| S. aureus 25923 (QC) | GEN | SXT | AUG | CIP | PEN | ERY | CLI | EXA | VAN | ||||
| L.S., caliper (6) | 15.5 ± 1.3 | 22.5 ± 0.5 | 27.7 ± 0.5 | 30.8 ± 0.4 | 23.5 ± 0.8 | 34.7 ± 0.5 | 26.2 ± 0.4 | 25.7 ± 0.5 | 24.2 ± 0.4 | 18.8 ± 0.4 | |||
| 3 Techs, caliper (3) | 21 ± 2.4 | 20.6 ± 0.5 | 27.7 ± 0.5 | 30.3 ± 1.2 | 23.7 ± 0.9 | 33.7 ± 0.9 | 24.7 ± 0.9 | 24.3 ± 0.5 | 23 ± 0.8 | 17.7 ± 0.5 | |||
| J.C., Sirscan (10) | 11 ± 0 | 20.9 ± 0.3 | 29.6 ± 0.5 | 32.5 ± 0.5 | 25 ± 0 | 34 ± 0 | 27.1 ± 0.3 | 28.1 ± 0.5 | 24.4 ± 0.5 | 17 ± 0 | |||
Readers are indicated by initials. Techs, tchnicians; CI, clinical isolate; QC, quality control strain; n, number of reads.
FUR, nitrofurantoin; KEF, cephalothin; AMP, ampicillin; GEN, gentamicin; SXT, trimethoprim-sulfamethoxazole; FTX, cefotaxime; IMP, imipenem; AUG, amoxicillin-clavulanate; FRX, cefuroxime; MEZ, mezlocillin; NOR, norfloxacin; ATM, aztreonam; FOX, cefoxitin; PIP, piperacillin; CIP, ciprofloxacin; PEN, penicillin; ERY, erythromycin; CLI, clindamycin; OXA, oxacillin; VAN, vancomycin; CHL, chloramphenicol; TOB, tobramycin; AMK, amikacin; CAR, carbenicillin; CAZ, ceftazidime.
Reading the eight disks on the S. aureus plate took 27 s by ruler, 18 s by caliper, and 11 s by Sirscan. The reading times of four different technologists using the caliper ranged from 24 to 41 s for the E. coli plates, 22 to 44 s for the M. morganii plates, and 17 to 31 s for the S. aureus plates. Sirscan reading times varied between 10 and 12 s. Similar results were observed with the control strains.
Zone size variation upon repeated testing.
Zone sizes of control strains varied by more than 2 mm in 1 of 340 (0.3%) determinations by Sirscan and 6 of 297 (2.0%) readings by caliper. With three clinical isolates, zone diameters varied more than 2 mm in 4 of 297 (1.3%) readings by Sirscan and 7 of 330 (2.1%) readings by caliper. Variation exceeded 3 mm in 4 of 1,254 (0.3%) readings.
Comparison of zone sizes measured by a Sirscan automated reader with those measured by caliper.
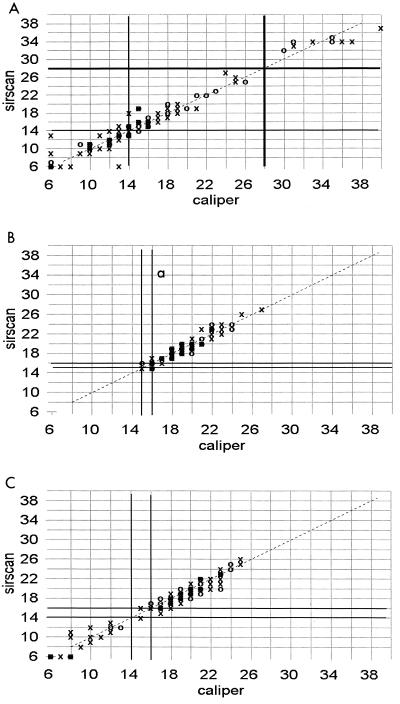
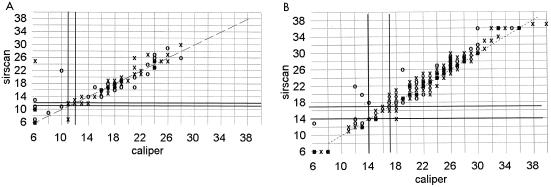
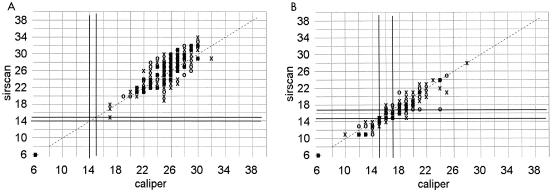
Over a 4-month period, 368 fresh clinical isolates were tested prospectively by both methods in the Clinical Microbiology Laboratory. Correlation of zone diameter sizes was very good with penicillin, vancomycin, and ampicillin disks (Fig. 1). There was also good correlation of diameters for oxacillin and amoxicillin-clavulanate, although Sirscan failed to detect light growth around the oxacillin disk in 3 of 131 (2.3%) isolates and around the amoxicillin-clavulanate disk in 2 of 219 isolates (0.9%) (Fig. 2). Correlation of zone sizes was good, but not as tight, for imipenem and cephalothin, perhaps due to species-specific variation in growth around these disks (Fig. 3). In this regard, zone diameters around imipenem disks were 2 to 3 mm larger by Sirscan than by caliper with the control clinical isolates of M. morganii, but not with the E. coli or P. aeruginosa isolates.
FIG. 1.
Correlation of zone diameters as measured with a Sirscan image analyzer to caliper readings. Dark lines represent the NCCLS breakpoints. ○, automatic reading; X, reviewed reading. (A) Penicillin disk with 127 clinical isolates of staphylococci. (B) Vancomycin disk with 127 staphylococci. (C) Ampicillin disk with 209 gram-negative isolates.
FIG. 2.
Correlation of zone diameters as measured with a Sirscan image analyzer to caliper readings. ○, automatic reading; X, reviewed reading. (A) Oxacillin disk with 53 clinical isolates of S. aureus and 74 coagulase-negative staphylococci. (B) Amoxicillin-clavulanate disk with 127 staphylococci and 87 gram-negative bacilli. The NCCLS breakpoints are not shown because they differ for the different groups of bacteria.
FIG. 3.
Correlation of zone diameters as measured with a Sirscan image analyzer to caliper readings. Dark lines represent the NCCLS breakpoints. ○, automatic reading; X, reviewed reading. (A) Imipenem disk with 241 gram-negative isolates. (B) Cephalothin disk with 210 gram-negative isolates.
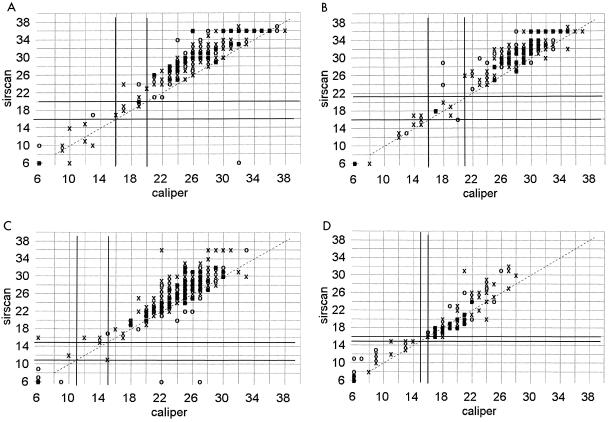
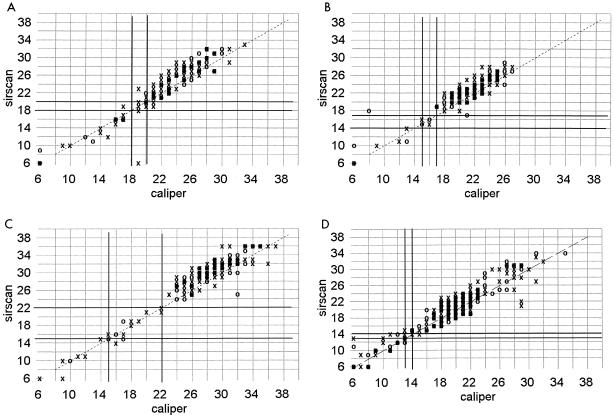
Sirscan zone diameter measurements tended to be 3 to 5 mm larger than caliper readings around ciprofloxacin, norfloxacin, aztreonam, trimethoprim-sulfamethoxazole, and nitrofurantoin disks when testing gram-negative bacilli (Fig. 4) and around erythromycin and clindamycin disks with staphylococci (Fig. 5). The effect tended to be more pronounced the larger the zone diameter, especially with nitrofurantoin. A less pronounced shift of zone sizes, about 2 to 3 mm greater with Sirscan than by caliper, occurred with piperacillin, mezlocillin, cefuroxime, cefotaxime, and gentamicin (Fig. 6). There was little difference in these shifts between the automatic and reviewed readings.
FIG. 4.
Correlation of zone diameters as measured with a Sirscan image analyzer to caliper readings. Dark lines represent the NCCLS breakpoints. ○, automatic reading; X, reviewed reading. (A) Ciprofloxacin disk with 278 staphylococci and gram-negative bacilli. (B) Aztreonam disk with 241 gram-negative isolates. (C) Trimethoprim-sulfamethoxazole disk with 366 staphylococci and gram-negative bacilli. (D) Nitrofurantoin disk with 115 staphylococci and gram-negative bacilli. Norfloxacin readings are not shown.
FIG. 5.
Correlation of zone diameters as measured with a Sirscan image analyzer to caliper readings. Dark lines represent the NCCLS breakpoints. ○, automatic reading; X, reviewed reading. (A) Erythromycin disk with 127 clinical isolates of staphylococci. (B) Clindamycin disk with 127 clinical isolates of staphylococci.
FIG. 6.
Correlation of zone diameters as measured with a Sirscan image analyzer to caliper readings. Dark lines represent the NCCLS breakpoints. ○, automatic reading; X, reviewed reading. (A) Piperacillin disk with 28 Pseudomonas and 124 other gram-negative isolates. (B) Cefuroxime disk with 209 gram-negative isolates. (C) Cefotaxime disk with 209 gram-negative isolates. (D) Gentamicin disk with 364 isolates of staphylococci and gram-negative bacilli. Mezlocillin readings are not shown.
Very major errors (resistant by caliper and susceptible by Sirscan) occurred with 10 of 3,770 (0.3%) readings (Table 2). Eight of the 10 very major errors were with antibiotic disks that had no intermediate zone separating the resistant and susceptible populations. They occurred in testing staphylococci with amoxicillin-clavulanate (5 of 128, 3.9%), pseudomonas with piperacillin (1 of 28, 3.6%), coagulase-negative staphylococci with oxacillin (2 of 74, 2.7%), gram-negative bacilli with cefuroxime (1 of 209, 0.5%), and mixed species with trimethoprim-sulfamethoxazole (1 of 366, 0.3%). The percentages of results that were very major errors were not statistically different between the automatic and reviewed readings.
TABLE 2.
Isolates susceptible, intermediate, or resistant as determined by caliper and Sirscan readings of zone diameters
| Antibiotic(s) | Isolate(s) | NCCLS breakpoints (mm) | No. tested | SIc/SIsa | Rc/Rsb | SIc/Rsc | Rc/SIsd | Zone size(s) (mm) of Rc/SIs isolate(s)e | % of results that were very major errorsf |
|---|---|---|---|---|---|---|---|---|---|
| Amoxicillin-clavulanate | Staphylococcus sp. | ≥20 | 127 | 102 | 19 | 1 | 5 | 20 (S), 20 (S), 20 (S), 21 (S), 22 (S) | 3.9 |
| Gram-negative bacilli | 14–17 | 87 | 73 | 14 | 0 | 0 | |||
| Ampicillin | Gram-negative bacilli | 14–16 | 209 | 87 | 122 | 0 | 0 | ||
| Aztreonam | Gram-negative bacilli | 16–21 | 241 | 219 | 18 | 0 | 4 | 16 (I), 17 (I), 17 (I), 17 (I) | |
| Cefotaxime | Gram-negative bacilli | 15–22 | 209 | 197 | 10 | 1 | 1 | 15 (I) | |
| Cefuroxime sodium | Gram-negative bacilli | 15–17 | 209 | 171 | 37 | 0 | 1 | 18 (S) | 0.5 |
| Cephalothin | Gram-negative bacilli | 15–17 | 210 | 128 | 75 | 7 | 0 | ||
| Ciprofloxacin | Gram-negative bacilli and Staphylococcus sp. | 16–20 | 278 | 221 | 56 | 0 | 1 | 17 (I) | |
| Clindamycin | Staphylococcus sp. | 15–20 | 127 | 99 | 28 | 0 | 0 | ||
| Erythromycin | Staphylococcus sp. | 14–22 | 127 | 46 | 79 | 0 | 2 | 14 (I), 14 (I) | |
| Gentamicin | Gram-negative bacilli and Staphylococcus sp. | 13–14 | 364 | 326 | 35 | 1 | 2 | 14 (I), 14 (I) | |
| Imipenem | Gram-negative bacilli | 14–15 | 241 | 233 | 8 | 0 | 0 | ||
| Mezlocillin | Pseudomonas sp. | ≥16 | 28 | 18 | 10 | 0 | 0 | ||
| Other gram-negative bacilli | 18–20 | 212 | 159 | 48 | 4 | 1 | 18 (I) | ||
| Nitrofurantoin | Gram-negative bacilli and Staphylococcus sp. | 15–16 | 115 | 92 | 18 | 0 | 5 | 15 (I), 15 (I), 15 (I), 15 (I), 15 (I) | |
| Norfloxacin | Gram-negative bacilli | 18–20 | 87 | 1 | 86 | 0 | 0 | ||
| Oxacillin | Coagulase-negative staphylococci | ≥18 | 74 | 19 | 53 | 0 | 2 | 22 (S), 25 (S) | 2.7 |
| S. aureus | 11–12 | 53 | 38 | 15 | 0 | 0 | |||
| Penicillin G | Staphylococcus sp. | 28–29 | 127 | 115 | 12 | 0 | 0 | ||
| Piperacillin | Pseudomonas sp. | ≥18 | 28 | 26 | 1 | 0 | 1 | 19 (S) | 3.6 |
| Other gram-negative bacilli | 18–20 | 124 | 92 | 31 | 1 | 0 | |||
| Trimethoprim-sulfamethoxazole | Gram-negative bacilli and Staphylococcus sp. | 11–15 | 366 | 266 | 96 | 2 | 2 | 16 (S), 12 (I) | 0.3 |
| Vancomycin | Staphylococcus sp. | ≥15 | 127 | 127 | 0 | 0 | 0 |
Number of isolates susceptible or intermediate by both caliper and Sirscan.
Number of isolates resistant by both caliper and Sirscan.
Number of isolates susceptible or intermediate by caliper and resistant by Sirscan.
Number of isolates resistant by caliper and susceptible or intermediate by Sirscan.
S, sensitive; I, intermediate; R, resistant.
(Number of Rc/SIs isolates) − (number of intermediate isolates)/number of isolates tested × 100.
Discussion.
The Sirscan image analyzer reads zone diameters more than twice as rapidly as skilled technologists using a computer interfaced caliper system. Reproducibility of measurements was excellent, within about 1 mm for Sirscan and 3 mm for caliper readings. The latter, however, tended to vary with the technologist, unlike readings made with the Sirscan.
With regard to concordance of zone diameter measurements, the Sirscan often failed to detect light growth at the margins (“beach effect”) of the inhibition zones of some disks. Consequently, zone diameters measured by Sirscan were significantly larger for ciprofloxacin, norfloxacin, aztreonam, erythromycin, clindamycin, and trimethoprim-sulfamethoxazole. However, these differences rarely affected the classification of the isolate as susceptible or resistant. The overall frequency of very major errors (resistant by caliper and susceptible by Sirscan) was low, i.e., 0.3% (10/3,770 readings). Three of these errors occurred with the oxacillin disk, reflecting the difficulty of visualizing the light growth that sometimes occurs around the oxacillin disk with resistant S. aureus organisms. Another possible source of error is failure to swab the K-B plate thoroughly. If growth is not confluent, the Sirscan may read between the growth. A technician screening the Sirscan readings prior to validation and modifying them as needed can minimize these errors.
A study comparing the Sirscan readings to manual readings done in four laboratories in France reported a higher rate (1.76%) of very major errors, which varied according to species, antibiotic, and hospital (1). Burkholderia cepacia, Staphylococcus epidermidis, Stenotrophomonas maltophilia, and Branhamella isolates were especially problematical. Differences between the two studies are probably due to the mix of species and antibiotics tested. For example, our study did not include Branhamella isolates and the antibiotics fosfomycin and cefoperazone, which had high discordance rates. Interestingly, their study showed that square petri dishes yielded more reliable results than round dishes.
The Sirscan image analyzer merits strong consideration as a method of measuring and recording zone diameters. It provides a fully quantitative measure of antibiotic resistance, an important parameter for tracking emerging mechanisms of resistance and their spread in hospital bacteria (2). The computer interface with an expert system that screens each result according to user-defined algorithms enhances quality control. It also would make it feasible to employ species-specific breakpoints if and when such criteria are developed (3, 5). A limitation of the Sirscan is its inability to read plates inoculated with enterococcus or haemophilus species due to their light growth.
Acknowledgments
We are grateful to Louise Alaownis, Nancy Miller, Susan Mitchison, Susan Rainone, Leslie Roop, and Lorraine Sinesi for performing expert caliper readings.
REFERENCES
- 1.Acar J, Bellon O, Chardon H, Charrel J, Goldstein F, Labia R, Sirot J. [Statistical study of the SIRSCAN computerized camera] Pathol Biol. 1997;45:383–388. . [In French.] [PubMed] [Google Scholar]
- 2.ASM Task Force on Antibiotic Resistance. Report of the ASM Task Force on Antibiotic Resistance. Washington, D.C.: American Society for Microbiology; 1995. [Google Scholar]
- 3.Furtado G L, Medeiros A A. Single-disk diffusion testing (Kirby-Bauer) of susceptibility of Proteus mirabilis to chloramphenicol: significance of the intermediate category. J Clin Microbiol. 1980;12:550–553. doi: 10.1128/jcm.12.4.550-553.1980. [DOI] [PMC free article] [PubMed] [Google Scholar]
- 4.National Committee on Clinical Laboratory Standards. Performance standards for antimicrobial disk susceptibility tests. NCCLS document M2-A6. Vol. 19 1999. , no. 1. National Committee on Clinical Laboratory Standards. Wayne, Pa. [Google Scholar]
- 5.Ringertz S, Olsson-Liljequist B, Kahlmeter G, Kronvall G. Antimicrobial susceptibility testing in Sweden. II. Species-related zone diameter breakpoints to avoid interpretive errors and guard against unrecognized evolution of resistance. Scand J Infect Dis. 1997;29:8–12. [PubMed] [Google Scholar]


