Abstract
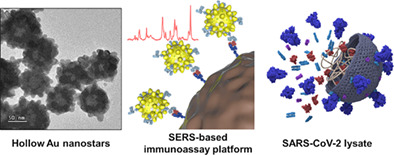
We developed a novel surface‐enhanced Raman scattering (SERS)‐based SARS‐CoV‐2 assay platform using hollow Au nanostars to realize high‐sensitivity diagnosis of SARS‐CoV‐2. The assay was performed using SARS‐CoV‐2 lysate as the target in a wide dynamic range with virus concentrations ranging from 0 to 104 PFU/ml and has a limit of detection (LOD) of 5.1 PFU/ml. This LOD value shows 100 times and 10 times better sensitivity compared to the LODs measured on the same sample using a commercially available rapid kit and enzyme‐linked immunosorbent assay, respectively. Therefore, we believe that this SERS‐based SARS‐CoV‐2 assay platform has high diagnostic accuracy for early or asymptomatic infected patients with low virus concentrations. Furthermore, the probability of a false‐negative diagnosis is likely to be very low.
Keywords: hollow gold nanostar, immunoassay, magnetic bead, SARS‐CoV‐2, surface‐enhanced Raman scattering
A new magnetic bead‐based SERS assay platform was developed to overcome the sensitivity limit of the commercially available SARS‐CoV‐2 immunodiagnostic kits. A novel hollow gold nanostars (HAuNSs), with a high enhancement factor and good stability, was employed for the detection of nucleocapsid protein from SARS‐CoV‐2. The assay could be performed in a wide dynamic range with virus concentrations ranging from 10−2 to 104 PFU/ml and showed an LOD value of 5.1 PFU/ml using this platform.
INTRODUCTION
The severe acute respiratory syndrome coronavirus 2 (SARS‐CoV‐2) pandemic is currently causing severe social, economic, political, and economic problems. 1 , 2 , 3 Although the virus transmission has slowed due to the supply of vaccines developed in several countries, the emergence of mutated viruses is driving again increasing the fear of infectious diseases. 4 , 5 , 6 The best way to quickly block the spread of the virus is to isolate confirmed patients through rapid and accurate diagnosis of SARS‐CoV‐2. 7 , 8 , 9 Unfortunately, no on‐site diagnostic technology satisfies the speed and accuracy of the diagnostic technologies approved so far. As the molecular diagnostic method using reverse‐transcription polymerase chain reaction (RT‐PCR) to detect the presence of viral ribonucleic acid (RNA) has excellent sensitivity and specificity, it has been extensively used as a standard diagnostic method. 10 , 11 , 12 However, this diagnosis involves RNA extraction from a clinical sample and its conversion to deoxyribonucleic acid (DNA) through a reverse transcription process, followed by DNA amplification through more than 30 PCR cycles before fluorescence detection. Thus, a long analysis time is required. In the immunodiagnostic kit, which detects the protein present on the surface or inside the SARS‐CoV‐2, the diagnosis result can be confirmed within 30 min. Nonetheless, the accuracy of the initial or asymptomatic infection is less than 50% because of its limited detection sensitivity. 13 , 14 , 15 Therefore, there is an urgent need to develop new diagnostic technologies to fulfill the need for diagnostic speed and accuracy.
In this study, we attempted to improve the diagnostic sensitivity of the SARS‐CoV‐2 immunoassay using a surface‐enhanced Raman scattering (SERS)‐based detection technique. Our research group has previously reported several high‐sensitivity immunoassay results for various disease biomarkers using a SERS‐based assay. 16 , 17 , 18 , 19 , 20 Despite these efforts, two issues need to be addressed when gold nanoparticles (AuNPs) are used as SERS nanotags using magnetic beads. First, it is difficult to control the aggregation of particles to maintain a uniform hot spot when AuNPs are aggregated in solution to form nanogaps. Second, it is difficult to create hot spots on the surface of magnetic beads because AuNPs cannot develop hot spots at the single‐particle level. To resolve these problems, hollow gold nanostars (HAuNSs), which show a substantial localized surface plasmon effect at the single‐particle level and good stability under salt conditions, were synthesized and applied for SARS‐CoV‐2 assays. Their signal enhancement effect and aggregation stability were compared with those measured for AuNPs, hollow gold nanoparticles (HAuNPs), and gold nanostars (AuNSs) to evaluate the usefulness of HAuNSs as a SERS tag. 21 , 22 , 23 , 24 , 25
In addition, SERS‐based assays using HAuNSs have been used to solve the false‐negative diagnostic problems of existing rapid kit‐based SARS‐CoV‐2 immunodiagnostic methods. The assays were performed using a SARS‐CoV‐2 lysate to create a detection environment closer to the clinical conditions. This study is expected to contribute to improve the diagnostic sensitivity for SARS‐CoV‐2 in currently available commercial immunochromatographic kits.
EXPERIMENTAL
Reagents and materials
Trisodium citrate (Na3‐citrate), sodium borohydride (NaBH4), cobalt (II) chloride hexahydrate (CoCl2), gold (III) chloride trihydrate (HAuCl4·3H2O), silver nitrate (AgNO3), l‐ascorbic acid (AA), sodium chloride (NaCl), bovine serum albumin (BSA), 1‐ethyl‐3‐(3‐[dimethylamino]propyl) carbodiimide (EDC), N‐hydroxysuccinimide (NHS), thiol‐PEG‐COOH (HS‐PEGCOOH, MW ∼3500), poly(ethylene glycol) methyl ether thiol (HSPEG, MW 2000), 3,3′,5,5′‐tetramethylbenzidine (TMB), Tween 20, and 2‐(N‐morpholino)ethanesulfonic acid (MES) were purchased from Sigma‐Aldrich (St. Louis, MO, USA). Malachite green isothiocyanate (MGITC) and phosphate‐buffered saline (PBS; 10×, pH 7.4) were obtained from Invitrogen (Eugene, OR, USA). Borate buffer (20×) and commercial carboxylic acid‐conjugated magnetic beads (DynabeadsfiMyOne) were purchased from Thermo Fisher Scientific (Waltham, MA, USA). TMB stop buffer was purchased from GenDEPOT (Katy, TX, USA). Mouse anti‐SARS‐CoV‐2 nucleocapsid protein monoclonal antibody clone 0659 (CTBT‐CS075) (capture antibody) and mouse anti‐SARS‐CoV‐2 nucleocapsid protein monoclonal antibody clone 0658 (CTBT‐CS076) (detection antibody) were purchased from Creative Diagnostics (Shirley, NY, USA). SARS‐CoV‐2 lysate was provided by the Korea Research Institute of Bioscience and Biotechnology (KRIBB). Anti‐mouse IgG (whole molecule)‐peroxidase antibodies were produced in rabbits. Ultrapure water (18 MW/cm) used in this work was obtained from a Milli‐Q water purification system (Billerica, MA, USA).
Preparation of four different Au nanoparticles
HAuNSs were synthesized from HAuNPs. First, 500 μl of 40 nm HAuNPs was added to 10 ml of 0.25 mM HAuCl4 solution in a glass vial under moderate stirring (500 rpm) and then 100 μl of 2 mM AgNO3 and 50 μl of 100 mM AA were simultaneously added to the mixture at 25 °C. Second, the solution was continuously stirred for 30 s as it turned from purple to blue. Finally, the prepared HAuNSs were re‐dispersed in water for further use. HAuNPs were prepared using a previously reported method. 26 AuNPs and AuNSs were synthesized according to the seeding‐mediated growth method. 27 , 28
Preparation of detection antibody‐conjugated SERS nanotags
Nucleocapsid protein antibody‐conjugated SERS nanotags were prepared using a previously reported method. 18 Briefly, 10 μl of 10−5 M MGITC was added to 1.0 ml of HAuNS solution under constant stirring (500 rpm). After 30 min, 60 μl of 10 μM HS‐PEG‐COOH was added to the MGITC‐labeled HAuNS solution under vigorous stirring. After 30 min, 120 μl of freshly prepared 10 μM HS‐PEG solution (blocking agent) was added to the PEGylated HAuNSs. After 3 h, the PEGylated HAuNSs were washed twice with 10 mM PBS buffer (pH 7.2). To activate the —COOH terminal groups on the surface of HAuNSs, 5 μl of 25 mM EDC and 5 μl of 25 mM NHS were added sequentially. After 30 min, the excess EDC/NHS was washed twice using a 10 mM PBS buffer solution. The NHS‐activated HAuNSs were incubated overnight at 4 °C with 1 μl of 0.1 mg/ml antibodies for detecting nucleoprotein. Approximately 100 μl of 1% (w/v) BSA aqueous solution was added to block any unbound surface area. The mixture was shaken for an additional 30 min and centrifuged at 4000 rpm for 10 min to remove unbound proteins. After discarding the supernatant, the SERS nanotags were re‐dispersed in 10 mM PBS buffer.
Preparation of capture antibody‐conjugated magnetic beads
The conjugation method of nucleocapsid protein capture antibodies on the surface of magnetic beads has been reported previously. 18 In brief, 200 μl of 0.5 mg/ml carboxylated magnetic beads were prepared using 15 mM MES buffer (pH 6). After washing three times with MES buffer, the solution was incubated with 2.5 μl of 0.1 M EDC and 2.5 μl of 0.1 M NHS for 30 min, followed by three washes with MES buffer. The beads were then incubated overnight at 4 °C with 5 μl of 1 mg/ml nuclear protein capture antibodies. After washing three times with PBS buffer, 20 μl of 1% (w/v) BSA aqueous solution was added for 30 min. The unreacted reagents were removed by washing three times with MES buffer. Finally, the antibody‐conjugated magnetic beads were stored in 10 mM PBS buffer at 4 °C until further use.
SERS‐based immunoassay of SARS‐CoV‐2 lysate
First, 20 μl of eight different concentrations of SARS‐CoV‐2 lysate in the range of 0–104 PFU/ml was mixed with 20 μl of antibody‐conjugated magnetic beads for 30 min under continuous stirring. Then, 20 μl of SERS nanotags was added and reacted for 1 h. The mixture was washed three times with 10 mM poly(butylene succinate‐co‐butylene terephthalate) (PBST), and the generated immunocomplexes were resuspended in 10 mM PBS. Finally, the washed immunocomplexes were transferred to a capillary tube for the Raman measurements.
Enzyme‐linked Immunosorbent assay of SARS‐CoV‐2 lysates
One hundred microliters of nucleocapsid protein capture antibodies (2 μg/ml) in Na2CO3–NaHCO3 buffer (pH 9.6) were immobilized on the surface of a 96‐well plate and incubated overnight at 4 °C. The wells were blocked with 200 μl of 10 mM PBS containing 1% BSA to reduce nonspecific binding. After 2 h, 100 μl of SARS‐CoV‐2 lysate in the range of 0–103 PFU/ml was added to each well and incubated for 2 h. Horseradish peroxidase (HRP)‐linked nucleocapsid protein detection antibodies were sequentially added and incubated for 2 h. TMB solution was added to induce the TMB‐HRP enzymatic reaction. TMB stop buffer was added to terminate the reaction, and absorbance was measured at 450 nm. In this experiment, 200 μl of 10 mM PBST containing 0.05% (v/v) Tween‐20 was used for washing.
Instrumentation
UV–visible absorption spectra were measured using a Synergy H1 Hybrid Multi‐Mode Reader (BioTek, Winooski, VT, USA). Dynamic light scattering (DLS) data were obtained using a Nano‐ZS90 apparatus (Malvern Instruments, Malvern, UK). Raman measurements were performed using an inVia Renishaw Raman microscope system (Renishaw, New Mills, UK).
RESULTS AND DISCUSSION
Figure 1 shows a schematic illustration of the synthetic process of HAuNSs and the results of their characterization. As shown in Figure 1a, HAuNPs were synthesized in the same manner as reported previously. 18 Briefly, cobalt nanoparticles were synthesized by reducing CoCl2 under N2 purging conditions. When these nanoparticles react with HAuCl4, Au atoms are nucleated on the cobalt nanoparticle surface and grow to form an Au shell. The thickness of the Au shell can be controlled by changing the concentration of HAuCl4. The cobalt was removed through a pinhole on the Au nanoshell when the solution was exposed to ambient conditions with O2. As a result, a hollow interior was formed. At this time, the color of the solution changed from red to dark blue. The HAuNP surface was then treated with AgNO3 to further enhance the localized surface plasmon effects. Then, star‐shaped HAuNSs were formed through the gold seeding process. Here, Ag ions were deposited at a low potential on a specific crystal face of HAuNPs and induced Au seeding to other crystal facets except for the Ag‐deposited areas, facilitating star‐shaped anisotropic growth on the Au hollow surface. These HAuNSs show substantial plasmonic enhancement owing to the star‐shaped nanogaps formed on the particle surface. Furthermore, Raman reporters and biological receptors can be favorably immobilized on the surface, making them suitable for biomedical applications as SERS nanotags because surfactants are not used in the HAuNS formation process. Figure 1b–d shows the transmission electron microscopy (TEM) images of HAuNSs measured at various magnifications, size distribution measured by DLS, and the UV–Vis spectrum. As shown in these data, HAuNSs showed a uniform anisotropic shape and homogeneous particle‐size distribution.
FIGURE 1.
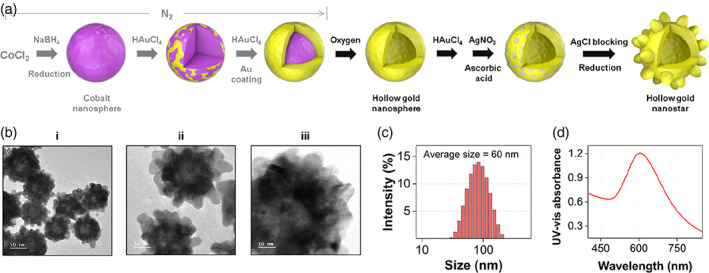
(a) Schematic illustration of the synthetic process of hollow Au nanostars (HAuNSs). (b) Transmission electron microscopy images of HAuNSs measured at different magnifications: (i) 50 nm, (ii) 20 nm, and (iii) 10 nm. (c) Dynamic light scattering distributions of HAuNSs. (d) UV–Vis spectrum of HAuNSs
Figure 2a shows the TEM images of the synthesized AuNPs, HAuNPs, AuNSs, and HAuNSs and the color of the corresponding colloidal solution. The TEM images indicated that each Au nanoparticle was synthesized with a uniform size. The colors of the solutions are red for AuNPs and dark blue for the other three Au nanoparticles (Figure 2b). Changes in color and UV–Vis absorption spectra were observed when the final NaCl concentration of each colloidal solution was increased to 75 mM. Except for AuNPs, no change in color or UV–Vis spectra was observed. In the case of AuNPs, the particles aggregated in the solution when NaCl was added. Consequently, the color changed to colorless due to electrostatic interaction between sodium ions and nanoparticles, which induced a change in the absorption band intensity in the UV–Vis spectra. In the case of the remaining three colloidal solutions, as shown in the zeta‐potential measurements in Figure 2c, the particle surface shows large negative potential values so that sufficient repulsions are maintained between the particles, thus preventing aggregation and maintaining stability.
FIGURE 2.
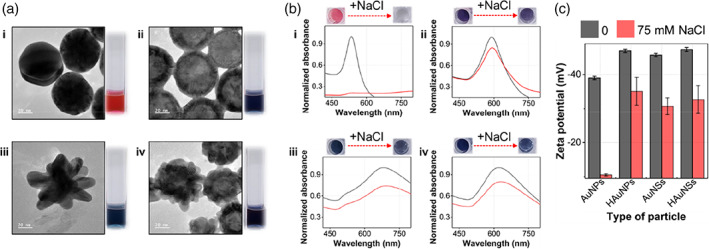
(a) Transmission electron microscopy images of (i) gold nanoparticles, (ii) hollow gold nanoparticles, (iii) gold nanostars, and (iv) hollow Au nanostars and photographs of the corresponding colloidal solutions. (b) Change in color and UV–Vis spectra when the final NaCl concentration of each colloidal solution was increased from 0 to 75 mM. (c) Zeta potential measurement data for four different Au nanoparticles incubated with 0 mM (black) and 75 mM (red) NaCl solutions
Figure 3a shows the Raman spectra of the Raman reporter MGITC for four different Au nanoparticles. Figure 3b shows that HAuNS exhibits the most significant plasmonic coupling effect when comparing the characteristic Raman peak intensity of MGITC at 1615 cm−1. Finite‐difference time‐domain (FDTD) simulations were performed on four single particles to identify the physical origin of their enhancement effects. As shown in Figure 3c, AuNS and HAuNS show a much higher simulated electric field intensity ratio than that of the AuNP and HAuNP when a linearly polarized light with a wavelength of 633 nm was used for irradiation. This enhancement occurs due to a significant increase in the electric field intensity around the sharp tips formed on the surface, suggesting that plasmonic coupling effects are enhanced. Further, AuNS has a slightly larger electric field intensity than that of HAuNS in the FDTD simulation (Figure 3c), whereas HAuNS shows a stronger Raman peak intensity, as shown in Figure 3b. This is because the localized surface plasmon effects through the pinholes formed on the surfaces of the hollow particles further enhance the SERS signals in HAuNS. Therefore, we selected HAuNSs as highly sensitive SERS nanotags based on the SERS measurements and FDTD simulation results with regard to the plasmonic coupling effects.
FIGURE 3.

(a) Surface‐enhanced Raman scattering spectra of malachite green isothiocyanate, (b) corresponding Raman peak intensities at 1615 cm−1, and (c) electric field intensity ratios using finite‐difference time‐domain simulations for (i) gold nanoparticles, (ii) hollow gold nanoparticles, (iii) gold nanostars, and (iv) hollow Au nanostars. The scale bar on the right shows the color decoding scheme for the ratio of the local field (|Eloc|) and external field (|E0|)
Figure 4 shows the results of the bio‐conjugation process and characterization of antibody‐conjugated particles. Figure 4a(i) shows the fabrication process of the nucleocapsid protein detection antibody‐conjugated SERS nanotag. Raman reporter MGITCs were adsorbed onto the particle surface by electrostatic interaction and capture antibodies were then immobilized on the HAuNS surface using the NHS/EDC coupling method. The remaining area of the HAuNS surface was blocked using BSA to prevent nonspecific binding. In the same way, capture antibodies were immobilized on the surface of magnetic beads by NHS/EDC coupling, as shown in Figure 4a(ii). When the antibodies were conjugated onto HAuNS, the average particle size increased by approximately 20 nm (Figure 4b). The absorption maximum in the UV–Vis spectra also shifted to a longer wavelength (Figure 4c). Therefore, we confirmed that the detection antibodies were successfully immobilized on the surface of the SERS nanotag. The immobilization of capture antibodies on the magnetic beads was confirmed using an HRP‐labeled secondary antibody (Figure 4d). After binding the HRP‐labeled secondary antibody to the capture antibody immobilized on the magnetic beads in the same manner as in ELISA, the color turned yellow by enzyme catalysis. Thus, we confirmed that the capture antibodies were successfully immobilized on the magnetic bead surface.
FIGURE 4.
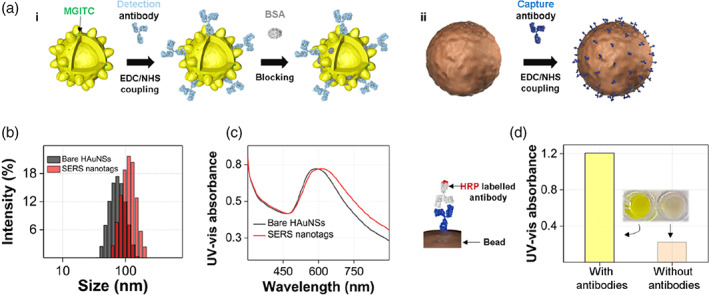
(a) (i) Sequential process for fabricating a surface‐enhanced Raman scattering (SERS) nanotag and (ii) antibody immobilization on the surface of a magnetic bead. (b) Dynamic light scattering distributions of hollow Au nanostars (HAuNS; black) and SERS nanotags (red). (c) UV–Vis absorption spectra for HAuNSs (black) and SERS nanotags (red). (d) Identification of antibodies immobilized on the surface of magnetic beads using horseradish peroxidase‐labeled secondary antibodies. UV–Vis measurement data of antibody‐immobilized magnetic beads (left) and bare magmatic beads (right)
Figure 5 shows the sequential assay of SARS‐CoV‐2 lysate using the prepared detection antibody‐conjugated SERS nanotags and capture antibody‐immobilized magnetic beads. When the SARS‐CoV‐2 lysate is added to the magnetic bead solution, only the nucleocapsid protein among the SARS‐CoV‐2 lysate components is selectively bound to the magnetic bead surface through antibody–antigen interaction, as shown in Figure 5a. Additionally, when antibody‐conjugated SERS nanotags are added to the microtube, they bind to the target proteins to form sandwich immunocomplexes. Subsequently, the immunocomplexes formed on the magnetic bead surface were captured using a magnetic bar and then washed two to three times with buffer to remove nonspecific binding species contained in the supernatant solution. Then, the magnetic beads were re‐dispersed in the buffer solution. Finally, a part of this solution was transferred to a capillary tube, and the SERS signal was measured. In this study, the assay was performed using SARS‐CoV‐2 lysate to maintain an environment similar to that of an actual clinical condition. Figure 5b shows a schematic illustration of the structure of the SARS‐CoV‐2 lysate containing various biological components. The spike proteins expressed on the surface of the virus bind to the angiotensin‐converting enzyme 2 (ACE2) receptors on the surface of human cells and enter the cell. However, as the nucleocapsid protein inside the virus constitutes the most considerable amount, we used it as a protein biomarker in this study. Most of the commercially available SARS‐CoV‐2 rapid kits also use the nucleocapsid protein as a target marker. Figure 5c shows TEM images of magnetic bead immunocomplexes in the presence and absence of the SARS‐CoV‐2 lysate. Here, we found that the SERS nanotags were bound to the magnetic bead surface only when the target was present and that the SERS signal was observed only in this case
FIGURE 5.
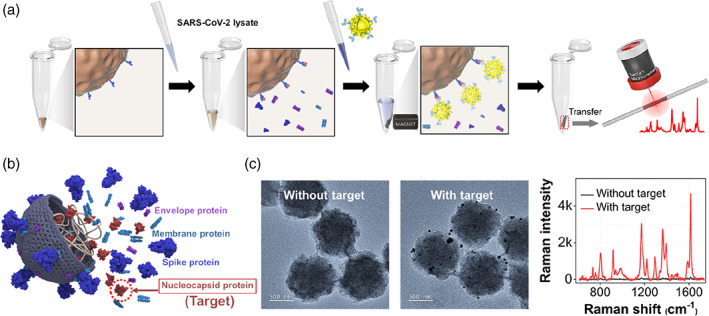
(a) Schematic illustration for the surface‐enhanced Raman scattering‐based immunoassay of severe acute respiratory syndrome coronavirus 2 (SARS‐CoV‐2) lysate using magnetic beads. (b) The structure of SARS‐CoV‐2 lysate containing various biological components. (c) Transmission electron microscopy images of magnetic immunocomplexes in the absence (left) and presence (right) of 102 PFU/ml of SARS‐CoV‐2‐lysate and the corresponding Raman spectra
Figure 6 compares the ELISA (a) and SERS (b) assay results for the SARS‐CoV‐2 lysate. The SARS‐CoV‐2 concentration was in the range of 0–103 PFU/ml in the ELISA. The SERS assay was performed in the range of 0–104 PFU/ml. Both assay results showed a good correlation with R 2 = 0.99, and the limit of detection (LOD) value was determined to be 43.2 PFU/ml for ELISA and 5.1 PFU/ml for the SERS assay. According to a previous report, a commercialized immunochromatographic rapid kit has an LOD of 300–500 PFU/ml. This magnetic bead‐based SERS assay for SARS‐CoV‐2 lysate is estimated to show a sensitivity that is two and one orders of magnitude higher than that of the rapid kit and ELISA methods, respectively. Therefore, this method is considered a new immunoassay technology that can overcome the sensitivity limit of the currently commercialized immunodiagnostic kit. Further, this SERS‐based immunoassay technique has the potential to solve the problem of false‐negative diagnoses in early‐stage infected or asymptomatic patients.
FIGURE 6.

(a) Results of the enzyme‐linked immunosorbent assay (ELISA) and surface‐enhanced Raman scattering (SERS)‐based assay for severe acute respiratory syndrome coronavirus 2 lysate. (a) (i) ELISA results using a 96‐well plate and (ii) corresponding calibration curve in the range of 0–103 PFU/ml. (b) SERS spectra and (ii) corresponding calibration curve in the range of 0–104 PFU/ml. Error bars indicate standard deviations of five measurements
CONCLUSION
In this study, a new magnetic bead‐based SERS assay platform was developed to overcome the sensitivity limit of the commercially available SARS‐CoV‐2 immunodiagnostic kits. HAuNSs, capable of realizing reproducible and sensitive localized surface plasmon coupling effects at the single‐particle level, were synthesized and used as SERS nanotags for the assays. Magnetic beads were used as substrates for immobilizing the nucleocapsid protein immunocomplexes. The SARS‐CoV‐2 lysate was used as an assay target instead of a pure nucleocapsid protein to implement an environment similar to the clinical conditions for actual diagnosis. The assay could be performed in a wide dynamic range with virus concentrations ranging from 0 to 104 PFU/ml and showed an LOD value of 5.1 PFU/ml using this platform. Compared to the LOD of the commercial rapid kit (300–500 PFU/ml) and the LOD of the ELISA (43 PFU/ml), this SERS assay platform has a very low LOD. Thus, it is expected to have high diagnostic accuracy and low probability of false‐negative diagnosis. To evaluate the clinical efficacy of this assay platform, comparison and analysis of the assay experiments and RT‐PCR results on clinical samples are currently in progress. This assay protocol is thus expected to provide a novel virus assay platform that can improve the accuracy and speed of SARS‐CoV‐2 diagnosis.
CONFLICT OF INTEREST
The authors declare no conflict of interest.
ACKNOWLEDGMENTS
This research was supported by the Chung‐Ang University Young Scientist Scholarship (CAYSS) in 2019. The National Research Foundation of Korea also supported this work (grant number 2019R1A2C3004375). This work was also supported by the KRIBB Research Initiative Program (1711134081).
Yu Q., Wu Y., Kang T., Choo J., Bull. Korean Chem. Soc 2021, 42(12), 1699. 10.1002/bkcs.12418
Qian Yu and Yixuan Wu contributed equally to this work.
Funding information KRIBB, Grant/Award Number: 1711134081; National Research Foundation of Korea, Grant/Award Number: 2019R1A2C3004375; Chung‐Ang University Young Scientist Scholarship
Contributor Information
Taejoon Kang, Email: kangtaejoon@kribb.re.kr.
Jaebum Choo, Email: jbchoo@cau.ac.kr.
REFERENCES
- 1. He X., Lau E. H. Y., Wu P., Deng X., Wang J., Hao X., Lau Y. C., Wong J. Y., Guan Y., Tan X., Mo X., Chen Y., Liao B., Chen W., Hu F., Zhang Q., Zhong M., Wu Y., Zhao L., Zhang F., Cowling B. J., Li F., Leung G. M., Nat. Med. 2020, 26, 672. [DOI] [PubMed] [Google Scholar]
- 2. Zhu N., Zhang D., Wang W., Li X., Yang B., Song J., Zhao X., Huang B., Shi W., Lu R., Niu P., Zhan F., Ma X., Wang D., Xu W., Wu G., Gao G. F., Tan W., N. Engl. J. Med. 2019, 382, 727. [DOI] [PMC free article] [PubMed] [Google Scholar]
- 3. Lee E. C., Wadsa N. I., Grabowski M. K., Gurley E. S., Lessler J., Science 2020, 370, 406. [DOI] [PubMed] [Google Scholar]
- 4. Chen J., Wang R., Wang M., Wei G.–. W., J. Mol. Biol. 2020, 432, 5212. [DOI] [PMC free article] [PubMed] [Google Scholar]
- 5. Li Q., Wu J., Nie J., Zhang L., Hao H., Liu S., Zhao C., Zhang Q., Liu H., Nie L., Qin H., Wang M., Lu O., Li X., Sun Q., Liu J., Zhang L., Li X., Huang W., Wang Y., Cell 2020, 182, 1284. [DOI] [PMC free article] [PubMed] [Google Scholar]
- 6. van Dorp L., Richard D., Tan C. C. S., Shaw L. P., Acman M., Balloux F., Nat. Commun. 2020, 11, 5986. [DOI] [PMC free article] [PubMed] [Google Scholar]
- 7. Ravi N., Cortade D. L., Ng E., Wang S. X., Biosens. Bioelectron. 2020, 165, 112454. [DOI] [PMC free article] [PubMed] [Google Scholar]
- 8. Wang M., Fu A., Hu B., Tong Y., Liu R., Liu Z., Gu J., Xiang B., Liu J., Jiang W., Shen G., Zhao W., Men D., Deng Z., Yu L., Wei W., Li Y., Liu T., Small 2020, 16, 2002169. [DOI] [PMC free article] [PubMed] [Google Scholar]
- 9. Mutesa L., Ndishimye P., Butera Y., Souopgui J., Uwineza A., Rutayisire R., Ndoricimpaye E. L., Musoni E., Rujeni N., Nyatanyi T., Ntagwabira E., Semakula M., Musanabaganwa C., Nyamwasa D., Ndashimye M., Ujeneza E., Mwikarago I. E., Muvunyi C. M., Mazarati J. B., Nsanzimana S., Turok N., Ndifon W., Nature 2021, 589, 276. [DOI] [PubMed] [Google Scholar]
- 10. Smyrlaki I., Ekman M., Lentini A., de Sousa N. R., Papanicolaou N., Vondracek M., Aarum J., Safari H., Muradrasoli S., Rothfuchs A. G., Albert J., Hoegberg B., Reinius B., Nat. Commun 2020, 11, 4812. [DOI] [PMC free article] [PubMed] [Google Scholar]
- 11. Li Y., Yao L., Li J., Chen L., Song Y., Cai Z., Yang C., J. Med. Virol. 2020, 92, 903. [DOI] [PMC free article] [PubMed] [Google Scholar]
- 12. Wang X., Yao H., Xu X., Zhang P., Zhang M., Shao J., Xiao Y., Wang H., Clin. Chem. 2020, 66, 977. [DOI] [PMC free article] [PubMed] [Google Scholar]
- 13. Infantino M., Grossi V., Lari B., Bambi R., Perri A., Manneschi M., Terenzi G., Liotti I., Ciotta G., Taddei C., Benucci M., Casprini P., Veneziani F., Fabbri S., Pompetti A., Manfredi M., J. Med. Virol. 2020, 92, 1671. [DOI] [PMC free article] [PubMed] [Google Scholar]
- 14. Bulilete O., Lorente P., Leiva A., Carandell E., Oliver A., Rojo E., Pericas P., Llobera J., J. Infect. 2021, 82, 391. [DOI] [PMC free article] [PubMed] [Google Scholar]
- 15. Alafeef M., Dighe K., Moitra P., Pan D., ACS Nano 2020, 14, 17028. [DOI] [PMC free article] [PubMed] [Google Scholar]
- 16. Kim K., Kashefi‐Kheyrabadi L., Joung Y., Kim K., Dang H., Chavan S. G., Lee M.–. H., Choo J., Sens. Actuat. B 2021, 329, 129214. [DOI] [PMC free article] [PubMed] [Google Scholar]
- 17. Yoon J., Choi N., Ko J., Kim K., Lee S., Choo J., Biosens. Bioelectron. 2013, 42, 62. [DOI] [PubMed] [Google Scholar]
- 18. Chon H., Lee S., Yoon S.–. Y., Chang S.–. I., Lim D. W., Choo J., Chem. Commun 2011, 47, 12515. [DOI] [PubMed] [Google Scholar]
- 19. Chon H., Lee S., Son S. W., Oh C. H., Choo J., Anal. Chem. 2009, 81, 3029. [DOI] [PubMed] [Google Scholar]
- 20. Kim K. Y., Choi N. H., Jeon J. H., Rhie G. E., Choo J., Sensors 2019, 19, 4081. [DOI] [PMC free article] [PubMed] [Google Scholar]
- 21. Zimmermann C., Feldmann C., Wanner M., Gerthsen D., Small 2007, 3, 1347. [DOI] [PubMed] [Google Scholar]
- 22. Chandra M., Dowgiallo A.–. M., Knappenberger K. L., J. Am. Chem. Soc 2010, 132, 15782. [DOI] [PubMed] [Google Scholar]
- 23. Dondapati S. K., Sau T. K., Hrelescu C., Klar T. A., Stefani F. D., Feldmann J., ACS Nnao 2010, 4, 6318. [DOI] [PubMed] [Google Scholar]
- 24. Chirea M., Collins S. S. E., Wei X., Mulvaney P., J. Phys. Chem. Lett. 2014, 5, 4331. [DOI] [PubMed] [Google Scholar]
- 25. Garcia‐Leis A., Torreggiani A., Garcia‐Ramosa J. V., Sanchez‐Cortes S., Nanoscale 2015, 7, 13629. [DOI] [PubMed] [Google Scholar]
- 26. Schwartzberg A. M., Oshiro T. Y., Zhang J. Z., Huser T., Talley C. E., Anal. Chem. 2006, 78, 4732. [DOI] [PubMed] [Google Scholar]
- 27. Bastus N. G., Comenge J., Puntes V., Langmuir 2011, 27, 11098. [DOI] [PubMed] [Google Scholar]
- 28. Yuan H. K., Khoury C. G., Hwang H. J., Wilson C. M., Grant G. A., VoDinh T., Nanotechnol. 2012, 23, 075102. [DOI] [PMC free article] [PubMed] [Google Scholar]


