

PEER REVIEW
The peer review history for this article is available at https://publons.com/publon/10.1111/dom.14547.
1. BACKGROUND
Type 2 diabetes (T2D) is associated with an increased risk of infection‐related morbidity and mortality. 1 Accordingly, coronavirus disease 2019 (COVID‐19) results in increased hospitalization rates and illness severity in people with T2D. 2 Moreover, poor glycaemic control worsens patients’ prognosis with COVID‐19, raising the risk of mechanical ventilation, shock, and multiple organ failure necessitating ICU treatment. 3 Thus, the absolute burden of infection attributable to poor glycaemic control in this population would be substantial. This association may be explained by the degree of poor glycaemic control, which may be correlated to the worsening of cell‐mediated immunity. 3 Although a normal humoral response against severe acute respiratory syndrome coronavirus (SARS‐CoV‐2) has been evidenced in T2D patients, 4 previous studies have shown that dysregulation of the cellular immune response, especially T lymphocytes, might be highly involved in the pathological process of COVID‐19. 5 Although no significant difference was observed in total lymphocyte count or lymphopenia incidence between patients with T2D and those without diabetes, distinguishable differences in the subpopulations of lymphocytes have been observed. 7 The sustained decrease in total T cells and Th and Tc subsets and NK subsets were all more remarkable in people with T2D than in those without diabetes. 6 Therefore, T2D may hamper the immune responses after vaccination against SARS‐CoV2.
Previous studies have shown that individuals with diabetes had a consistently lower immunological response to the hepatitis B vaccine, 7 while less consistent results were noted for influenza and varicella‐zoster vaccines. 8 In this context, evaluating SARS‐CoV‐2 vaccine efficacy is critical to reducing the morbidity and mortality associated with COVID‐19 in this vulnerable population. Testing vaccines that prevent infection with SARS‐CoV‐2 in T2D populations with poorly controlled glycaemia, therefore, is important because increased incidences of illness and death from COVID‐19 have been associated with hyperglycaemia. Two doses of 30 μg BNT162b (Pfizer‐BioNtech) elicited similar binding‐antibody responses in people with or without T2D. 9 However, there are no data on neutralizing antibodies and cell‐mediated response to BNT162b vaccine in T2D patients, nor data on the immunological vaccine responses related to glycaemic control. 10 The aim of the present study, therefore, was to evaluate cell‐mediated response to the COVID‐19 vaccine with regard to diabetic status and glycaemic control.
2. METHODS
2.1. Study design and participants
We conducted a prospective observational study at vaccination sites in Campania, Italy. A total of 1123 adults, without previous COVID‐19 or SARS‐CoV‐2 asymptomatic status, were screened from December 2020 (Supplementary Figure S1). Details of the study design and participant characteristics are provided in the Supplementary Methods and Supplementary Table S1.
2.2. Laboratory analysis
Plasma glucose, creatinine, and serum lipids were measured using enzymatic assays in the hospital's Chemistry Department (Supplementary Methods).
2.3. Assessment of neutralizing antibody responses
To determine the immune status of SARS‐CoV‐2‐vaccinated subjects, a GenScript SARS‐CoV‐2 Surrogate Virus Neutralization Test (sVNT; cat. no.: L00847‐5) was used for neutralizing antibody evaluation. The assay is a blocking ELISA, which mimics this virus receptor‐binding process, so that the neutralization capacity of anti‐SARS‐CoV‐2 antibodies directed against the receptor‐binding domain can be measured (Supplementary Methods).
2.4. Assessment of T‐cell responses
2.4.1. Peripheral blood mononuclear cell isolation
Isolation of peripheral blood mononuclear cells was performed as previously described 14 (Supplementary Methods).
2.5. Statistical analysis and endpoints
Continuous variables are summarized as mean and standard deviation, and categorical variables as absolute and relative frequencies. For continuous variables, the differences among the groups were evaluated using Student's t‐test or analysis of variance (ANOVA) for normally distributed data and the Kruskal‐Wallis test for non‐normally distributed data. When differences were found among the groups, Bonferroni correction was used to make pairwise comparisons. The chi‐squared test was used to compare categorical variables. Normality of distribution was tested with the Shapiro‐Wilk test.
Repeated‐measures ANOVA was used for comparison of neutralizing antibodies at 21 and 52 days. Regression analysis was performed to estimate the relationships among baseline glycated haemoglobin (HbA1c) levels and immunological response 21 days after the second dose. P values ≤ 0.05 were taken to indicate statistical significance. All calculations were performed using SPSS 23 software (SPSS Inc, Chicago, Illinois).
2.5.1. Endpoints
The primary endpoint of the study was to assess neutralizing antibody and T‐cell responses in participants with and without diabetes. The secondary endpoint was to assess neutralizing antibody and T‐cell responses in diabetes patients with good and poor glycaemic control.
2.5.2. Sample size
The sample size required to evaluate the humoral and cellular immune response in participants with and without diabetes was determined. Using a Student's t‐test for independent samples, it was calculated that a sample of 210 participants (70 in each group) would have 90% power to assess an effect size of 0.45 with an alpha error of 5%.
3. RESULTS
3.1. Patients
For study eligibility, we assessed individuals aged 18 to 60 years (healthcare and educator active workers) involved in the Campania vaccination programme from December 2020. The PROBE diagram study (Supplementary Figure S1) showed that we screened 1123 subjects on vaccination day based on exclusion criteria. The study population comprised: participants without diabetes, n = 277; T2D patients with good glycaemic control, n = 109; and T2D patients with poor glycaemic control, n = 92 (Supplementary Figure S1). Based on clinical evaluation, laboratory analysis, and HbA1c values, the participants were divided into three groups: those without diabetes (HbA1c 33 ± 1.9 mmol/mol), n = 327; those with T2D with good glycaemic control (HbA1c 48 ± 1.7 mmol/mol), n = 134; and those with T2D with poor glycaemic control (HbA1c 65 ± 2.1 mmol/mol), n = 117. According to Standards of Medical Care in Diabetes 2021, 11 antidiabetes therapy was implemented in participants with poor glycaemic control as follows: basal insulins in 11 patients, the prandial insulin in 10 patients, metformin in 37 patients, incretins in 28 patients, and sodium‐glucose cotransporter‐2 inhibitors in six patients. On Day 52 after the first vaccination dose, 57 participants with poor glycaemic control at baseline (HbA1c 8.1% ± 0.7%) had achieved good glycaemic control (HbA1c 6.6% ± 0.4%). However, 35 participants with poor glycaemic control at baseline (HbA1c 8.2% ± 0.8%) did not achieve good glycaemic control (HbA1c 8.3% ± 1.1%). Participants with poor glycaemic control at baseline (according to HbA1c level on vaccination day) were divided into two groups based on HbA1c levels evaluated 52 days after the second vaccination dose.
3.2. Immunological responses 21 days after the second vaccination dose and HbA1c levels on vaccination day
The first follow‐up evaluation was conducted after 23.8 ± 4.8 days in participants without diabetes, after 23.6 ± 4.5 days in T2D patients with good glycaemic control, and after 24.6 ± 4.3 days in T2D patients with poor glycaemic control. To assess antibody response in non‐T2D and T2D patients, we performed a recently validated sVNT assay that detects circulating antibodies directed against the spike protein receptor‐binding domain (RBD), based on antibody‐mediated blockade of the interaction between the ACE2 receptor protein and the RBD. 12 This assay allowed analysis of in vitro neutralization activity and was used instead of more sophisticated methods that need to be performed under higher biosafety levels. The degree to which test plasma inhibited binding of the anti‐IgG‐horseradish peroxidase (HRP)‐RBD to ACE2 receptors, compared to control, was determined by optical density reading, with ≥20% inhibition defined as a positive response. We found a high specificity of 89.2% (95% confidence interval [CI] 86.9‐89.9) and a sensitivity of 70.3% (95% CI 64.9‐74.8) for the sVNT. Results showed that neutralizing responses were undetectable the day before vaccination (Figure 1A). By contrast, potent neutralization responses were observed in all the participants 21 days after the second dose of the vaccine; on Day 21 after the second vaccine dose, T2D patients with HbA1c >7% showed significantly reduced virus‐neutralizing antibody capacity than normoglycaemic subjects and T2D patients with good glycaemic control (P < 0.05).
FIGURE 1.
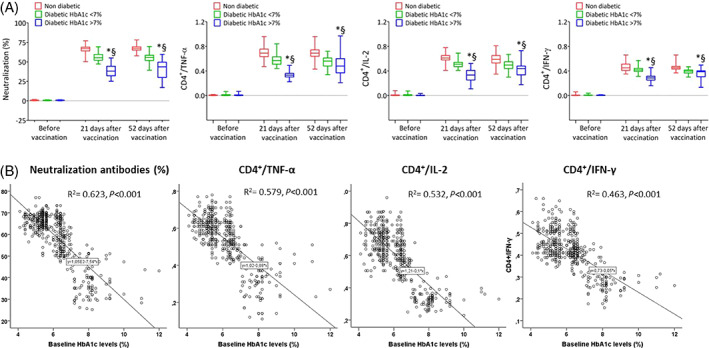
A, Neutralizing antibodies and CD4+ T cells producing tumour necrosis factor‐α (TNF‐α), interleukin‐2 (IL‐2) and interferon‐γ (IFNγ) in participants without diabetes, type 2 diabetes (T2D) patients with good glycaemic control, and T2D patients with poor glycaemic control on vaccination day, and 21 days and 52 days after the second vaccination dose (boxplots show the median, 25th, and 75th percentiles, range, and extreme values). *P < 0.05 vs. T2D with good glycaemic control group. §P < 0.05 vs nondiabetic group. B, Regression analysis between glycated haemoglobin (HbA1c) levels at baseline and mean of CD4+ T‐cell responses at 21 days after the second vaccine dose
Moreover, in response to S‐specific peptide pools, we observed a higher CD4+ T/cytokine response involving type 1 helper T cells in normoglycaemic participants and T2D patients with good glycaemic control than in T2D patients with poor glycaemic control (Figure 1A). Consistent with recent data, CD8+ T‐cell responses (interleukin [IL]‐4 and IL‐13) to SARS‐CoV‐2 Prot_S peptide pools were observed only at very low levels after the second vaccine dose among the study participants (data not shown). 13 Among the observed cytokine, the tumor necrosis factor α responses were greater than the interleukin‐2 and the interferon‐γ responses.
Interestingly, the mean percentage of neutralizing antibody and CD4+ T/cytokine responses between Days 21 and 52 after the second vaccine dose were inversely related to baseline HbA1c levels (Figure 1B). Therefore, to exclude bias related to the difference in immunological responses to mRNA and virus‐modified vaccines, we evaluated the virus‐neutralizing antibody and CD4 cytokine response involving type 1 helper T cells concerning vaccine type in all groups. As reported in Supplementary Figure S2, no differences among immunological responses induced by the different vaccines were found.
3.3. Immunological responses and HbA1c levels 52 days after the second vaccination dose
The final follow‐up evaluation was conducted after 52 ± 6 days in participants without diabetes, after 50 ± 4 days in T2D patients with good glycaemic control, and after 51 ± 5 days in T2D patients with poor glycaemic control. According to Standards of Medical Care in Diabetes 2021, 11 HbA1c levels were evaluated after 75 ± 4 days in patients without diabetes, 73 ± 5 days in T2D patients with good glycaemic control, and 73 ± 6 days in T2D patients with poor glycaemic control (Supplementary Table). Therefore, patients with poor glycaemic control at baseline (HbA1c on vaccination day) were divided into two groups based on the HbA1c levels evaluated 52 days after the second vaccination dose. At the final follow‐up evaluation, virus‐neutralizing antibodies and antigen‐specific CD4+ T‐cell responses remained higher in participants without diabetes and T2D patients with good glycaemic control than in T2D patients with poor glycaemic control (Figure 2). As shown in Figure 2, on Day 52 after the second vaccination dose, the 25th and 75th percentile ranges of virus‐neutralizing antibodies and antigen‐specific CD4+ T‐cell responses were much higher, suggesting extreme variability in immunological responses in T2D patients with poor baseline glycaemic control. In fact, 57 of the T2D patients with poor glycaemic control had HbA1c levels <7% (HbA1c 6.6% ± 0.4%) 52 days after the second vaccine dose. Remarkably, the virus‐neutralizing antibodies and antigen‐specific CD4+ T‐cell responses improved significantly compared to the responses observed 21 days after the second vaccine dose (Figure 2A). Interestingly, the HbA1c reduction of 1.5% ± 0.3% increased the neutralizing antibody titres and CD4 cytokine response by almost 15% (Figure 2B). Finally, 35 patients with poor glycaemic control at baseline (HbA1c 8.2% ± 0.8%) did not have good glycaemic control 52 days after the second vaccination dose (HbA1c 8.3% ± 1.1%). Interestingly, the virus‐neutralizing antibodies and antigen‐specific CD4‐cell responses remained impaired in these patients (Figure 2A). Finally, regression analysis showed that reduction of HbA1c levels 52 days after vaccination were associated with neutralizing antibody titres and CD4 cytokine increases (Figure 2B). There were no differences in the immunological responses induced by the different vaccines (data not shown).
FIGURE 2.
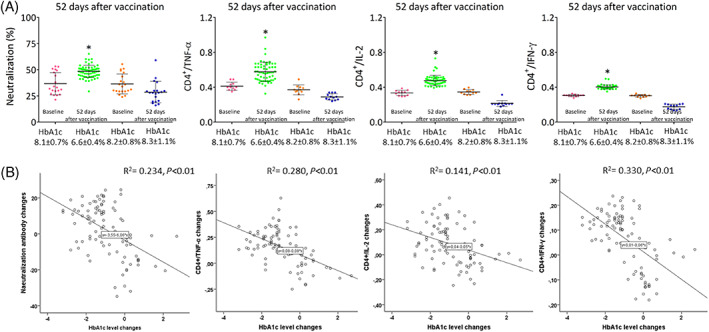
A, Neutralization antibodies and CD4+ T cells producing tumor necrosis factor‐α (TNF‐α), interleukin‐2 (IL‐2) and interferon‐γ (IFNγ) in type 2 diabetes (T2D) patients with poor glycaemic control at baseline (vaccination day) and with glycated haemoglobin (HbA1c) <7% (HbA1c 8.1 ± 0.7 to 6.6% ± 0.4%) and HbA1c >7% (HbA1c 8.2 ± 0.8 to 8.3% ± 1.1%) at follow‐up (52 days after the second vaccination dose). Boxplots show the median, 25th and 75th percentiles, range, and extreme values). *P < 0.05 vs. T2D patients with HbA1c <7% at follow‐up. B, Regression analysis of HbA1c level changes (vaccination day and 52 days after second vaccination dose) and CD4+ T‐cell response changes (21 and 52 days after the second vaccine dose)
4. DISCUSSION
To date, the immunological responses to COVID‐19 vaccines in T2D patients are poorly elucidated. In the present study, we evaluated whether diabetes and hyperglycaemia affect the ability to mount appropriate virus‐neutralizing antibodies and antigen‐specific CD4‐cell responses after administration of COVID‐19 vaccines. We observed that the COVID‐19 vaccines induced a weak immunity in T2D patients with poor glycaemic control compared with normoglycaemic individuals and T2D patients with good glycaemic control. At 21 days after the first vaccine dose, neutralizing antibody titres and CD4 cytokine responses involving type 1 helper T cells were lower in T2D patients with HbA1c levels >7% than in individuals with HbA1c levels ≤7%, evaluated at baseline before the first vaccine dose. Taken together, our data support the evidence of an efficient immunological response in T2D patients with good glycaemic control, as the prevalence of positivity for virus‐neutralizing antibodies and antigen‐specific CD4‐cell responses was similar, with regard to timing and titres, to that of patients without diabetes. We hypothesized that poor glycaemic control during the vaccination period might impair immunological responses. Previous studies showed that T2D is a chronic disease that leads to persistent immune dysregulation. 14 Whether hyperglycaemia modulates the antibody response to a viral infection is still a matter of discussion. 10 Several defects in immunity have been associated with hyperglycaemia and insulin resistance, including reduced lymphocyte proliferative response, impaired monocyte/macrophage, and neutrophil function, abnormal delayed‐type hypersensitivity reaction, and complement activation dysfunction. 15 Individuals with diabetes have a consistently decreased immunological response to the hepatitis B vaccine. 7 This immune impairment develops over time and begins prior to an individual showing clinical signs of these diseases. Clinically, T2D patients have an increased risk of significant morbidity and mortality from infections and sepsis. 16 Data from COVID‐19 patients with T2D showed conflicting results, evidencing both impaired cellular immunity and appropriate humoral response against SARS‐CoV‐2 infection. 5 These studies allow cautious optimism regarding adequate immunization in individuals with diabetes and the general population. However, these studies did not evaluate the virus‐neutralizing antibodies and antigen‐specific CD4‐cell responses to the SARS‐CoV‐2 infection with regard to glycaemic control in T2D patients. Hyperglycaemia‐inducing specific dysfunction of the virus‐neutralizing antibodies and adaptive immune response (including T cells) are thought to be responsible for immune system weakness against SARS‐COV‐2 vaccines. Accordingly, patients with T2D had a 1.3‐fold reduction in numbers of CD14+ monocytes, reflecting a 1.4‐fold decrease in the frequency of classic monocyte populations in hospitalized patients with SARS‐CoV‐2 infection. 17 Nevertheless, whether poor glycaemic control during the vaccination period may impair the efficacy and durability of protection against SARS‐COV‐2 infection should be evaluated prospectively in a large cohort. However, the observation that T2D patients initially with poor glycaemic control have improved immune responses when they achieve good glycaemic control indicates that strict glycaemic control during the vaccination period could play a pivotal role in vaccination success in T2D patients.
The results of this study should be interpreted in the context of some limitations. First, this was a single‐health system study, and the results should be put in the context of the totality of epidemiological data that have emerged and are emerging from other centres in Italy and globally. Second, the participants included in the study received several different vaccines. However, 231 of the participants (83.4%) received mRNA vaccines (mRNA‐BNT162b2 and mRNA‐1273 vaccine), and only 46 (16.6%) received a viral vector‐based vaccine (ChAdOx1‐S). Third, as previously reported, we evaluated the outcomes during the period of higher immunological responses for each SARS‐COV‐2 vaccine type. 18 As reported in Supplementary Figure 2, there were no differences in the immunological responses among the different SARS‐COV‐2 vaccines studied. Finally, the statistical significance of regression analysis between HbA1c changes and immunological responses is relatively low despite achieving statistical significance. Therefore, further studies are needed to confirm our observations. Nevertheless, our data may be helpful to consider the glycaemic control properly during the vaccination period.
In conclusion, our data highlight two critical points: first, hyperglycaemia at the time of vaccination worsens the immunological response and, second, achieving adequate glycaemic control during the post‐vaccination period improves the immunological response. Hence, we predict that stringent glycaemic control may restore the natural predisposal to a good immune response to the SARS‐CoV‐2 vaccine. Glycaemic control should therefore be the standard of care during pandemics, increasing the contribution of diabetologists to the success of vaccine programmes. In addition, we need to focus on hyperglycaemia which can play a role in clinical COVID‐19 outcomes and vaccine efficiency. The present study allows cautious optimism regarding adequate immunization in individuals with diabetes after COVID‐19 vaccines, suggesting that achievement of tight glycaemic control during the vaccination period normalizes natural protection against SARS‐CoV‐2.
Supporting information
Appendix S1. Supporting Information.
ACKNOWLEDGMENTS
Programmi di Ricerca Scientifica di Rilevante Interesse Nazionale (Scientific research programmes of high national interest) 2017. N=2017FM74HK_002. Open Access Funding provided by Universita degli Studi della Campania Luigi Vanvitelli within the CRUI‐CARE Agreement. [Correction added on 18 May 2022: CRUI‐CARE funding statement has been added.]
Marfella R, D'Onofrio N, Sardu C, et al. Does poor glycaemic control affect the immunogenicity of the COVID‐19 vaccination in patients with type 2 diabetes: The CAVEAT study. Diabetes Obes Metab. 2022;24(1):160-165. doi:10.1111/dom.14547
Raffaele Marfella and Nunzia D'Onofrio share first authorship.
Clinical Trials: NCT04746521 (observational study).
Funding information Programmi di Ricerca Scientifica di Rilevante Interesse Nazionale 2017., Grant/Award Number: N= 2017FM74HK_002
DATA AVAILABILITY STATEMENT
The data that support the findings of this study are available on request from the corresponding author. The data are not publicly available due to privacy or ethical restrictions.
REFERENCES
- 1. Pearson‐Stuttard J, Blundell S, Harris T, Cook DG, Critchley J. Diabetes and infection: assessing the association with glycaemic control in population‐based studies. Lancet Diabetes Endocrinol. 2016;4:148‐158. [DOI] [PubMed] [Google Scholar]
- 2. Sardu C, Gargiulo G, Esposito G, Paolisso G, Marfella R. Impact of diabetes mellitus on clinical outcomes in patients affected by Covid‐19. Cardiovasc Diabetol. 2020;19:76. [DOI] [PMC free article] [PubMed] [Google Scholar]
- 3. Sardu C, D'Onofrio N, Balestrieri ML, et al. Outcomes in patients with hyperglycemia affected by COVID‐19: can we do more on glycemic control? Diabetes Care. 2020;43:1408‐1415. [DOI] [PMC free article] [PubMed] [Google Scholar]
- 4. Lampasona V, Secchi M, Scavini M, et al. Antibody response to multiple antigens of SARS‐CoV‐2 in patients with diabetes: an observational cohort study. Diabetologia. 2020;63:2548‐2558. [DOI] [PMC free article] [PubMed] [Google Scholar]
- 5. Zhao R, Sun Y, Zhang Y, et al. Distinguishable immunologic characteristics of COVID‐19 patients with comorbid type 2 diabetes compared with nondiabetic individuals. Mediat Inflamm. 2020;2020:6914878. 10.1155/2020/6914878 [DOI] [PMC free article] [PubMed] [Google Scholar]
- 6. Taylor KR, Mills RE, Costanzo AE, Jameson JM. T cells are reduced and rendered unresponsive by hyperglycemia and chronic TNFalpha in mouse models of obesity and metabolic disease. PLoS One. 2010;5:e11422. [DOI] [PMC free article] [PubMed] [Google Scholar]
- 7. Napoli C, Benincasa G, Criscuolo C, Faenza M, Liberato C, Rusciano M. Immune reactivity during COVID‐19: implications for treatment. Immunol Lett. 2021;231:28‐34. [DOI] [PMC free article] [PubMed] [Google Scholar]
- 8. Schillie SF, Spradling PR, Murphy TV. Immune response of hepatitis B vaccine among persons with diabetes: a systematic review of the literature. Diabetes Care. 2012;35:2690‐2697. [DOI] [PMC free article] [PubMed] [Google Scholar]
- 9. dos Santos G, Tahrat H, Bekkat‐Berkani R. Immunogenicity, safety, and effectiveness of seasonal influenza vaccination in patients with diabetes mellitus: a systematic review. Hum Vaccin Immunother. 2018;14:1853‐1866. [DOI] [PMC free article] [PubMed] [Google Scholar]
- 10. Ceriello A. Diabetes, SARS‐CoV‐2/COVID‐19 vaccines and glycemic control: call for data. Diabetes Res Clin Pract. 2021;174:108741. 10.1016/j.diabres.2021.108741 [DOI] [PMC free article] [PubMed] [Google Scholar]
- 11. American Diabetes Association Classification and Diagnosis of Diabetes . Standards of medical care in diabetes‐2020. Diabetes Care. 2020;43(suppl 1):S14‐S31. 10.2337/dc20-S002 [DOI] [PubMed] [Google Scholar]
- 12. Balestrieri ML, Servillo L, Esposito A, et al. Poor glycaemic control in type 2 diabetes patients reduces endothelial progenitor cell number by influencing SIRT1 signalling via platelet‐activating factor receptor activation. Diabetologia. 2013;56(1):162‐172. [DOI] [PubMed] [Google Scholar]
- 13. Anderson EJ, Rouphael NG, Widge AT, et al. Safety and immunogenicity of SARS‐CoV‐2 mRNA‐1273 vaccine in older adults. N Engl J Med. 2020;383:2427‐2438. [DOI] [PMC free article] [PubMed] [Google Scholar]
- 14. Tan CW, Chia WN, Qin X, et al. A SARS‐CoV‐2 surrogate virus neutralization test (sVNT) based on antibody mediated blockage of ACE2‐spike protein‐protein interaction. Nat Biotechnol. 2020;38(9):1073‐1078. 10.1038/s41587-020-0631-z [DOI] [PubMed] [Google Scholar]
- 15. Qiao YC, Shen J, He L, HongXZ TF, Pan YH, et al. Changes of regulatory T cells and of proinflammatory and immunosuppressive cytokines in patients with type 2 diabetes mellitus: a systematic review and meta‐analysis. J Diabetes Res. 2016;2016:3694957. 10.1155/2016/3694957 [DOI] [PMC free article] [PubMed] [Google Scholar]
- 16. Daryabor G, Atashzar MR, Kabelitz D, Meri S, Kalantar K. The effects of type 2 diabetes mellitus on organ metabolism and the immune system. Front Immunol. 2020;11:1582. [DOI] [PMC free article] [PubMed] [Google Scholar]
- 17. Alzaid F, Julla JB, Diedisheim M, et al. Monocytopenia, monocyte morphological anomalies and hyperinflammation characterise severe COVID‐19 in type 2 diabetes. EMBO Mol Med. 2020;12(10):e13038. [DOI] [PMC free article] [PubMed] [Google Scholar]
- 18. Polack FP, Thomas SJ, Kitchin N, et al. Safety and efficacy of the BNT162b2 mRNA Covid‐19 vaccine. N Engl J Med. 2020;383(27):2603‐2615. [DOI] [PMC free article] [PubMed] [Google Scholar]
Associated Data
This section collects any data citations, data availability statements, or supplementary materials included in this article.
Supplementary Materials
Appendix S1. Supporting Information.
Data Availability Statement
The data that support the findings of this study are available on request from the corresponding author. The data are not publicly available due to privacy or ethical restrictions.