

Abstract
Introduction
The COVID‐19 pandemic has resulted in lifestyle changes for children. The aim of this study was to evaluate the impact of the pandemic on weight/BMI in children with severe bleeding disorders.
Methods
We conducted a retrospective review of patients age 3–18 years with severe bleeding disorders on prophylactic therapy treated at SickKids Hospital (Toronto, Canada) between February 01, 2018 and March 31, 2021. We evaluated the following pre‐ and post‐COVID variables: weight (kg), weight percentile, BMI (kg/m2), BMI percentile, HJHS score, and prophylactic dosing (units/kg).
Results
One hundred and four patients were included in the final analysis. Diagnoses were as follows: haemophilia A (n = 92; 70.8%), haemophilia B (n = 17; 13.1%), type 3 von Willebrand disease (n = 11; 8.5%), the remainder were diagnosed with rare factor deficiencies. Median interval time from pre‐COVID measurements to latest follow‐up was 12.4 months (IQR 10.32–14.52 months) during which there was a statistically significant increase in median weight percentile +5.75 centiles (from 63rdcentile to 68.75thcentile). There was a statistically significant increase in mean BMI of +1.03 kg/m2(P = < .001) while median BMI percentile increased +8.82 centiles (from 53.9thcentile to 62.72ndcentile) and mean BMI percentile increased 3.42 centiles (from 57.5 centile to 60.9 centile). The group that gained the most weight centiles, BMI and BMI centiles were 5–14 years old.
Conclusion
There was a trend to weight gain over the study period. More long‐term data is required to evaluate the impact of this increase in weight and BMI on children with bleeding disorders.
Keywords: BMI, COVID‐19, haemophilia, severe bleeding disorder, weight gain
1. INTRODUCTION
The COVID‐19 pandemic has not only led to millions of deaths and countless hospitalizations globally, but it has also had profound effects on those who have not contracted the disease with tremendous disruptions to the daily routines of people around the world. 2 To reduce the transmission of COVID‐19, societies have endeavoured to reduce/limit contact between people; what has become referred to as “social distancing”, always maintaining 6 feet/2 m of distance between people. To socially distance, schools in many countries have been closed to in‐person learning with recreational and group sports halted in most jurisdictions.
While the direct impacts of COVID‐19 are still being understood, and social distancing for the most part is continuing, it is important to recognize the unintended and secondary effects including physical and psychological outcomes. Amongst the many unintended effects of the pandemic has been a trend to excess weight gain in children, including worsened metabolic parameters and an exacerbation of obesity 6 . Such weight gain is reflected in excessive (greater than expected with normal growth) increases in growth parameters such as weight, weight percentile, body mass index (BMI) and BMI percentile.
With respect to excessive weight gain in children during the COVID‐19 pandemic, the causes of this are likely to be divided into two themes: (1) reduced physical activity, and (2) increased consumption of food, particularly high caloric foods. Reduced physical activity in children has occurred secondary to decreased access and opportunity for engaging in physical activities. The closure of recreational facilities, gyms, and play‐spaces together with the physical closing of schools has led to a significant decrease in children's daily habitual activities (i.e., walking to/from school, unstructured play at the playground), as well as structured activities (i.e., gym class, organized team sports). Several papers have documented that out‐of‐school time leads to an increase in the prevalence of overweightness and obesity, especially for those who are already classified as overweight. 7 , 17 , 20 School closures in our cohort of patients (from Toronto and the Greater Toronto area, Canada) has varied from 8 to12 months, depending on the optional attendance for full‐time virtual education from the onset of the pandemic. During the pandemic, typical daily routines and supervision have been greatly altered, with parents juggling working from home while supporting children's educational, physical, and socioemotional needs. This has led to an increase in screen‐media exposure in children, fuelled by the need to fill a time void for children out of school coupled with the necessity for screen time to attend virtual school. Screen time has been shown to be a risk factor for weight gain in children and adolescents due to the increase in sedentary behaviour but additionally because it promotes a snacking behaviour. 3 , 13
Another potential contributor to increased weight gain in children during the pandemic is increased availability and consumption of food, particularly high caloric foods. Canadian food purchasing has shifted significantly during the COVID‐19 pandemic, with purchasing of dry goods, shelf‐stable foods and frozen produce increasing drastically as compared to the previous year. 4 , 5 , 16 Furthermore, the closure of schools created a significant change to daily eating patterns for children. During the school day, there are scheduled snack and lunch times with a finite availability of food available to the children, while at home there is less structure and routine to eating with constant access to food. Additionally, children who pre‐COVID‐19 relied on school programs for high‐quality nutrition may have shifted to consumption of lower quality but higher calorie food consumption at home. 5 , 16
Although there is evidence showing that children in general have suffered from excess weight gain, there has been no examination of the impact of the COVID‐19 pandemic on children with severe bleeding disorders, such as haemophilia and von Willebrand disease (VWD). This may be of particular interest as it has been shown that an increase in body mass index (BMI) may have a negative effect on short‐ and long‐term joint health status in patients with bleeding disorders. 14 , 15 , 19 A large cross‐sectional study of 6196 males with haemophilia undertaken by the United States Haemophilia Treatment Centre Network and the Centre for Disease Control showed that non‐obesity together with early start of prophylaxis were the two variables that most predicted preservation of joint motion and health. 12 Hence, prevention of obesity is a critical component in managing patients with severe bleeding disorders and deserves more attention than garnered in the past.
In addition to the joint and general health consequences of obesity in children with severe bleeding disorders, there may also be financial implications to significant weight gain. Weight gain will often prompt an increase in dosing for prophylaxis leading to additional financial burden to the healthcare system.
The purpose of this study is to describe the impact of the COVID‐19 pandemic on weight, BMI, and Haemophilia joint health scores (HJHS) in a large single‐centre Canadian cohort of paediatric patients with severe bleeding disorders.
2. METHODS
A retrospective single institution (The Hospital for Sick Children, Toronto, Canada) chart review was conducted of patients ≤ 18 years of age with a diagnosis of a severe‐phenotype bleeding disorder (haemophilia, von Willebrand disease, other rare factor deficiencies) who were on routine prophylactic therapy during the period of September 01, 2018 (2 years prior to the start of the COVID‐19 pandemic) to March 31, 2021. Institutional ethics review board approval was obtained.
2.1. Baseline covariates (pre‐COVID‐19 pandemic)
Baseline data consisted of the following covariates: age, weight (kg), weight percentile, weight z‐score, BMI, BMI percentile, BMI z‐score and Haemophilia Joint Health Score (HJHS). Patients were classified as overweight or obese if their baseline BMI was ≥85th and ≥95th centile, respectively. Postal codes were also collected to decipher those who lived in an urban or rural setting. To be included in the study, patients needed to have baseline data obtained within the 19 months prior to March 1, 2020.
2.2. Outcome variables (after onset of COVID‐19 pandemic)
Outcome variables, obtained at least 6 months after March 1, 2020 and up to March 31, 2021, included: changes in (delta) weight (kg), weight z‐score, weight percentile, BMI, BMI z‐score, and HJHS. Z‐scores for weight and BMI were used due to lessen the limitations in percentile growth curves including a ceiling effect (as you cannot have a percentile greater than 100th centile). A z‐score is a numerical measurement that describes a value's relationship to the mean of a group of values. Z‐score is measured in terms of standard deviations from the mean. If a z‐score is 0, it indicates that the data point's score is identical to the population mean score. For this analysis, a positive change in z‐score means that the population is becoming heavier than expected for age while a negative would imply that the population is becoming lighter. In addition to analysing the overall population of children we also performed subgroup analyses by age: preschool (0–4.9 years), primary (5–13.9 years) or secondary school (14–18.9 years).
2.3. Statistical analyses
Descriptive statistics were used to summarize baseline patient variables. T‐tests were used to assess if the weight and BMI measurements, percentiles, and z‐scores differed between the first and second measurements. Associations between baseline measurements as well as age category, and outcome variables (weight and BMI measurement, percentile, and z‐score deltas) were analysed using linear models. P‐values less than .05 were considered statistically significant. Statistical analysis was performed using R (R Core Team, 2020). The deltas in the pre‐COVID‐19 and COVID‐19 eras were compared using a paired T‐Test.
3. RESULTS
One hundred thirty patients were on routine prophylaxis during the study period and their charts were reviewed. The median age at baseline was 11.72 (IQR: 7.30–15.54). Age stratification was as follows: age 0–4.9 years (n = 18; 14.8%), age 5–13.9 years (n = 66; 54.1%), and age 14–18.9 years (n = 38; 31.1%). Diagnoses were as follows: haemophilia A (n = 92; 70.8%), haemophilia B (n = 17; 13.1%), type 3 von Willebrand disease (n = 11; 8.5%), the remainder were diagnosed with rare factor deficiencies such as afibrinogenemia, factor XIII, VII and X deficiencies. For 104 patients, there was both baseline and follow‐up data and as such this constituted the analysed group (see Table 1 for detailed demographics).
TABLE 1.
Patient demographics
| Severity (Baseline factor levels) | |
| Mild | 2 |
| Moderate | 10 (10.5%) |
| Severe | 83 (87.4%) |
| Age at baseline | |
| Minimum | 1.1 |
| Median (IQR) | 11.88 (7.8, 15.78) |
| Mean (SD) | 11.3 ± 4.7 |
| Maximum | 18.8 |
| Location of home | |
| Urban | 95 |
| Rural | 9 |
Pre‐COVID‐19, the median weight percentile was 63%, the median BMI percentile was 53.9% and the median weight z‐score was .33. The median weight at baseline was above population means. There was no statistically significant relationship between age at baseline and BMI z‐score (P = .1472) (Figure 1).
FIGURE 1.
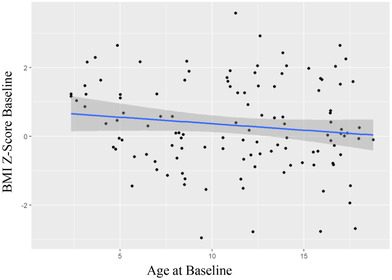
Patient BMI at baseline (pre‐COVID‐19) versus patient age at baseline
3.1. Outcomes
There was a median time interval of 12.24 months (IQR: 10.32–14.52) between the baseline assessment and the most recent assessment. There was a statistically significant increase in median weight percentile +5.75 centiles (from 63rd centile to 68.75th centile) while mean weight percentile increased by +2.2 centiles (P = .04). Similarly, there was an increase in weight z‐score; median increased by +.2 (from .33 to .53) while mean increased by +.14 (P = < .001). There was a statistically significant increase in mean BMI of +1.03 kg/m2 (P = < .001) while median BMI percentile increased +8.82 centiles (from 53.9th centile to 62.72nd centile) and mean BMI percentile increased 3.42 centiles (from 57.5 centile to 60.9 centile) (see Table 2).
TABLE 2.
Baseline (Pre‐COVID‐19) variables versus 12 months after the onset of COVID‐19 pandemic
| Baseline | 12 months after onset of COVID‐19 pandemic | Difference (Delta) | ||||||||||
|---|---|---|---|---|---|---|---|---|---|---|---|---|
|
Weight % |
BMI % |
Weight Z‐score |
BMI Z‐score |
Weight % |
BMI % |
Weight Z‐score |
BMI Z‐score |
Weight % |
BMI % |
Weight Z‐score |
BMI Z‐score | |
| Median | 63.00 | 53.90 | .33 | .10 | 68.75 | 62.72 | .53 | −.32 | +5.75 | +8.82 | +.2 | −.22 |
| Mean | 60.83 | 57.47 | .42 | .32 | 63.20 | 60.89 | .57 | −.42 | +2.37 | +3.42 | +.15 | −.10 |
| Range | .24‐99% | .15‐99.9% | −2.83‐3.68 | −2.96‐+3.58 | .25‐100% | .4‐99.99% | −2.81‐+3.78 | −2.96‐+.86 | ||||
The amount of weight gain was significantly different by age category (P = .005). With the most significant weight gain in those 5–14 years old (raw weight gain: +7.28 kg, CI: 6.12–8.45). The 5–14‐year‐old age group also had the highest gain in weight z‐score of +.2549 (CI: .1486–.3186). The lowest gain in weight z‐score was in the 14–18.9‐year age group. There was no statistically significant association between age and BMI z‐score delta (the change in BMI z‐score over the 12 months since the onset of the COVID‐19 pandemic) (Figure 2).
FIGURE 2.
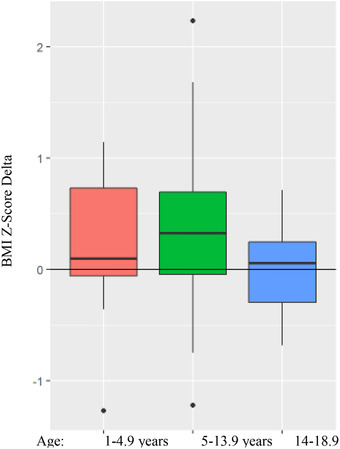
Change in BMI Z‐score by age group
Figure 3 addresses the question of which patients were most likely to gain weight based on their pre‐COVID‐19 pandemic BMI size. It was the patients who were more underweight (between 0 and 25th percentile for BMI) who gained the most as reflected by BMI z‐score. Yet the other two groups [(those with normal BMI percentile pre‐COVID‐19 pandemic (25th–75th percentiles) and those with above average BMI percentiles (> 75th percentiles) pre‐COVID‐19 pandemic] also showed a slight gain in BMI z‐score.
FIGURE 3.
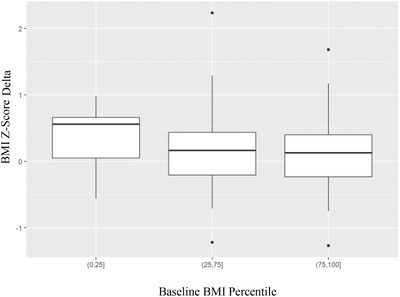
Z‐score delta by baseline BMI percentile
There were 10 patients who had a BMI z‐score delta greater than +1.0. Their median age was 7.65 years (IQR: 6.57–10.35). One patient was aged 0–5 years and all remaining patients were age 5–14 years. These patients had a median follow‐up time similar to the whole cohort of 12.7 months.
There was a significant correlation between baseline BMI z‐score and HJHS at baseline (P = .01) (patients with higher BMI z‐scores showed higher HJHS scores) and additionally HJHS scores were higher with increasing patient age (P = < .001). However, there was no statistically significant change in HJHS scores pre‐ versus after the onset of COVID‐19 (P = .4355) (Figure 4).
FIGURE 4.
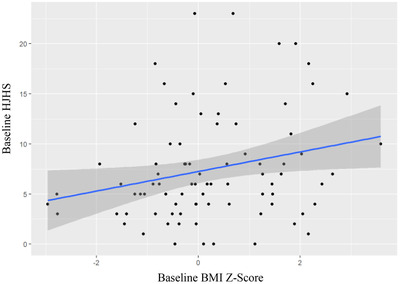
HJHS score by baseline BMI Z‐Score
Changes in the COVID‐19 (2019–2020) era were compared to changes in the pre‐COVID‐19 era using a paired T‐Test. The weight z‐score delta in the pre‐COVID‐19 era (2018–2019) was found to be +.04 while in the COVID‐19 era it was found to be +.10 with a difference of means of .22 (P = < .001). Similarly, BMI z‐score delta in the pre‐COVID‐19 era (2018–2019) was found to be .00 while in the COVID‐19 era it was found to be +.20 with a mean difference of .40 (P = < .001).
4. DISCUSSION
Our study found significant weight gain and BMI increase in paediatric patients with severe bleeding disorders over the course of the first 12 months of the COVID‐19 pandemic. Most significantly, the increase in z‐scores for both weight and BMI indicate that patients gained more weight than what was expected for their growth over 1 year. Incidentally, our patients were found to be above population means for weight and BMI at baseline which worsened over the first year of the pandemic.
The subgroup with the highest weight z‐score increase were school‐age children ages 5–14 years. The reasons for the weight gain observed in our population during the pandemic are likely multifactorial and interrelated. School‐age children were much more likely to be impacted by the 8–12 months of school closure in comparison to younger children (< 5 years of age) who pre‐COVID‐19 pandemic were likely not attending full‐time school. They were also more likely to be impacted by the absence of school‐related physical activities (gym, recess) than older aged children (14–18.9 years) who are less likely to engage in gym and recess at school.
All three age groups would have been impacted to different degrees by disrupted routines, increased screen time, increased time at home with constant access to food, and potential psychosocial stressors. Increased screen‐media exposure has been shown to be a risk factor for weight gain in children and adolescents due to poorer sleep, increased food consumption and decreased physical activity. 3 , 13 Recent Canadian data has found an increase in screen time in 87% of children during the pandemic while at the same time showing a decrease in physical activity among 52% of children. 5
Children and their families have also experienced dietary changes since the start of the COVID‐19 pandemic. In a recent Canadian study, more than half of parents and children reported eating more food in total and particularly more “snack” foods. 5 Families have also reported higher levels of overall stress, financial stress, and food insecurity during the pandemic. All of these have been found to correlate with increased risk of obesity. 5 , 16
Importantly, the increased weight gain in patients with bleeding disorders is concerning for long‐term joint health outcomes. Increased patient weight places more stress through weightbearing joints (knees, hips and ankles). 19 In agreement with this, we found that there was a direct correlation between baseline BMI and increased HJHS values in our patients (signifying more joint findings on physical examination in overweight patients). We cannot necessarily conclude that the higher BMI is causing the increased HJHS scores as potentially more joint disease might result in less physical activity leading to higher baseline BMI. While our study did not find a significant increase in HJHS scores during the approximately 1‐year study period, more long‐term longitudinal follow‐up is required to assess long‐term joint outcomes. Our data with respect to HJHS scores was also limited to only those patients with Type 3 VWD or haemophilia as it was only these children that undergo routine HJHS joint assessments.
The excessive weight gain by our patients during the study period is concerning for other long‐term outcomes. The sequelae of childhood obesity can be devastating. They include an increased risk for obesity in adulthood with associated increased risk of cardiovascular disease, hypertension, hyperlipidaemia, hyperinsulinemia, type 2 diabetes, and orthopaedic disease. 9 Furthermore, increased BMI in children is associated with negative self‐esteem, withdrawal from interaction with peers, depression, anxiety and feeling of chronic rejection. 18 Future studies are needed to evaluate these long‐term outcomes including joint health, medical and quality of life measures. Fortunately, identifying weight gain in our patients early provides an opportunity for intervention and our Comprehensive Bleeding Disorders Program has partnered with a medically supervised exercise medicine program through our institution. More data are needed regarding the long‐term outcomes of this intervention.
The delta z‐scores for weight and BMI were significantly higher in the COVID‐19 era suggesting that during COVID‐19 participants had a greater change in their weight and BMI z‐scores compared to the 2018–2019 year.
Limitations of our study include that it was single centre cohort study. Our study is also subject to possible selection bias as some patients [26 of 130 (20%)] were not included in study as there was no pre‐ and post‐COVID‐19 data available due to absence from in‐person clinic appointments. It is possible that, given the non‐random attendance in clinic, patients who are disproportionately affected by COVID‐19 may not have been captured in our study. Additionally, although urban and rural data was collected, only nine of the 104 individuals analysed were from a rural setting precluding an evaluation of the effect of residence on obesity development during the COVID‐19 pandemic. It is possible that rural patients were overrepresented among the 26 patients not included. Another limitation of this study was lack of data on both dietary and physical activity habits of our patients during the COVID‐19 pandemic. Further studies are required to examine habit changes related to the pandemic.
Other limitations include the shorter duration of follow‐up and the lack of HJHS data in all patients with rare bleeding disorders and those younger than four years of age. Additionally, the validity of BMI as a measure of childhood obesity is imperfect, as it is truly a measure of weight relative to height, as opposed to a direct measure of adiposity. A BMI value cannot distinguish between adipose tissue, muscle mass or skeletal mass and therefore can provide inaccurate measurements of body fatness. 8 Alternate methods of determining adiposity do exist, such as anthropometric measurements; however, these are also imperfect and often provide inaccurate results. BMI is the most used simple measure of obesity and routinely computed during clinic visits for our cohort of patients with bleeding disorders.
Overall, our study captured data on 80% of our children with severe bleeding disorders on regular prophylactic therapy and showed considerable increases in various measures reflecting weight and BMI amongst these children during the first year of the COVID‐19 pandemic. We are fearful that these changes will have negative long‐term ramifications for these children with respect to their physical and psychosocial health. Of course, as the world hopefully recovers from the COVID‐19 pandemic we will follow these children carefully to see if these negative changes are ultimately reversed.
ACKNOWLEDGEMENTS
Caroline Malcolmson, Vanessa Bouskill, Deirdre Tetzlaff and Manuel Carcao conceived, designed and participated in the study. Caroline Malcolmson, Vanessa Bouskill, Deirdre Tetzlaff, Cindy Wakefield and Manuel Carcao all assisted with data collection. Data were analysed by Caroline Malcolmson and Bryan Maguire. All authors contributed to manuscript writing and contributed to its revisions.
Malcolmson C, Tetzlaff D, Maguire B, Wakefield C, Carcao M, Bouskill V. Excess weight gain in the paediatric bleeding disorders population: Impact of the COVID‐19 Pandemic. Haemophilia. 2022;28:91–96. 10.1111/hae.14449
DATA AVAILABILITY STATEMENT
The data that support the findings of this study are available from the corresponding author upon reasonable request.
REFERENCES
- 1. Banis S, Suurmeijer ThPBM, Van Peer DR. Child‐rearing practices toward children with hemophilia: the relative importance of clinical characteristics and parental emotional reactions. Family Relations. 1999;48(2):207. [Google Scholar]
- 2. Boaventura B, Antunes LC, Stanford FC. ”New normal“ routine: the impact of COVID‐19 pandemic on chronodisrupture and its consequence on obesity. Chronobiol Int. 2021:1–4. [DOI] [PMC free article] [PubMed] [Google Scholar]
- 3. Cachón‐Zagalaz J, Zagalaz‐Sánchez MªL, Arufe‐Giráldez V, Sanmiguel‐Rodríguez A, González‐Valero G. Physical activity and daily routine among children aged 0–12 during the COVID‐19 pandemic in Spain. Int J Environ Res Public Health. 2021;18(2):703. [DOI] [PMC free article] [PubMed] [Google Scholar]
- 4. Canadian Consumers Prepare for COVID‐19 . (2020). Canadian Consumers Prepare for COVID‐19. https://www150.statcan.gc.ca/n1/pub/62f0014m/62f0014m2020004‐eng.htm
- 5. Carroll N, Sadowski A, Laila A, et al. The impact of COVID‐19 on health behavior, stress, financial and food security among middle to high income Canadian families with young children. Nutrients. 2020;12(8):2352. [DOI] [PMC free article] [PubMed] [Google Scholar]
- 6. Chaturvedi K, Vishwakarma DK, Singh N. COVID‐19 and its impact on education, social life and mental health of students: a survey. Child Youth Serv Rev. 2021;121:105866. [DOI] [PMC free article] [PubMed] [Google Scholar]
- 7. Franckle R, Adler R, Davison K. Accelerated weight gain among children during summer versus school year and related racial/ethnic disparities: a systematic review. Prevent Chronic Disease. 2014;11:130355. 10.5888/pcd11.130355. [DOI] [PMC free article] [PubMed] [Google Scholar]
- 8. Freedman DS, Sherry B. The validity of BMI as an indicator of body fatness and risk among children. Pediatrics. 2009;124(Supplement 1):S23–S34. 10.1542/peds.2008-3586e. [DOI] [PubMed] [Google Scholar]
- 9. Freedman DS, Dietz WH, Srinivasan SR, Berenson GS. The relation of overweight to cardiovascular risk factors among children and adolescents: the Bogalusa Heart Study. Pediatrics. 1999;103:1175–1182. 1. [DOI] [PubMed] [Google Scholar]
- 10. Goran MI. Metabolic precursors and effects of obesity in children: a decade of progress, 1990–1999. Am J Clin Nutr. 2001;73:158–171. [DOI] [PubMed] [Google Scholar]
- 11. Marsh S, Ni Mhurchu C, Maddison R. The non‐advertising effects of screen‐based sedentary activities on acute eating behaviours in children, adolescents, and young adults. A systematic review. Appetite. 2013;71:259–273. [DOI] [PubMed] [Google Scholar]
- 12. Manco‐Johnson MJ, Soucie JM, Gill JC. Joint outcomes committee of the universal data collection, US hemophilia treatment center network. Prophylaxis usage, bleeding rates, and joint outcomes of hemophilia, 1999 to 2010: a surveillance project. Blood. 2017;129(17):2368–2374. [DOI] [PMC free article] [PubMed] [Google Scholar]
- 13. Robinson TN, Banda JA, Hale L, et al. Screen media exposure and obesity in children and adolescents. Pediatrics. 2017;140(Supplement 2):S97–S101. [DOI] [PMC free article] [PubMed] [Google Scholar]
- 14. Soucie JM. Joint range‐of‐motion limitations among young males with hemophilia: prevalence and risk factors. Blood. 2004;103(7):2467–2473. [DOI] [PubMed] [Google Scholar]
- 15. Soucie JM, Wang C, Siddiqi A, Kulkarni R, Recht M, Konkle BA. The longitudinal effect of body adiposity on joint mobility in young males with Haemophilia A. Haemophilia. 2011;17(2):196–203. [DOI] [PubMed] [Google Scholar]
- 16. Tester JM, Rosas LG, Leung CW. Food insecurity and pediatric obesity: a double whammy in the era of COVID‐19. Curr Obes Rep. 2020;9(4):442–450. [DOI] [PMC free article] [PubMed] [Google Scholar]
- 17. Wang YC, Vine S, Hsiao A, Rundle A, Goldsmith J. Weight‐related behaviors when children are in school versus on summer breaks: does income matter? J School Health. 2015;85(7):458–466. [DOI] [PubMed] [Google Scholar]
- 18. Williams CL. Can childhood obesity be prevented? In: Bendich A, Deckelbaum RJ, eds. Primary and Secondary Preventive Nutrition. Totowa, NJ: Humana Press; 2001:185–204. [Google Scholar]
- 19. Wong TE, Majumdar S, Adams E, et al. Overweight and obesity in hemophilia: a systematic review of the literature. Am J Prev Med. 2011;41:S369–S375. [DOI] [PubMed] [Google Scholar]
- 20. Von Hippel PT, Workman J. From kindergarten through second grade, U.S. children's obesity prevalence grows only during summer vacations. Obesity, 2016;24(11):2296–2300. [DOI] [PubMed] [Google Scholar]
Associated Data
This section collects any data citations, data availability statements, or supplementary materials included in this article.
Data Availability Statement
The data that support the findings of this study are available from the corresponding author upon reasonable request.