

Abstract
Background
Trial monitoring is an important component of good clinical practice to ensure the safety and rights of study participants, confidentiality of personal information, and quality of data. However, the effectiveness of various existing monitoring approaches is unclear. Information to guide the choice of monitoring methods in clinical intervention studies may help trialists, support units, and monitors to effectively adjust their approaches to current knowledge and evidence.
Objectives
To evaluate the advantages and disadvantages of different monitoring strategies (including risk‐based strategies and others) for clinical intervention studies examined in prospective comparative studies of monitoring interventions.
Search methods
We systematically searched CENTRAL, PubMed, and Embase via Elsevier for relevant published literature up to March 2021. We searched the online 'Studies within A Trial' (SWAT) repository, grey literature, and trial registries for ongoing or unpublished studies.
Selection criteria
We included randomized or non‐randomized prospective, empirical evaluation studies of different monitoring strategies in one or more clinical intervention studies. We applied no restrictions for language or date of publication.
Data collection and analysis
We extracted data on the evaluated monitoring methods, countries involved, study population, study setting, randomization method, and numbers and proportions in each intervention group. Our primary outcome was critical and major monitoring findings in prospective intervention studies. Monitoring findings were classified according to different error domains (e.g. major eligibility violations) and the primary outcome measure was a composite of these domains. Secondary outcomes were individual error domains, participant recruitment and follow‐up, and resource use. If we identified more than one study for a comparison and outcome definitions were similar across identified studies, we quantitatively summarized effects in a meta‐analysis using a random‐effects model. Otherwise, we qualitatively summarized the results of eligible studies stratified by different comparisons of monitoring strategies. We used the GRADE approach to assess the certainty of the evidence for different groups of comparisons.
Main results
We identified eight eligible studies, which we grouped into five comparisons.
1. Risk‐based versus extensive on‐site monitoring: based on two large studies, we found moderate certainty of evidence for the combined primary outcome of major or critical findings that risk‐based monitoring is not inferior to extensive on‐site monitoring. Although the risk ratio was close to 'no difference' (1.03 with a 95% confidence interval [CI] of 0.81 to 1.33, below 1.0 in favor of the risk‐based strategy), the high imprecision in one study and the small number of eligible studies resulted in a wide CI of the summary estimate. Low certainty of evidence suggested that monitoring strategies with extensive on‐site monitoring were associated with considerably higher resource use and costs (up to a factor of 3.4). Data on recruitment or retention of trial participants were not available.
2. Central monitoring with triggered on‐site visits versus regular on‐site visits: combining the results of two eligible studies yielded low certainty of evidence with a risk ratio of 1.83 (95% CI 0.51 to 6.55) in favor of triggered monitoring intervention. Data on recruitment, retention, and resource use were not available.
3. Central statistical monitoring and local monitoring performed by site staff with annual on‐site visits versus central statistical monitoring and local monitoring only: based on one study, there was moderate certainty of evidence that a small number of major and critical findings were missed with the central monitoring approach without on‐site visits: 3.8% of participants in the group without on‐site visits and 6.4% in the group with on‐site visits had a major or critical monitoring finding (odds ratio 1.7, 95% CI 1.1 to 2.7; P = 0.03). The absolute number of monitoring findings was very low, probably because defined major and critical findings were very study specific and central monitoring was present in both intervention groups. Very low certainty of evidence did not suggest a relevant effect on participant retention, and very low‐quality evidence indicated an extra cost for on‐site visits of USD 2,035,392. There were no data on recruitment.
4. Traditional 100% source data verification (SDV) versus targeted or remote SDV: the two studies assessing targeted and remote SDV reported findings only related to source documents. Compared to the final database obtained using the full SDV monitoring process, only a small proportion of remaining errors on overall data were identified using the targeted SDV process in the MONITORING study (absolute difference 1.47%, 95% CI 1.41% to 1.53%). Targeted SDV was effective in the verification of source documents but increased the workload on data management. The other included study was a pilot study which compared traditional on‐site SDV versus remote SDV and found little difference in monitoring findings and the ability to locate data values despite marked differences in remote access in two clinical trial networks. There were no data on recruitment or retention.
5. Systematic on‐site initiation visit versus on‐site initiation visit upon request: very low certainty of evidence suggested no difference in retention and recruitment between the two approaches. There were no data on critical and major findings or on resource use.
Authors' conclusions
The evidence base is limited in terms of quantity and quality. Ideally, for each of the five identified comparisons, more prospective, comparative monitoring studies nested in clinical trials and measuring effects on all outcomes specified in this review are necessary to draw more reliable conclusions. However, the results suggesting risk‐based, targeted, and mainly central monitoring as an efficient strategy are promising. The development of reliable triggers for on‐site visits is ongoing; different triggers might be used in different settings. More evidence on risk indicators that identify sites with problems or the prognostic value of triggers is needed to further optimize central monitoring strategies. In particular, approaches with an initial assessment of trial‐specific risks that need to be closely monitored centrally during trial conduct with triggered on‐site visits should be evaluated in future research.
Plain language summary
New monitoring strategies for clinical trials
Our question
We reviewed the evidence on the effects of new monitoring strategies on monitoring findings, participant recruitment, participant follow‐up, and resource use in clinical trials. We also summarized the different components of tested strategies and qualitative evidence from process evaluations.
Background
Monitoring a clinical trial is important to ensure the safety of participants and the reliability of results. New methods have been developed for monitoring practices but further assessments of these new methods are needed to see if they do improve effectiveness without being inferior to established methods in terms of patient rights and safety, and quality assurance of trial results. We reviewed studies that examined this question within clinical trials, i.e. studies comparing different monitoring strategies used in clinical trials.
Study characteristics
We included eight studies which covered a variety of monitoring strategies in a wide range of clinical trials, including national and large international trials. They included primary (general), secondary (specialized), and tertiary (highly specialized) health care. The size of the studies ranged from 32 to 4371 participants at one to 196 sites.
Key results
We identified five comparisons. The first comparison of risk‐based monitoring versus extensive on‐site monitoring found no evidence that the risk‐based approach is inferior to extensive on‐site monitoring in terms of the proportion of participants with a critical or major monitoring finding not identified by the corresponding method, while resource use was three‐ to five‐fold higher with extensive on‐site monitoring. For the second comparison of central statistical monitoring with triggered on‐site visits versus regular (untriggered) on‐site visits, we found some evidence that central statistical monitoring can identify sites in need of support by an on‐site monitoring intervention. In the third comparison, the evaluation of adding an on‐site visit to local and central monitoring revealed a high percentage of participants with major or critical monitoring findings in the on‐site visit group, but low numbers of absolute monitoring findings in both groups. This means that without on‐site visits, some monitoring findings will be missed, but none of the missed findings had any serious impact on patient safety or the validity of the trial's results. In the fourth comparison, two studies assessed new source data verification processes, which are used to check that data recorded within the trial Case Report Form (CRF) match the primary source data (e.g. medical records), and reported little difference to full source data verification processes for the targeted as well as for the remote approach. In the fifth comparison, one study showed no difference in participant recruitment and participant follow‐up between a monitoring approach with systematic initiation visits versus an approach with initiation visits upon request by study sites.
Certainty of evidence
We are moderately certain that risk‐based monitoring is not inferior to extensive on‐site monitoring with respect to critical and major monitoring findings in clinical trials. For the remaining body of evidence, there is low or very low certainty in results due to imprecision, small number of studies, or high risk of bias. Ideally, for each of the five identified comparisons, more high‐quality monitoring studies that measure effects on all outcomes specified in this review are necessary to draw more reliable conclusions.
Summary of findings
Summary of findings 1. Risk‐based versus extensive on‐site monitoring.
| Risk‐based monitoring compared with extensive on‐site monitoring for clinical intervention studies | |||||
|
Patient or population: clinical trials in all fields of health care Settings: international/national trials Intervention: risk‐based monitoring strategy Comparison: extensive on‐site monitoring | |||||
| Outcomes | Relative effect (95% CI) | No of participants (studies) | Quality of the evidence (GRADE) | Comments | |
| Combined outcome of proportion of participants with major or critical monitoring findings | RR 1.03 (0.80 to 1.33) | 2377 (2 studies [nested in 33 clinical trials]) |
⊕⊕⊕⊝ Moderatea | — | |
| Impact of the monitoring strategy on participant on recruitment | — | — | — | Not reported. | |
| Impact of the monitoring strategy on follow‐up | — | — | — | Not reported. | |
| Effect of the monitoring strategy on resource use | ADAMON: number of monitoring visits per participant and the cumulative monitoring time | Higher for on‐site monitoring by a factor of 2.1 to 2.7 (ratios of the efforts calculated within each trial and summarized with the geometric mean) |
— | ⊕⊕⊝⊝ Lowb |
— |
| OPTIMON: costs of monitoring | Higher for on‐site by a factor of 2.7 | ||||
| OPTIMON: costs of travel and monitoring | Higher for on‐site by a factor of 3.4 | ||||
| ADAMON: ADApted MONitoring study; CI: confidence interval; OPTIMON: Optimisation of Monitoring for Clinical Research Studies; RR: risk ratio. | |||||
| GRADE Working Group grades of evidence High quality: further research is very unlikely to change our confidence in the estimate of effect. Moderate quality: further research is likely to have an important impact on our confidence in the estimate of effect and may change the estimate. Low quality: further research is very likely to have an important impact on our confidence in the estimate of effect and is likely to change the estimate. Very low quality: we are very uncertain about the estimate. | |||||
a Downgraded one level due to the imprecision of the summary estimate with the 95% confidence interval including the substantial advantages and disadvantages with the risk‐based monitoring intervention. b Downgraded two levels due to substantial imprecision; there were no confidence intervals for either of the two estimates on resource use provided in the ADAMON and OPTIMON studies and the two estimates could not be combined due to the nature of the estimate (resource use versus cost calculation).
Summary of findings 2. Central monitoring with triggered versus untriggered on‐site visits.
| Central statistical monitoring with triggered on‐site visits compared with regular (untriggered) on‐site visits for clinical intervention studies | ||||
|
Patient or population: clinical trials in all fields of health care Settings: international/national trials Intervention: triggered on‐site visits Comparison: regular (untriggered) on‐site visits | ||||
| Outcomes | Relative effect (95% CI) | No of participants (studies) | Quality of the evidence (GRADE) | Comments |
| Sites ≥ 1 major monitoring finding combined outcome | RR 1.92 (0.40 to 9.17) | 105 sites (2 studies) | ⊕⊕⊝⊝ Lowa |
— |
| Impact of the monitoring strategy on participant recruitment | — | — | — | Not reported. |
| Impact of the monitoring strategy on follow‐up | — | — | — | Not reported. |
| Effect of the monitoring strategy on resource use | — | — | — | Not reported. |
| *The basis for the assumed risk (e.g. the median control group risk across studies) is provided in footnotes. The corresponding risk (and its 95% confidence interval) is based on the assumed risk in the comparison group and the relative effect of the intervention (and its 95% CI). CI: confidence interval; RR: risk ratio. | ||||
| GRADE Working Group grades of evidence High quality: further research is very unlikely to change our confidence in the estimate of effect. Moderate quality: further research is likely to have an important impact on our confidence in the estimate of effect and may change the estimate. Low quality: further research is very likely to have an important impact on our confidence in the estimate of effect and is likely to change the estimate. Very low quality: we are very uncertain about the estimate. | ||||
a Downgraded one level because both studies were not randomized, and downgraded one level for imprecision.
Summary of findings 3. Central and local monitoring only versus central and local monitoring with on‐site visits.
| Central and local monitoring only compared with central and local monitoring with annual on‐site visits for clinical trials | ||||
|
Patient or population: clinical trials in all fields of health care Settings: international/national trials Intervention: central and local monitoring only Comparison: central and local monitoring with annual on‐site visits | ||||
| Outcomes | Relative effect (95% CI) | No of participants (studies) | Quality of the evidence (GRADE) | Comments |
| Combined outcome of proportion of participants with major or critical monitoring findings | OR 1.7 (1.1 to 2.7) | 4371 (1 study nested in 1 clinical trial) | ⊕⊕⊕⊝ Moderatea |
Prior defined monitoring findings were very study specific and central monitoring was present in both intervention arms, which might explain the low number of events. Percentage of findings were higher in the on‐site group, but the overall impact of these findings on the study was low due to the low absolute number of events. |
| Impact of the monitoring strategy on participant recruitment | — | — | — | Not reported. |
| Impact of the monitoring strategy on follow‐up | OR 0.8 (0.5 to 1.1) | 4371 (1 study nested in 1 clinical trial) | ⊕⊝⊝⊝ Very lowb |
— |
|
Effect of the monitoring strategy on resource use Cost attributed to on‐site monitoring (including visits for‐cause: 4 in on‐site group; 6 in the no on‐site group) |
USD 2,035,392 | — | ⊕⊝⊝⊝ Very lowc |
— |
| CI: confidence interval; OR: odds ratio. | ||||
| GRADE Working Group grades of evidence High quality: further research is very unlikely to change our confidence in the estimate of effect. Moderate quality: further research is likely to have an important impact on our confidence in the estimate of effect and may change the estimate. Low quality: further research is very likely to have an important impact on our confidence in the estimate of effect and is likely to change the estimate. Very low quality: we are very uncertain about the estimate. | ||||
a Downgraded one level because the estimate was based on a small number of events and because the estimate stemmed from a single study nested in a single trial (indirectness). b Downgraded three levels because the 95% confidence interval of the estimate allowed for substantial benefit as well as substantial disadvantages with the intervention and there was only a small number of events (serious imprecision); in addition, the estimate stemmed from a single study nested in a single trial (indirectness). c Downgraded three levels because the estimate was not accompanied by a confidence interval (imprecision) and because the estimate stemmed from a single study nested in a single trial (indirectness).
Summary of findings 4. Remote or targeted source data verification versus 100% source data verification.
| Remote or targeted SDV compared with traditional 100% SDV for clinical intervention studies | |||||
|
Patient or population: clinical trials in all fields of health care Settings: international/national trials Intervention: remote or targeted SDV Comparison: traditional 100% SDV | |||||
| Outcomes | Relative effect (95% CI) | No of participants (studies) | Quality of the evidence (GRADE) | Comments | |
| Monitoring findings | MONITORING: overall error rate with targeted SDV | 1.47% (1.41% to 1.53%) | 126 (1 study nested in 6 clinical trials) | ⊕⊕⊝⊝ Lowa |
— |
| MONITORING: error rate on key data with targeted SDV | 0.78% (0.65% to 0.91%) | ||||
| Mealer et al.: percentage of data values that could not be correctly identified via remote monitoring | 0.47% (0.03% to 0.79%) | 32 (1 study nested in 2 large trial networks) | |||
| Impact of the monitoring strategy on participant recruitment | — | — | — | Not reported. | |
| Impact of the monitoring strategy on follow‐up | — | — | — | Not reported. | |
| Effect of the monitoring strategy on resource use | MONITORING: saving on monitoring costs by targeted SDV strategy | EUR 5841 | 126 (1 study nested in 6 clinical trials) | ⊕⊝⊝⊝ Very lowb |
— |
| MONITORING: additional cost of data management for targeted SDV (queries) | EUR 8922 | ||||
| Mealer et al.: time per case report (mean with SD) remote vs on‐site | Adult: 4.60 (SD 1.42) min vs 3.60 (SD 0.96) min (P = 0.10); pediatric: 11.64 (SD 7.54) min vs 6.07 (SD 3.18) min (2‐tailed t‐test, P = 0.10) | 32 (1 study nested in 2 large trial networks) | |||
| CI: confidence interval; min: minute; RR: risk ratio; SD: standard deviation; SDV: source data verification. | |||||
| GRADE Working Group grades of evidence High quality: further research is very unlikely to change our confidence in the estimate of effect. Moderate quality: further research is likely to have an important impact on our confidence in the estimate of effect and may change the estimate. Low quality: further research is very likely to have an important impact on our confidence in the estimate of effect and is likely to change the estimate. Very low quality: we are very uncertain about the estimate. | |||||
a Downgraded two levels because randomization was not blinded in one of the studies and the outcomes of the two studies could not be combined. b Downgraded by one additional level in addition to (a) for imprecision because there were no confidence intervals provided.
Summary of findings 5. Monitoring with versus without initiation visit.
| No on‐site initiation visit compared with on‐site initiation visit for clinical intervention studies | ||||
|
Patient or population: clinical trials in all fields of health care Settings: international/national trials Intervention: no on‐site initiation visit Comparison: on‐site initiation visit | ||||
| Outcomes | Relative effect (95% CI) | No of participants (studies) | Quality of the evidence (GRADE) | Comments |
| Monitoring findings | — | — | — | Not reported. |
|
Impact of the monitoring strategy on participant recruitment Difference in the number of recruited participants between groups visited vs non‐visited |
302 vs 271 (no statistically significant difference) | 573 (1 study nested in 1 clinical trial) | ⊕⊝⊝⊝ Very lowa |
— |
|
Impact of the monitoring strategy on follow‐up Mean follow‐up time, calculated from the date of randomization to the date of last form received, visited vs non‐visited |
1.8 (SD 3.2) vs 2.5 (SD 3.6) months | 573 (1 study nested in 1 clinical trial) | ⊕⊝⊝⊝ Very low b |
— |
| Effect of the monitoring strategy on resource use | — | — | — | Not reported. |
| CI: confidence interval; SD: standard deviation. | ||||
| GRADE Working Group grades of evidence High quality: further research is very unlikely to change our confidence in the estimate of effect. Moderate quality: further research is likely to have an important impact on our confidence in the estimate of effect and may change the estimate. Low quality: further research is very likely to have an important impact on our confidence in the estimate of effect and is likely to change the estimate. Very low quality: we are very uncertain about the estimate. | ||||
a Downgraded three levels because of substantial imprecision (relevant advantages and relevant disadvantages were plausible given the small amount of data), and indirectness (a single study nested in a single trial).
b We downgraded by one additional level in addition to (a) for imprecision due to the small number of events.
Background
Trial monitoring is important for the integrity of clinical trials, the validity of their results, and the protection of participant safety and rights. The International Council on Harmonisation of Technical Requirements for Registration of Pharmaceuticals for Human Use (ICH) for Good Clinical Practice (GCP) formulated several requirements for trial monitoring (ICH 1996). However, the effectiveness of various existing monitoring approaches was unclear. Source data verification (SDV) during monitoring visits was estimated to use up to 25% of the sponsor's entire clinical trial budget, even though the association between data quality or participant safety and the extent of monitoring and SDV has not been clearly demonstrated (Funning 2009). Consistent application of intensive on‐site monitoring creates financial and logistical barriers to the design and conduct of clinical trials, with no evidence of participant benefit or increase in the quality of clinical research (Baigent 2008; Duley 2008; Embleton‐Thirsk 2019; Hearn 2007; Tudur Smith 2012a; Tudur Smith 2014).
Recent developments at international bodies and regulatory agencies such as the European Medicines Agency (EMA), the Organisation for Economic Co‐operation and Development (OECD), the European Commission (EC) and the Food and Drug Administration (FDA), as well as the 2016 addendum to ICH E6 GCP have supported the need for risk‐proportionate approaches to clinical trial monitoring and overall trial management (EC 2014; EMA 2013; FDA 2013; ICH 2016; OECD 2013). This has encouraged study sponsors to implement risk assessments in their monitoring plans and to use alternative monitoring approaches. There are several publications reporting on the experience of using a risk‐based monitoring approach, often including central monitoring, in specific clinical trials (Edwards 2014; Heels‐Ansdell 2010; Valdés‐Márquez 2011). The main idea is to focus monitoring on trial‐specific risks to the integrity of the research and to essential GCP objectives, that is, risks that threaten the safety, rights, and integrity of trial participants; the safety and confidentiality of their data; or the reliable report of the trial results (Brosteanu 2017a). The conduct of 'lower risk' trials (lower risk for study participants) — which optimize the use of already authorized medicinal products, validated devices, implemented interventions, and interventions formally outside of the clinical trials regulations — may particularly benefit from a risk‐based approach to clinical trial monitoring in terms of timely completion and cost efficiency. Such 'lower risk' trials are often investigator‐initiated or academic ‐ sponsored clinical trials conducted in the academic setting (OECD 2013). Different risk assessment strategies for clinical trials have been developed, with the objective of defining risk‐proportionate monitoring plans (Hurley 2016). There is no standardized approach for examining the baseline risk of a trial. However, risk assessment approaches evaluate risks associated with the safety profile of the investigational medicinal product (IMP), the phase of the clinical trial, and the data collection process. Based on a prior risk assessment, a study‐specific combination of central/centralized and on‐site monitoring might be effective. Centralized monitoring, also referred to as central monitoring, is defined as any monitoring processes that are not performed at the study site (FDA 2013), and includes remote monitoring processes. Central data monitoring is based on the evaluation of electronically available study data in order to identify study sites with poor data quality or problems in trial conduct (SCTO 2020; Venet 2012), whereas on‐site monitoring comprises site inspection, investigator/staff contact, SDV, observation of study procedures, and the review of regulatory elements of a trial. Central statistical monitoring (including plausibility checks of values for different variables, for instance) is an integral part of central data monitoring (SCTO 2020), but this term is sometimes used interchangeably with central data monitoring. The OECD classifies risk assessment strategies into stratified approaches and trial‐specific approaches, and proposes a harmonized two‐pronged strategy based on internationally validated tools for risk assessment and risk mitigation (OECD 2013). The effectiveness of these new risk‐based approaches in terms of quality assurance, patient rights and safety, and reduction of cost, needs to be empirically assessed. We examined the risk‐based monitoring approach followed at our own institution (the Clinical Trial Unit and Department of Clinical Research, University Hospital Basel, Switzerland) using mixed methods (von Niederhausern 2017). In addition, several prospective studies evaluating different monitoring strategies have been conducted. These include ADAMON (ADApted MONitoring study; Brosteanu 2017a ), OPTIMON (Optimisation of Monitoring for Clinical Research Studies; Journot 2015), TEMPER (TargetEd Monitoring: Prospective Evaluation and Refinement; Stenning 2018a), START Monitoring Substudy (Strategic Timing of AntiRetroviral Treatment; Hullsiek 2015; Wyman Engen 2020), and MONITORING (Fougerou‐Leurent 2019).
Description of the methods being investigated
Traditional trial monitoring consists of intensive on‐site monitoring strategies comprising frequent on‐site visits and up to 100% SDV. Risk‐based monitoring is a new strategy that recognizes that not all clinical trials require the same approach to quality control and assurance (Stenning 2018a), and allows for stratification based on risk indicators assessed during the trial or before it starts. Risk‐based strategies differ in their risk assessment approaches as well as in their implementation and extent of on‐site and central monitoring components. They are also referred to as risk‐adapted or risk‐proportionate monitoring strategies. In this review, which is based on our published protocol (Klatte 2019), we investigated the effects of monitoring methods on ensuring patient rights and safety, and the validity of trial data. These key elements of clinical trial conduct are assessed by monitoring for critical or major violation of GCP objectives, according to the classification of GCP findings described in EMA 2017.
Monitoring strategies empirically evaluated in studies
All the monitoring strategies eligible for this review introduced new methods that might be effective in directing monitoring components and resources guided by a risk evaluation or prioritization.
1. Risk‐based monitoring strategies
The risk‐based strategy proposed by Brosteanu and colleagues is based on an initial assessment of the risk associated with an individual trial protocol (ADAMON: Brosteanu 2009). The implementation of this three‐level risk assessment focuses on critical data and procedures describing the risk associated with a therapeutic intervention and incorporates an assessment of indicators for patient‐related risks, indicators of robustness, and indicators for site‐related risks. Trial‐specific risk analysis then informs a monitoring plan that contains on‐site elements as well as central and statistical monitoring methods to a different extent corresponding to the judged risk level. The consensus risk‐assessment scale (RAS) and risk‐adapted monitoring plan (RAMP) developed by Journot and colleagues in 2010 consists of a four‐level initial risk assessment, leading to monitoring plans of four levels of intensity (OPTIMON; Journot 2011). The optimized monitoring strategy concentrates on the main scientific and regulatory aspects, compliance with requirements for patient consent and serious adverse events (SAE), and the frequency of serious errors concerning the validity of the trial's main results and the trial's eligibility criteria (Chene 2008). Both strategies incorporate central monitoring methods that help to specify the monitoring intervention for each study site within the framework of their assigned risk level.
2. Central monitoring with triggered on‐site visits
The triggered on‐site monitoring strategy suggested by the Medicines and Healthcare products Regulatory Agency, Medical Research Council (MRC), and UK Department of Health includes an initial risk assessment on the basis of the intervention and design of the trial and a resulting monitoring plan for different trial sites that is continuously updated through centralized monitoring. Over the course of a clinical trial, sites are prioritized for on‐site visits based on predefined central monitoring triggers (Meredith 2011; TEMPER: Stenning 2018a).
3. Central and local monitoring
A strategy that is mainly based on central monitoring, combined with a local quality control provided by qualified personnel on‐site, is being evaluated in the START Monitoring Substudy (Hullsiek 2015). In this study, continuous central monitoring uses descriptive statistics on the consistency and quality of the data and data completeness. Semi‐annual performance reports are generated for each site, focusing on the key variables/endpoints regarding patients' safety (SAEs, eligibility violations) and data quality. This evaluates whether adding on‐site monitoring to these procedures leads to differences in the participant‐level composite outcome of monitoring findings.
4. Monitoring with targeted or remote source data verification
The monitoring strategy developed for the MONITORING study is characterized by a targeted SDV in which only regulatory and scientific key data are verified (Fougerou‐Leurent 2019). This strategy is compared to full SDV and assessed based on final data quality and costs. One pilot study assessed a new strategy of remote SDV where documents were accessed via electronic health records, clinical data repositories, web‐based access technologies, or authentication and auditing tools (Mealer 2013).
5. On‐site initiation visits upon request
In this monitoring strategy, systematic initiation visits at all sites are replaced by initiation visits that take place only upon investigators' request at a site (Liènard 2006).
How these methods might work
The intention for risk‐based monitoring methods is to increase the efficiency of monitoring and to optimize resource use by directing the amount and content of monitoring visits according to an initially assessed risk level of an individual trial. These new methods should be at least non‐inferior in detecting major or critical violation of essential GCP objectives, according to EMA 2017, and might even be superior in terms of prioritizing monitoring content. The risk assessment preceding the risk‐based monitoring plan should consider the likelihood of errors occurring in key aspects of study performance, and the anticipated effect of such errors on the protection of participants and the reliability of the trial's results (Landray 2012). Trials within a certain risk category are initially assigned to a defined monitoring strategy which remains adjustable throughout the conduct of the trial and should always match the needs of the trial and specific trial sites. This flexibility is an advantage, considering the heterogeneity of study designs and participating trial sites. Central monitoring would also allow for continuous verification of data quality based on prespecified triggers and thresholds, and would enable early intervention in cases of procedural or data‐recording errors. Besides the detection of missing or invalid data, trial entry procedures and protocol adherence, as well as other performance indicators, can be monitored through a continuous analysis of electronically captured data (Baigent 2008). In addition, comparison with external sources may be undertaken to validate information contained in the data set; and the identification of poorly performing sites would ensure a more targeted application of on‐site monitoring resources. Use of methods that take advantage of the increasing use of electronic systems (e.g. electronic case report forms [eCRFs]) may allow data to be checked by automated means and allows the application of entry rules supporting up‐to‐date, high‐quality data. These methods would also ensure patient rights and safety while simultaneously improving trial management and optimizing trial conduct. Adaptations in the monitoring approach toward a reduction of on‐site monitoring visits, provided that patient rights and safety are ensured, could allow the application of resources to the most crucial components of the trial (Journot 2011).
In order to evaluate whether these new risk‐based monitoring approaches are non‐inferior to the traditional extensive on‐site monitoring, an assessment of differences in critical and major findings during monitoring activities is essential. Monitoring findings are determined with respect to patient safety, patient rights, and reliability of the data, and classified as critical and major according to the classification of GCP findings described in the Procedures for reporting of GCP inspections requested by the Committee for Medicinal Products for Human Use (EMA 2017). Critical findings are conditions, practices, or processes that adversely affect the rights, safety, or well‐being of the participants or the quality and integrity of data. Major findings are conditions, practices, or processes that might adversely affect the rights, safety, or well‐being of the participants or the quality and integrity of data.
Why it is important to do this review
There is insufficient information to guide the choice of monitoring approaches consistent with GCP to use in any given trial, and there is a lack of evidence on the effectiveness of suggested monitoring approaches. This has resulted in high heterogeneity in the monitoring practices used by research institutions, especially in the academic setting (Morrison 2011). A guideline describing which type of monitoring strategy is most effective for clinical trials in terms of patient rights and safety, and data quality, is urgently needed for the academic clinical trial setting. Evaluating the benefits and disadvantages of different risk‐based monitoring strategies, incorporating components of central or targeted and triggered (or both) monitoring versus intensive on‐site monitoring, might lead to a consensus on how effective these new approaches are. In addition, evaluating the evidence of effectiveness could provide information on the extent to which on‐site monitoring content (such as SDV or frequency of site visits) can be adapted or supported by central monitoring interventions. In this review, we explored whether monitoring that incorporates central (including statistical) components could be extended to support the overall management of study quality in terms of participant recruitment and follow‐up.
The risk‐based monitoring interventions that are eligible for this review incorporate on‐site and central monitoring components, which may vary extent and procedural structure. In line with the recommendation from the Clinical Trials Transformation Initiative (Grignolo 2011), it is crucial to systematically analyze and compare the existing evidence so that best practices may be established. This review may facilitate the sharing of current knowledge on effective monitoring strategies, which would help trialists, support units, and monitors to choose the best strategy for their trials. Evaluation of the impact of a change of monitoring approaches on data quality and study cost is relevant for the effective adjustment of current monitoring strategies. In addition, evaluating the effectiveness of these new monitoring approaches in comparison with intensive on‐site monitoring might reveal possible methods to replace or support on‐site monitoring strategies by taking advantage of the increasing use of electronic systems and resulting opportunities to implement statistical analysis tools.
Objectives
To evaluate the advantages and disadvantages of different monitoring strategies (including risk‐based strategies and others) for clinical intervention studies examined in prospective comparative studies of monitoring interventions.
Methods
Criteria for considering studies for this review
Types of studies
We included randomized or non‐randomized prospective, empirical evaluation studies that assessed monitoring strategies in one or more clinical intervention studies. These types of embedded studies have recently been called 'studies within a trial' (SWATs) (Anon 2012; Treweek 2018a). We excluded retrospective studies because of their limitations with respect to outcome standardization and variable definitions.
We followed the Cochrane Effective Practice and Organisation of Care (EPOC) Group definitions for the eligible study designs (EPOC 2016).
We applied no restrictions on language or date of publication.
Types of data
We extracted information about monitoring processes as well as evaluations of the comparison and advantages/disadvantages of different monitoring approaches. We included data from published and unpublished studies, and grey literature, that compared different monitoring strategies (e.g. standard monitoring versus a risk‐based approach).
Study characteristics of interest were:
monitoring interventions;
risk assessment characteristics;
finding rates of serious/critical audits;
impact on participant recruitment and follow‐up; and
costs.
Types of methods
We included studies that compared:
a risk‐based monitoring strategy versus an intensive on‐site monitoring strategy for prospective intervention studies; or
any other prospective comparison of monitoring strategies for intervention studies.
Types of outcome measures
Specific outcome measures were not part of the eligibility criteria.
Primary outcomes
Combined outcome of critical and major monitoring findings in prospective intervention studies. Different error domains of critical and major monitoring findings were combined in the primary outcome measure (eligibility violations, informed‐consent violations, findings that raise doubt about the accuracy or credibility of key trial data and deviations of intervention from the trial protocol, errors in endpoint assessment, and errors in SAE reporting).
Critical and major findings were defined according to the classification of GCP findings described in EMA 2017 , as follows.
Critical findings: conditions, practices, or processes that adversely affected the rights, safety, or well‐being of the study participants or the quality and integrity of data. Observations classified as critical may have included a pattern of deviations classified either as major, or bad quality of the data or absence of source documents (or both). Manipulation and intentional misrepresentation of data was included in this group.
Major findings: conditions, practices, or processes that might adversely affect either the rights, safety, or well‐being of the study participants or the quality and integrity of data (or both). Major observations are serious deficiencies and are direct violations of GCP principles. Observations classified as major may have included a pattern of deviations or numerous minor observations (or both).
Our protocol stated definitions of combined outcomes of critical and major findings in the respective studies (Table 6) (Klatte 2019).
1. Definitions of combined monitoring outcomes.
| ADAMON (translated from German study protocol Brosteanu 2017b ) | OPTIMON (Journot 2015 ) | START (Wyman 2020 ) | TEMPER (Stenning 2018a ) | Knott 2015 | |
| General definition (major or critical) |
|
|
The primary outcome for the monitoring substudy was a participant‐level composite outcome consisting of 6 major components : major eligibility violations, major informed consent violations, use of ART for initial therapy that is not permitted by the START protocol, ≥ 6‐month delay in reporting START primary endpoints or serious events, and data alteration or fraud. | The primary outcome measure was the proportion of sites with ≥ 1 major or critical finding not already identified through central monitoring or a previous visit. Critical findings: those that impact, or potentially could impact, directly on participant safety or confidentiality, or create serious doubt in the accuracy or credibility of trial data. Major findings: included deviations from the protocol that may have resulted in questionable data being obtained, or errors that consisted of a number of minor deviations from regulations, suggesting that procedures were not being followed. Any major finding that was not corrected, or that recurred after initial notification, was raised to critical status. The Consistency of Monitoring Group (CMG) comprised the Trial Manager or Data Manager(s) (or both) of the trials that take part in the study, the TSMs, and the Clinical Project Manager. The group met 3‐monthly to discuss the monitoring findings and reach consensus in consistency in the grading of the findings. |
The primary outcome measure was the proportion of sites with ≥ 1 major or critical finding not already identified through central monitoring or a previous visit. |
| Informed consent |
|
Non‐compliance of the participant's consent form for whatever reason:
|
Informed consent violations were initially defined as:
The primary outcome component for consent violations was modified in February 2016.
|
|
Not reported. |
| Eligibility |
|
Failure to comply with ≥ 1 eligibility criterion (inclusion or exclusion) without priordispensation . (A request for dispensation was a request, made by the investigator of the investigation site to the methodology and management center, to include a participant for whom an eligibility criterion was not observed.) | Eligibility violations (HIV‐negative, lack of 2 CD4+ cell counts > 500 cells/mm 3 within 60 days before randomization, prior ART or interleukin‐2 use, or pregnancy). | Source/priority data discrepancy. | Not reported. |
| SAE |
In clinical studies involving medical compounds without a clear safety profile for the indication of interest, adverse events should be considered in the assessment of monitoring findings. |
Serious or unexpected adverse event not declared in a way which complied with the regulations in force, while it has been known to the investigator for > 48 hours. | START serious clinical event (grade 4 event or unscheduled hospitalization) not reported within 6 months from occurrence. | Unreported SAE/notable event. | Not reported. |
| Endpoint |
(Timely and methodological deviations considered as major in the collection of the primary endpoint were documented in the study‐specific audit manual.) |
Value missing for the main judgement criterion (possibly calculated on part of the monitoring period: see comment 3, section 5 eligibility criteria), whatever the reason, including not updating a survival criterion. Each file was reviewed by the OPTIMON validation committee (see section 10.4) which confirmed and documented the error without knowing the monitoring strategy applied. | START primary clinical event not reported within 6 months from occurrence (all potential primary endpoints were counted irrespective of later Endpoint Review Committee review). | Unreported endpoint. | Not reported. |
| Intervention | Observation and follow‐up were altered without urgent medical need. Definitions of unacceptable protocol deviation in the observation or follow‐up phase were documented in the study‐specific audit manual (e.g. unacceptable in terms of validity of study results). | — | Use of ART for initial therapy that was not permitted by START. | — | Not reported. |
| Others | — | — | — |
|
Not reported. |
ART: antiretroviral therapy; CTU: clinical trials unit; GCP: good clinical practice; IRB: institutional review board; SAE: serious adverse event; TSM: trial supply management.
Secondary outcomes
-
Individual components of the primary outcome:
major eligibility violations;
major informed‐consent violations;
findings that raised doubt about the accuracy or credibility of key trial data and deviations of intervention from the trial protocol (with impact on patient safety or data validity);
errors in endpoint assessment; and
errors in SAE reporting.
Impact of the monitoring strategy on participant recruitment and follow‐up.
Effect of the monitoring strategy on resource use (costs).
Qualitative research data or process evaluations of the monitoring interventions.
Search methods for identification of studies
Electronic searches
We conducted a comprehensive search (May 2019) using a search strategy that we developed together with an experienced scientific information specialist (HE). We systematically searched the Cochrane Central Register of Controlled Trials (CENTRAL), PubMed, and Embase via Elsevier for relevant published literature (PubMed strategy shown below, all searches in full in the Appendix 1). The search strategy for all three databases was peer‐reviewed according to PRESS guidelines (McGowan 2016) by the Cochrane information specialist, Irma Klerings (Cochrane Austria). We also searched the online SWAT repository (go.qub.ac.uk/SWAT-SWAR). We applied no restrictions regarding language or date of publication. Since our original search for the review took place in May 2019, we performed an updated search in March 2021 to ensure that we included all eligible studies up to that date. Our updated search identified no additional eligible studies.
We used the following terms to identify prospective studies that compared different strategies for trial monitoring:
triggered monitoring;
targeted monitoring;
risk‐adapted monitoring;
risk adapted monitoring;
risk‐based monitoring;
risk based monitoring;
centralized monitoring;
centralised monitoring;
statistical monitoring;
on site monitoring;
on‐site monitoring;
monitoring strategy;
monitoring method;
monitoring technique;
trial monitoring; and
central monitoring.
The search was intended to identify randomized trials and non‐randomized intervention studies that evaluated monitoring strategies in a prospective setting. Therefore, we modified the Cochrane sensitivity‐maximizing filter for randomized trials (Lefebvre 2011).
PubMed search strategy:
(“on site monitoring”[tiab] OR “on‐site monitoring”[tiab] OR “monitoring strategy”[tiab] OR “monitoring method”[tiab] OR “monitoring technique”[tiab] OR ”triggered monitoring”[tiab] OR “targeted monitoring”[tiab] OR “risk‐adapted monitoring”[tiab] OR “risk adapted monitoring”[tiab] OR “risk‐based monitoring”[tiab] OR “risk based monitoring”[tiab] OR “risk proportionate”[tiab] OR “centralized monitoring”[tiab] OR “centralised monitoring”[tiab] OR “statistical monitoring”[tiab] OR “central monitoring”[tiab]) AND (“prospective” [tiab] OR “prospectively” [tiab] OR randomized controlled trial [pt] OR controlled clinical trial [pt] OR randomized [tiab] OR placebo [tiab] OR drug therapy [sh] OR randomly [tiab] OR trial [tiab] OR groups [tiab]) NOT (animals [mh] NOT humans[mh])
Searching other resources
We handsearched reference lists of included studies and similar systematic reviews to find additional relevant study articles (Horsley 2011). In addition, we searched the grey literature (Appendix 2) (i.e. conference proceedings of the Society for Clinical Trials and the International Clinical Trials Methodology Conference), and trial registries (ClinicalTrials.gov, the World Health Organization International Clinical Trials Registry Platform, the European Union Drug Regulating Authorities Clinical Trials Database, and ISRCTN) for ongoing or unpublished prospective studies. Finally, we collaborated closely with researchers of already identified eligible studies (e.g. OPTIMON, ADAMON, INSIGHT START, and MONITORING) and contacted researchers to identify further studies (and unpublished data, if available).
Data collection and analysis
Data collection and analysis methods were based on the recommendations described in the Cochrane Handbook for Systematic Reviews of Interventions (Higgins 2020) and Methodological Expectations for the Conduct of Cochrane Intervention Reviews (Higgins 2016).
Selection of studies
After elimination of duplicate records, two review authors (KK and PA) independently screened titles and abstracts for eligibility. We retrieved potentially relevant studies as full‐text reports and two review authors (KK and MB) independently assessed these for eligibility, applying prespecified criteria (see: Criteria for considering studies for this review). We resolved any disagreements between review authors by discussion until consensus was reached, or by involving a third review author (CPM). We documented the study selection process in a flow diagram, as described in the PRISMA statement (Moher 2009).
Data extraction and management
For each eligible study, two review authors (KK and MMB) independently extracted information on a number of key characteristics, using electronic data collection forms (Appendix 3). Data were extracted in Epi‐Reviewer 4 (Thomas 2010). We resolved any disagreements by discussion until consensus was reached, or by involving a third review author (MB). We contacted authors of included studies directly when target information was unreported or unclear to clarify or complete extracted data. We summarized the data qualitatively and quantitatively (where possible) in the Results section, below. If meta‐analysis of the primary or secondary outcomes was not applicable due to considerable methodological heterogeneity between studies, we reported the results qualitatively only.
Extracted study characteristics included the following.
General information about the study: title, authors, year of publication, language, country, funding sources.
Methods: study design, allocation method, study duration, stratification of sites (stratified on risk level, country, projected enrolment, etc.).
-
Characteristics of clinical trials included in the prospective comparison of monitoring strategies:
design (randomized or other prospective intervention trial);
setting (primary care, tertiary care, community, etc.);
national or multinational;
study population;
total number of sites randomized/analyzed;
inclusion/exclusion criteria;
IMP risk category;
support from clinical trials unit (CTU) or clinical research organization for host trial or evidence for experienced research team; and
trial phase.
-
Intervention (components related to the applied monitoring strategy, including theoretical basis):
number of sites randomized/allocated to groups (specifying number of sites or clusters);
duration of intervention period;
risk assessment characteristics (follow‐up questions)/triggers or thresholds that induce on‐site monitoring (follow‐up questions);
frequency of monitoring visits;
extent of on‐site monitoring;
frequency of central monitoring reports;
number of monitoring visits per participant;
cumulative monitoring time on‐site;
mean number of monitoring visits per site;
delivery (procedures used for central monitoring: structure/components of on‐site monitoring/triggers/thresholds);
who performed the monitoring (study team, trial staff; qualifications of monitors);
degree of SDV (median number of participants undergoing SDV); and
co‐interventions (site/study‐specific co‐interventions).
Outcomes: primary and secondary outcomes, individual components of combined primary outcome, outcome measures and scales, time points of measurement, statistical analysis of outcome data.
Data to assess the risk of bias of included studies (e.g. random sequence generation, allocation concealment, blinding of outcome assessors, performance bias, selective reporting, or other sources of bias).
Assessment of risk of bias in included studies
Two review authors (KK and MMB) independently assessed the risk of bias in each included study using the criteria described in the Cochrane Handbook for Systematic Reviews of Interventions (Higgins 2020) and the Cochrane EPOC Review Group (EPOC 2017). The domains provided by these criteria were evaluated for all included randomized studies and assigned ratings of low, high, or unclear risk of bias. We assessed non‐randomized studies using the ROBINS‐I tool of bias assessment for non‐randomized studies separately (Higgins 2020, Chapter 25).
We assessed the risk of bias for randomized studies as follows.
Selection bias
Generation of the allocation sequence
If sequence generation was truly random (e.g. computer generated): low risk.
If sequence generation was not specified and we were unable to obtain relevant information from study authors: unclear risk.
If there was a quasi‐random sequence generation (e.g. alternation): high risk.
Non‐randomized trials: high risk.
Concealment of the allocation sequence (steps taken prior to the assignment of intervention to ensure that knowledge of the allocation was not possible)
If opaque, sequentially numbered envelopes were used or central randomization was performed by a third party: low risk.
If the allocation concealment was not specified and we were unable to ascertain whether the allocation concealment had been protected before and until assignment: unclear risk.
Non‐randomized trials and studies that used inadequate allocation concealment: high risk.
For non‐randomized studies, we further assessed if investigators attempted to balance groups by design (control for selection bias) and attempted to control for confounding: high risk according to Cochrane risk of bias tool, but we considered the risk of bias control efforts in our judgment of the certainty of the evidence according to GRADE.
Performance bias
It is not practicable to blind participating sites and monitors to the intervention to which they were assigned because of the procedural differences of monitoring strategies.
Detection bias (blinding of the outcome assessor)
If the assessors performing audits had knowledge of the intervention and thus outcomes were not assessed blindly: high risk.
If we could not ascertain whether assessors were blinded and study authors did not provide information to clarify: unclear risk.
If outcomes were assessed blindly: low risk.
Attrition bias
We did not expect to have missing data for our primary outcome (i.e. the rates of serious/critical audit findings at the end of the host clinical trials; and because missing participants were not audited, missing data in the proportion of critical findings were not expected). However, for the statistical power of the individual study outcomes, missing data for participants and site accrual could be an issue and is discussed below (Discussion).
Selective reporting bias
We investigated whether all outcomes mentioned in available study protocols, registry entries, or methodology sections of study publications were reported in results sections.
If all outcomes in the methodology or outcomes specified in the study protocol were not reported in the results, or if outcomes reported in the results were not listed in the methodology or in the protocol: high risk.
If outcomes were only partly reported in the results, or if an obvious outcome was not mentioned in the study: high risk.
If information is unavailable on the prespecified outcomes and the study protocol: unclear risk.
If all outcomes were listed in the protocol/methodology section and reported in the results: low risk.
Other potential sources of bias
If there was one or more important risk of bias (e.g. flawed study design): high risk .
If there was incomplete information regarding a problem that may have led to bias: unclear risk .
If there was no evidence of other sources of bias: low risk .
We assessed the risk of bias for non‐randomized studies as follows.
Pre‐intervention domains
Confounding – baseline confounding occurs when one or more prognostic variables (factors that predict the outcome of interest) also predict the intervention received at baseline.
Selection bias (bias in selection of participants into the study) – when exclusion of some eligible participants, or the initial follow‐up time of some participants, or some outcome events, is related to both intervention and outcome, there will be an association between interventions and outcome even if the effect of interest is truly null.
At‐intervention domain
Information bias – bias in classification of interventions, i.e. bias introduced by either differential or non‐differential misclassification of intervention status.
Postintervention domains
Confounding – bias that arises when there are systematic differences between experimental intervention and comparator groups in the care provided, which represent a deviation from the intended intervention(s).
Selection bias – bias due to exclusion of participants with missing information about intervention status or other variables such as confounders.
Information bias – bias introduced by either differential or non‐differential errors in measurement of outcome data.
Reporting bias – bias in selection of the reported result.
Judgment
| Risk of bias judgment | Interpretation |
| Low risk of bias | The study was comparable to a well‐performed randomized trial with regard to this domain. |
| Moderate risk of bias | The study was sound for a non‐randomized study with regard to this domain but could not be considered comparable to a well‐performed randomized trial. |
| Serious risk of bias | The study had some important problems in this domain. |
| Critical risk of bias | The study was too problematic in this domain to provide any useful evidence on the effects of intervention. |
| No information | No information on which to base a judgment about risk of bias for this domain. |
| From Higgins 2020. | |
Measures of the effect of the methods
We conducted a comparative analysis of the impact of different risk‐based monitoring strategies on data quality and patient rights and safety measures, for example by the proportion of critical findings.
If meta‐analysis was appropriate, we analyzed dichotomous data using a risk ratio with a 95% confidence interval (CI). We analyzed continuous data using mean differences with a 95% CI if the measurement scale was the same. If the scale was different, we used standardized mean differences with 95% CIs.
Unit of analysis issues
Included studies could differ in outcomes chosen to assess the effects of the respective monitoring strategy. Critical/serious audit findings could be reported on a participant level, per finding event, or per site. Furthermore, components of the primary endpoints could vary between studies. We specified the study outcomes as defined in the study protocols or reports, and only meta‐analyzed outcomes that were based on similar definitions. In addition, we compared individual components of the primary outcome if these were consistently defined across studies (e.g. eligibility violations).
Cluster randomized trials have been highlighted separately to individually randomized trials. We reported the baseline comparability of clusters and considered statistical adjustment to reduce any potential imbalance. We estimated the intracluster correlation coefficient (ICC), as described by Higgins 2020, using information from the study (if available) or from an external estimate from a similar study. We then conducted sensitivity analyses to explain variation in ICC values.
Dealing with missing data
We contacted authors of included studies in an attempt to obtain unpublished data or additional information of value for this review (Young 2011). Where a study had been registered and a relevant outcome was specified in the study protocol but no results were reported, we contacted the authors and sponsors to request study reports. We created a table to summarize the results for each outcome. We narratively explored the potential impact of missing data in our Discussion.
Assessment of heterogeneity
When we identified methodological heterogeneity, we did not pool results in a meta‐analysis. Instead, we qualitatively synthesized results by grouping studies with similar designs and interventions, and described existing methodological heterogeneity (e.g. use of different methods to assess outcomes). If study characteristics, methodology, and outcomes were sufficiently similar across studies, we quantitatively pooled results in a meta‐analysis and assessed heterogeneity by visually inspecting forest plots of included studies (location of point estimates and the degree to which CIs overlapped), and by considering the results of the Chi 2 test for heterogeneity and the I 2 statistic. We followed the guidance outlined in Higgins 2020 to quantify statistical heterogeneity using the I 2 statistic:
0% to 40% might not be important;
30% to 60% may represent moderate heterogeneity;
50% to 90% may represent substantial heterogeneity;
75% to 100%: considerable heterogeneity.
The importance of the observed value of the I 2 statistic depends on the magnitude and direction of effects, and the strength of evidence for heterogeneity (e.g. P value from the Chi 2 test, or a credibility interval for the I 2 statistic). If our I 2 value indicated that heterogeneity was a possibility and either the Tau 2 was greater than zero, or the P value for the Chi 2 test was low (less than 0.10), heterogeneity may have been due to a factor other than chance.
Possible sources of heterogeneity from the characteristics of host trials included:
design (randomized or other prospective intervention trial);
setting (primary care, tertiary care, community, etc.);
IMP risk category;
trial phase;
national or multinational;
support from a CTU or clinical research organization for host trial or evidence for an experienced research team; and
study population.
Possible sources of heterogeneity from the characteristics of methodology studies included:
study design;
components of outcome;
method of outcome assessment;
level of outcome (participant/site); and
classification of monitoring findings.
Due to high heterogeneity of studies, we used the random‐effects method (DerSimonian 1986), which incorporates an assumption that the different studies are estimating different, yet related, intervention effects. As described in Section 9.4.3.1 of the Cochrane Handbook for Systematic Reviews of Interventions (Higgins 2020), the method is based on the inverse‐variance approach, making an adjustment to the study weights according to the extent of variation, or heterogeneity, among the varying intervention effects. Due to the small number of studies included into the meta‐analyses and the high heterogeneity of the studies in the number of participants or sites included in the analysis we decided to use the inverse variance method. The inverse variance estimates the amount of variation across studies by comparing each study's result with an inverse‐variance fixed‐effect meta‐analysis result. This resulted in a more appropriate weighting of the included studies according to the extent of variation.
Assessment of reporting biases
To decrease the risk of publication bias affecting the findings of the review, we applied various search approaches using different resources. These included grey literature searching and checking reference lists (see Search methods for identification of studies). If 10 or more studies were available for a meta‐analysis, we would have created a funnel plot to investigate whether reporting bias may have existed unless all studies were of a similar size. If we noticed asymmetry, we would not have been able to conclude that reporting biases existed, but we would have considered the sample sizes and presence (and possible influence) of outliers and discussed potential explanations, such as publication bias or poor methodological quality of included studies, and performed sensitivity analyses.
Data synthesis
Data were synthesized using tables to compare different monitoring strategies. We also reported results by different study designs. This was accompanied by a descriptive summary in the Results . We used Review Manager 5 to conduct our statistical analysis and undertake meta‐analysis, where appropriate (Review Manager 2014).
If meta‐analysis of the primary or secondary outcomes was not possible, we reported the results qualitatively.
Two review authors (KK and MB) assessed the quality of the evidence. Based on the methods described in the Cochrane Handbook for Systematic Reviews of Interventions (Higgins 2020) and GRADE (Guyatt 2013a; Guyatt 2013b), we created summary of findings tables for the main comparisons of the review. We presented all primary and secondary outcomes outlined in the Types of outcome measures section. We described the study settings and number of sites addressing each outcome. For each assumed risk of bias cited, we provided a source and rationale, and we implemented the GRADE system to assess the quality of the evidence using GRADEpro GDT software or the GRADEpro GDT app (GRADEpro GDT). If meta‐analysis was not appropriate or the units of analysis could not be compared, we presented results in a narrative summary of findings table. In this case, the imprecision of the evidence was an issue of concern due to the lack of a quantitative effect measure.
Subgroup analysis and investigation of heterogeneity
If visual inspection of the forest plots, Chi 2 test, I 2 statistic, and Tau 2 statistic indicated that statistical heterogeneity might be present, we carried out exploratory subgroup analysis. A subgroup analysis was deemed appropriate if the included studies satisfied criteria assessing the credibility of subgroup analyses (Oxman 1992; Sun 2010).
The following was our a priori subgroup: monitoring strategies using very similar approaches and consistent outcomes.
Sensitivity analysis
We conducted sensitivity analyses restricted to:
peer‐reviewed and published studies only (i.e. excluding unpublished studies); and
studies at low risk of bias only (i.e. excluding non‐randomized studies and randomized trials without allocation concealment; Assessment of risk of bias in included studies).
Results
Description of studies
See: Characteristics of included studies and Characteristics of excluded studies tables.
Results of the search
See Figure 1 (flow diagram).
1.

Study flow diagram.
Our search of CENTRAL, PubMed, and Embase resulted in 3105 unique citations, 3103 citations after removal of duplicates and two additional citations that were identified through reference lists of relevant articles. After screening titles and abstracts, we sought the full texts of 51 records to confirm inclusion or clarify uncertainties regarding eligibility. Eight studies (14 articles) were eligible for inclusion. The results of six of these were published as full papers (Brosteanu 2017b; Fougerou‐Leurent 2019; Liènard 2006; Mealer 2013; Stenning 2018b; Wyman 2020), one study was published as an abstract only (Knott 2015), and one study was submitted for publication (Journot 2017). We did not identify any ongoing eligible studies or studies awaiting classification.
Included studies
Seven of the eight included studies were government or charity funded. The other was industry funded (Liènard 2006 ). The primary objectives were heterogeneous and included non‐inferiority evaluations of overall monitoring performance as well as single elements of monitoring (SDV, initiation visit); see Characteristics of included studies table and Table 7.
2. Method characteristics of monitoring strategies.
| Study | Risk assessment characteristics (follow‐up questions)/triggers or thresholds that induce on‐site monitoring (follow‐up questions) |
On‐site monitoring in the intervention group
|
Central or remote monitoring in the intervention group
|
People performing the monitoring |
| ADAMON (Brosteanu 2017a) | The classification was based on the 3 components:
K1 highest risk – K3 lowest risk |
K1: prestudy visit and initiation visit; existence informed consent and all further key data for
100% of participants; 100% SDV was made for 10% of the site's
participants, but ≥ 1 participant. Frequency of on‐site visits: depending on the site's recruitment and the catalogue of monitoring tasks (in general > 6 per year). K2:trial site with noticeable problems: existence and informed consent for all participants. Further key data for ≥ 50% of the site's participants . Trial site without noticeable problems: existence and informed consent for all participants. Further key data for ≥ 20% of the site's participants. All sites: a 100% SDV is made for 1 participant in the site's random sample (to ascertain any systematic errors). Frequency of on‐site visits: ≥ 3 per year (sites with problems)/in general ≥ 1 per year (sites without problems) K3: for participants recruited so far at the trial site: existence and informed consent for all participants. Further key data for ≥ 20% of the site's participants . Frequency of on‐site visits: 1 visit at each trial site. If problems or irregularities that exceeded a trial specific predefined tolerance limit were detected at a trial site, a prompt unplanned on‐site monitoring visit was made. ( Brosteanu 2009 ) |
Central monitoring activities:
( ADAMON study protocol 2008 ) |
Conduct of monitoring was the responsibility of the respective trial sponsor. For each monitoring strategy, disjoint teams of monitors were trained by the ADAMON team. The ADAMON team received the monitoring reports and supervised adherence to the monitoring manuals, providing additional training for monitors if required. |
| OPTIMON (Journot 2015) | Classification based on patient risk evaluation (the therapeutic intervention evaluated in the trial as compared to standard medical care –> intermediate risk); and identifying parameters of the intervention or procedures increasing the risk.
Lowest risk level A to highest level D |
Risk level A: no on‐site visit was planned. Remote management of correction requests. Site closure by letter. Risk level B: 1 on‐site visit, with verification of 100% of key data was carried out for 10% of participants. Corrections: during each visit concerning key points. Site closure by letter. Risk level C: 1 on‐site visit, with verification of 100% of key information was carried out for each site on a percentage of participants corresponding to 1 day of monitoring. Corrections: during each visit concerning key points. On‐site closure visit. Risk level A–C: setting up: before including the first participant.
Consent: blinded copy of the consent form upon inclusion and on‐site during the following visit or upon site closure. SAE reporting: systematically on‐site or remotely. Risk level D: full on‐site monitoring. Major problems will trigger an additional on‐site visit for levels B and C. (Major problem defined as: endangering participant safety [e.g. at‐risk intervention/investigation outside the protocol, inclusion of a participant who does not comply with an eligibility criterion]; endangering the quality of results [e.g. allocation of the randomization treatment, unblinding]; endangering participant's rights [e.g. consent, anonymity]; regulatory aspects [e.g. undeclared investigator].) |
The following aspects are particularly harmonized.
Consent form: the consent form has an additional sheet with a part blinded at the places for the surname and first name of the participant and his/her signature. This sheet must have been faxed to the methodology and management center on pre‐inclusion of the participant. |
Monitors were from the clinical research centers managing the trials; the monitoring outcome was validated by a blinded validation committee. |
| START (Wyman 2020) | No initial risk assessment or triggers, 1 large international study; sites randomized to local. |
Local monitoring: twice yearly, clinical site staff associated with START carried out specific quality assurance activities and reported findings to the statistical center.
|
|
Central monitoring was performed by the statistical center utilizing data in the central database on a continuous basis. On‐site monitoring of START was performed annually by a co‐ordinating center‐designated monitor, who were either co‐ordinating center staff or staff located in the country of the sites being monitored. |
| MONITORING ( Fougerou‐Leurent 2019 ) | Key data identified prior to the monitoring intervention (no full risk assessment) The regulatory or scientific key data (or both) verified by the targeted SDV were: informed consent, inclusion and exclusion criteria, main prognostic variables at inclusion (chosen with the principal investigator), primary endpoint, SAEs. |
Targeted SDV in which only regulatory or scientific key data (or both) were verified. Cumulative monitoring time on‐site reported 140 hours (vs 317 hours for full on‐site monitoring). |
No central monitoring performed. | A single experienced clinical researcher. A team from the University Hospital Rennes. |
| Mealer 2013 | No initial risk assessment or triggers of monitoring (participants due for an upcoming on‐site visit were checked remotely before the on‐site visit) | No on‐site visit in the intervention group, only remote access. Participants were assigned to having remote SDV performed 2–4 weeks prior to a scheduled on‐site visit – 100% remote SDV for 16 participants. Using a time diary that recorded start/stop time intervals, the total time required for the study monitor to verify a case report form was captured: adult network: 4.60 (SD 1.42) min with no on‐site vs 3.60 (SD 0.96) min with on‐site (P = 0.10); pediatric: 11.64 (SD 7.54) min with no on‐site vs 6.07 (SD 3.18) min with on‐site (P = 0.10). |
Remote SDV
|
Monitors were from the clinical (ARDS)/data (ChiLDReN) co‐ordinating centers. |
| Liènard 2006 | No initial risk assessment; however, study was terminated to prioritize certain sites for site initiation visits. | No on‐site initiation visit. | — | Monitoring was organized by the International Drug Development Institute. |
| TEMPER (Stenning 2018b) | On‐site visits were triggered by the evaluation of trigger scores. Automatic and manual trigger:
Triggers listed with abridged narrative in Diaz‐Montana et al. (2019). Highly recruiting sites were selected for triggered visits without matching. |
Monitoring usually included SDV on a sample of participants and review of consent forms, pharmacy documents and facilities, and investigator site files. The median number of participants undergoing SDV was 4 (IQR 3–5) with triggered vs 4 (IQR 3–5) with untriggered (paired t‐test P = 0.08). The frequency of on‐site visits was dependent on the evaluation of the trigger site scores in the trigger meetings held 3–6 monthly with the TEMPER team to choose triggered sites for monitoring. |
The software system TEMPER‐MS was developed in‐house at MRC CTU. It comprises a web application developed in ASP.NET web forms, an SQL server database which stored the data generated for TEMPER, reports developed in SQL server reporting services, and data entry screens for collecting monitoring visit data. A data extraction process was run in TEMPER‐MS:
After extraction, a trigger data report was generated and used in the trigger meeting to guide the prioritization of triggered sites. Trigger types included overall CRF return rate, return rate‐specific CRF, return rate participant consent form, data query rate (overall), data query rate (specific question), data query resolution time, SAE rate (high), SAE rate (low), protocol deviation (treatment), protocol deviation (eligibility), protocol deviation (procedure), protocol deviation (withdrawal rate), high recruitment, general concern.
|
Triggered visits were attended by TEMPER‐specific and trial‐specific monitors, untriggered visits only by TEMPER monitors. The same GCP and monitoring training was undertaken both by the trial team members attending visits and the monitors; the latter also received trial‐specific training. |
| Knott 2015 | Indicators included in the trigger score were 'duration of study visit' (time data were entered to form complete), computer times of data entry (patterns), 4 dimension of the low‐density lipoprotein measurements (different mean, SD between sites), measurement of non‐compliance (participant recorded as no longer taking study medication across sites), SAE reporting (reporting times lower than half the median of all sites), percentage of participants reporting muscle symptoms (dropped later), frequency of updates in non‐study medication. Fired triggers resulted in a score of 1 and high scoring sites were chosen for a monitoring visit in the triggered intervention group. | In site visits at high scoring sites resembled an extensive on‐site visit and in addition directed monitoring on‐site based on information from central statistical monitoring (2‐day visit). |
|
|
ARDS network: Acute Respiratory Distress Syndrome network; ART: antiretroviral therapy; ChiLDReN: Childhood Liver Disease Research Network; CRF: case report form; CTU: clinical trials unit; GCP: good clinical practice; IQR: interquartile range; min: minute; MRC: Medical Research Council; SAE: serious adverse event; SD: standard deviation; SDV: source data verification.
Overall, there were five groups of comparisons:
risk‐based monitoring guided by an initial risk assessment and information from central monitoring during study conduct versus extensive on‐site monitoring (ADAMON: Brosteanu 2017b; OPTIMON: Journot 2017);
central monitoring with triggered on‐site visits versus regular (untriggered) on‐site visits (Knott 2015; TEMPER: Stenning 2018b);
central statistical monitoring and local monitoring at sites with annual on‐site visits (untriggered) versus central statistical monitoring and local monitoring at sites only (START‐MV: Wyman 2020);
100% on‐site SDV versus remote SDV (Mealer 2013) or targeted SDV (MONITORING: Fougerou‐Leurent 2019); and
on‐site initiation visit versus no on‐site initiation visit (Liènard 2006).
Since there was substantial heterogeneity in the investigated monitoring strategies and applied study designs, a short overview of each included study is provided below.
General characteristics of individual included studies
1. Risk‐based versus extensive on‐site monitoring
The ADAMON study was a cluster randomized non‐inferiority trial comparing risk‐adapted monitoring with extensive on‐site monitoring at 213 sites participating in 11 international and national clinical trials (all in secondary or tertiary care and with adults and children as participants) (Brosteanu 2017b). It included only randomized, multicenter clinical trials (at least six trial sites) with a non‐commercial sponsor and had standard operating procedures (SOPs) for data management and trial supervision as well as central monitoring of at least basic extent. The prior risk analysis categorized trials into two of three different risk categories and trials were monitored according to a prespecified monitoring plan for their respective risk category. While the RAMP for the highest risk category was only marginally less extensive than full on‐site monitoring, risk‐based monitoring strategies for the lower risk categories relied on information from central monitoring and previous visits to determine the amount of on‐site monitoring. This resulted in a marked reduction of on‐site monitoring for sites without noticeable problems, limited to key data monitoring (20% to 50%). Only studies that had been classified as either intermediate risk or low risk based on the trial‐specific risk analysis (Brosteanu 2009) were included in the study. From the 11 clinical trials, 156 sites were audited by ADAMON‐trained auditors and included in the final analysis. The analysis included a meta‐analysis of results obtained within each trial.
The OPTIMON study was a cluster randomized non‐inferiority trial evaluating a risk‐based monitoring strategy within 22 national and international multicenter studies (Journot 2017). The 22 trials included 15 randomized trials, four cohort studies, and three cross‐sectional studies in the secondary care setting with adults, children, and older people as participants. All trials involved methodology and management centers or CTUs, had at least two years of experience in multicenter clinical research studies, and SOPs in place. A total of 83 sites were randomized to one of two different monitoring strategies. The risk‐based monitoring approach consisted of an initial risk assessment with four outcome levels (low, moderate, substantial, and high) and a standardized monitoring plan, where on‐site monitoring increased with the risk level of the trial (Journot 2011). The study aimed to assess whether such a risk‐adapted monitoring strategy provided results similar to those of the 100% on‐site strategy on the main study quality criteria, and, at the same time, improved other aspects such as timeliness and costs (Journot 2017). Only 759 participants from 68 sites were included in the final analysis, because of insufficient recruitment at 15 of the 83 randomized sites. The difference between strategies was evaluated by the proportion of participants without remaining major non‐conformities in all of the four assessed error domains (consent violation, SAE reporting violation, eligibility violation, and errors in primary endpoint assessment) assessed after trial monitoring by the OPTIMON team. The overall comparison of strategies was estimated using a generalized estimating equation (GEE) model, adjusted for risk level and intra‐site, intra‐patient correlation common to all sites.
2. Central monitoring with triggered on‐site visits versus regular (untriggered) on‐site visits
Knott 2015 was a monitoring study embedded in a large international multicenter trial evaluating the ability of central statistical monitoring procedures to identify sites with problems. Monitoring findings at sites during on‐site monitoring visits targeted as a result of central statistical monitoring procedures were compared to monitoring findings at sites chosen by regional co‐ordinating centers. Oversight of the clinical multicenter trial was supported by central statistical monitoring that identified high scoring sites as priority for further investigation and triggered a targeted on‐site visit. In order to compare targeted on‐site visits with regular on‐site visits, high scoring sites, and some low scoring sites in the same countries identified by the country teams as potentially problematic were visited. The decision about which of the low scoring sites would benefit most from an on‐site visit was based on prior experience of the regional co‐ordinating centers with the site. Twenty‐one sites (12 identified by central statistical monitoring, nine others as comparators) received a comprehensive monitoring visit from a senior monitor and the number of major and minor findings were compared between the two types of visits (targeted versus regular visit).
The TEMPER study (Stenning 2018b) was conducted in three ongoing phase III randomized multicenter oncology trials with 156 UK sites (Diaz‐Montana 2019a). All three included trials were in secondary care settings, were conducted and monitored by the MRC CTU at University College London, and were sponsored by the UK MRC and employed a triggered monitoring strategy. The study used a matched‐pair design to assess the ability of targeted monitoring to distinguish sites at which higher and lower rates of protocol or GCP violations (or both) would be found during site visits. The targeted monitoring strategy was based on trial data that were scrutinized centrally with prespecified triggers provoking an on‐site visit when certain thresholds had been crossed. In order to compare this approach to standard on‐site monitoring, a matching algorithm proposed untriggered sites to visit by minimizing differences in 1. number of participants and 2. time since first participant randomized, and by maximizing differences in trigger score. Monitoring data from 42 matched paired visits (84 visits) at 63 sites were included in the analysis of the TEMPER study. The monitoring strategy was assessed over all trial phases and the outcome was assessed by comparing the proportion of sites with one or more major or critical finding not already identified through central monitoring or a previous visit ('new' findings). The prognostic value of individual triggers was also assessed.
3. Central and local monitoring with annual on‐site visits versus central and local monitoring only
The START Monitoring Substudy was conducted within one large international, publicly funded randomized clinical trial (START – Strategic Timing of AntiRetroviral Treatment) (Wyman 2020). The monitoring substudy included 4371 adults from 196 secondary care sites in 34 countries. All clinical sites were associated with one of four INSIGHT co‐ordinating centers and central monitoring by the statistical center was done continuously using central databases. In addition, local monitoring of regulatory files, SDV, and study drug management was performed by site staff semi‐annually. In the monitoring substudy, sites were randomized to receive annual on‐site monitoring in addition to central and local monitoring or to central and local monitoring alone. The composite monitoring outcome consisted of eligibility violations, informed consent violations, intervention (use of antiretroviral therapy as initial treatment not permitted by protocol), primary endpoint and SAE reporting. In the analysis, a generalized estimation equation model with fixed effects to account for clustering was used and each component of the composite outcome was evaluated to interpret the relevance of the overall composite result.
4. Traditional 100% source data verification versus remote or targeted source data verification
Mealer 2013 was a pilot study on remote SDV in two national clinical trials' networks in which study participants were randomized to either remote SDV followed by on‐site verification or traditional on‐site SDV. Thirty‐two participants in randomized and other prospective clinical intervention trials within the adult trials network and the pediatric network were included in this monitoring study. A sample of participants in this secondary and tertiary care setting, who were due for an upcoming monitoring visit that included full SDV were randomized and stratified at each individual hospital. The five study sites had different health information technology infrastructures, resulting in different approaches to enable remote access and remote data monitoring. Only participants randomized to remote SDV had a previsit remote SDV performed prior to full SDV at the scheduled visit. Remote SDV was performed by validating the data elements captured on CRFs submitted to the co‐ordinating center using the same data verification protocols that were used during on‐site visits and remote monitors had telephone access to the local co‐ordinators. The primary outcome was the proportion of data values identified versus not identified for both monitoring strategies. As an additional economic outcome, the total time required for the study monitor to verify a case report item with either remote or on‐site monitoring form was analyzed.
The MONITORING study was a prospective cross‐over study comparing full SDV, where 100% of data was verified for all participants, and targeted SDV, where only key data were verified for all participants (Fougerou‐Leurent 2019). Data from 126 participants from one multinational and five national clinical trials managed by the Clinical Investigation Center at the Rennes University Hospital INSERM in France were included in the analysis. These studies included five randomized trials and one non‐comparative pilot single‐center phase II study taking place in either tertiary or secondary care units. Key data verified by the targeted SDV included informed consent, inclusion and exclusion criteria, main prognostic variables at inclusion, primary endpoint, and SAEs. The same CRFs were analyzed with full or targeted SDV. SDV of both strategies was followed by the same data‐management program, detecting missing data and checking consistency, on final data quality, global workload, and staffing costs. Databases of full SDV and targeted SDV after the data‐management process were compared and identified discrepancies were considered as remaining errors with targeted monitoring.
5. Systematic on‐site initiation visit versus on‐site initiation visit upon request
Liènard 2006 was a monitoring study within a large international randomized trial of cancer treatment. A total of 573 participants from 135 centers in France were randomized on a center level to receive an on‐site initiation visit for the study or no initiation visit. Although the study was terminated early, 68 secondary care centers, stratified by center type (private versus public hospital), had entered at least one participant into the study. The study was terminated because the sponsor decided to redirect on‐site monitoring visits to centers in which a problem had been identified. The aim of this monitoring study was to assess the impact of on‐site initiation visits on the following outcomes: participant recruitment, quantity and quality of data submitted to the trial co‐ordinating office, and participants' follow‐up time. On‐site initiation visits by monitors included review of the protocol, inclusion and exclusion criteria, safety issues, randomization procedure, CRF completion, study planning, and drug management. Investigators requesting on‐site visits were visited regardless of the allocated randomized group and results were analyzed by randomized group.
Characteristics of the monitoring strategies
There was substantial heterogeneity in the characteristics of the evaluated monitoring strategies. Table 7 summarizes the main components of the evaluated strategies.
Central monitoring components within the monitoring strategies
Use of central monitoring to trigger/adjust on‐site monitoring
Central monitoring plays an important role in the implementation of risk‐based monitoring strategies. An evaluation of site performance through continuous analysis of data quality can be used to direct on‐site monitoring to specific sites or support remote monitoring methods. A reduction in on‐site monitoring for certain trials was accompanied by central monitoring which also enabled additional on‐site interference in cases of low‐quality performance related to data quality, completeness, or patient rights and safety of specific sites. Six included studies used central monitoring methods to support their new monitoring strategy (ADAMON: Brosteanu 2017b; OPTIMON: Journot 2017; Knott 2015; Mealer 2013; TEMPER: Stenning 2018b; START Monitoring Substudy: Wyman 2020). Four of these studies used central monitoring information to trigger or delegate on‐site monitoring. In the ADAMON study, part of the monitoring plan for the lower‐ and medium‐risk studies comprised a regular assessment of the trial sites as 'with' or 'without noticeable problems' (Brosteanu 2017b). Classification as a site 'with noticeable problems' resulted in an increased number of on‐site visits per year. In the OPTIMON study, major problems (patient rights and safety, quality of results, regulatory aspects) triggered an additional on‐site visit for level B and C sites, or a first on‐site visit for level A sites (Journot 2017). All entered data were checked for completeness and consistency for all participants for all sites (OPTIMON study protocol 2008). The TEMPER study evaluated prespecified triggers for all sites in order to direct on‐site visits to sites with a high trigger score (Stenning 2018b). A trigger data report based on database exports was generated and used in the trigger meeting to guide the prioritization of triggered sites. Triggers were 'fired' when an inequality rule that reflected a certain threshold of data non‐conformities was evaluated as 'true'. Each trigger had an associated weight specifying its importance relative to other triggers, resulting in a trigger score for each site that was evaluated in trigger meetings and guided the prioritization of on‐site visits (Diaz‐Montana 2019a). In Knott 2015, all sites of the multicenter international trial received central statistical monitoring that identified high scoring sites as priority for further investigation. Scoring was applied every six months and a subsequent meeting of the central statistical monitoring group, including the chief investigator, chief statistician, junior statistician, and head of trial monitoring, and assessed high scoring sites and discussed trigger adjustments. Fired triggers resulted in a score of one and high scoring sites were chosen for a monitoring visit in the triggered intervention group.
Use of central monitoring and remote monitoring to support on‐site monitoring
In the ADAMON study, central monitoring activities included statistical monitoring with multivariate analysis, structured telephone interviews, site status in terms of participant numbers (number of included participants, number lost to follow‐up, screening failures, etc.) (Brosteanu 2017b). In the OPTIMON study, computerized controls were made on data entered from all participants in all investigation sites to check their completeness and consistency (Journot 2017). Following these controls, the clinical research associate sent the investigator requests for clarification or correction of any inconsistent data. Regular contact was maintained by telephone, fax, or e‐mail with the key people at the trial site to ensure that procedures were observed, and a report was compiled in the form of a standardized contact form.
Use of central monitoring without on‐site monitoring
In the START Monitoring Substudy, central monitoring was performed by the statistical center using data in the central database on a continuous basis (Wyman 2020). Reports summarizing the reviewed data were provided to all sites and site investigators and were updated regularly (daily, weekly, or monthly). Sites and staff from the statistical center and co‐ordinating centers also reviewed data summarizing each site's performance every six months and provided quantitative feedback to clinical sites on study performance. These reviews focused on participant retention, data quality, timeliness, and completeness of START Monitoring Substudy endpoint documentation, and adherence to local monitoring requirements. In addition, trained nurses at the statistical center reviewed specific adverse events and unscheduled hospitalizations for possible misclassification of primary START clinical events. Tertiary data, for example, laboratory values, were also reviewed by central monitoring (Hullsiek 2015).
Use of central monitoring for source data verification
In the Mealer 2013 pilot study, remote SDV validated the data elements captured on CRFs submitted to the co‐ordinating center. Data collection instruments for capturing study variables were developed and remote access for the study monitor was set up to allow secure online access to electronic records. The same data verification protocols were used as during on‐site visits and remote monitors had telephone access to local co‐ordinators.
Initial risk assessment
An initial risk assessment of trials was performed in the ADAMON (Brosteanu 2017b) and OPTIMON (Journot 2017) studies. The RAS used in the OPTIMON study was evaluated in the validity and reproducibility study, the Pre‐OPTIMON study, and was performed in three steps leading to four different risk categories that imply different monitoring plans. The first step related to the risk of the studied intervention in terms of product authorization, invasiveness of surgery technique, CE marking class, and invasiveness of other interventions, which led to a temporary classification in the second step. In the third step, the risk of mortality based on the procedures of the intervention and the vulnerability of the study population were additionally taken into consideration and may have led to an increase in risk level. The risk analysis used in the ADAMON study also had three steps. The first step involved an assessment of the risk associated with the therapeutic intervention compared to the standard of care. The second step was based on the presence of at least one of a list of risk indicators for the participant or the trial results. In the third step, the robustness of trial procedures (reliable and easy to assess primary endpoint, simple trial procedures) was evaluated. The risk analysis resulted in one of three risk categories entailing different basic on‐site monitoring measures in each of the three monitoring classes.
Excluded studies
We excluded 37 studies after full‐text screening (Characteristics of excluded studies table). We excluded articles for the following reasons: 21 studies did not compare different monitoring strategies and 16 were not prospective studies.
Risk of bias in included studies
Risk of bias in the included studies is summarized in Figure 2 and Figure 3. We assessed all studies for risk of bias following the criteria described in the Cochrane Handbook for Systematic Reviews of Interventions for randomized trials (Higgins 2020). In addition, we used the ROBINS‐I tool for the three non‐randomized studies (Fougerou‐Leurent 2019; Knott 2015; Stenning 2018b; results shown in Appendix 4).
2.

Risk of bias graph: review authors' judgments about each risk of bias item presented as percentages across all included studies.
3.

Risk of bias summary: review authors' judgments about each risk of bias item for each included study.
Allocation
Selection bias
Group allocation was at random and concealed in four of the eight studies with low risk of selection bias (Brosteanu 2017b; Journot 2017; Liènard 2006; Wyman 2020). Three were non‐randomized studies; two evaluated triggered monitoring (matched comparator design), where randomization was not practicable due to the dynamic process of the monitoring intervention (Knott 2015; Stenning 2018b), and the other used a prospective cross‐over design (the same CRFs were analyzed with full or targeted SDV) (Fougerou‐Leurent 2019). Since we could not identify an increased risk of bias for the prospective cross‐over design (intervention applied on same participant data), we rated the study at low risk of selection bias. Although the original investigators attempted to balance groups and to control for confounding in the TEMPER study (Stenning 2018b), we rated the design at high risk of bias according to the criteria described in the Cochrane Handbook for Systematic Reviews of Interventions (Higgins 2020). One study randomly assigned participant‐level data without any information about allocation concealment (unclear risk of bias) (Mealer 2013).
Blinding
Performance bias
In six studies, investigators, site staff, and data collectors of the trials were not informed about the monitoring strategy applied (Brosteanu 2017b; Journot 2017; Knott 2015; Liènard 2006; Stenning 2018b; Wyman 2020). However, blinding of monitors was not practicable in these six studies and thus we judged them at high risk of bias. In two studies, blinding of site staff was difficult because the interventions of monitoring involved active participation of trial staff (high risk of bias) (Fougerou‐Leurent 2019; Mealer 2013). It is unclear if the data management was blinded in these two studies.
Detection bias
Although monitoring could usually not be blinded due to the methodologic and procedural differences in the interventions, three studies performed a blinded outcome assessment (low risk of bias). In ADAMON, the audit teams verifying the monitoring outcomes of the two monitoring interventions were not informed of the sites' monitoring strategy and did not have access to any monitoring reports (Brosteanu 2017b). Audit findings were reviewed in a blinded manner by members of the ADAMON team and discussed with auditors, as necessary, to ensure that reporting was consistent with the ADAMON audit manuals (ADAMON study protocol 2008). In OPTIMON, the main outcome was validated by a blinded validation committee (Journot 2017). In TEMPER, the lack of blinding of monitoring staff was mitigated by consistent training on the trials and monitoring methods, the use of a common finding grading system, and independent review of all major and critical findings which was blind to visit type (Stenning 2018b). The other five studies provided no information on blinded outcome assessment or blinding of statistical center staff (unclear risk of bias) (Fougerou‐Leurent 2019; Knott 2015; Liènard 2006; Mealer 2013; Wyman 2020).
Incomplete outcome data
All eight included studies were at low risk of attrition bias (Brosteanu 2017b; Fougerou‐Leurent 2019; Journot 2017; Knott 2015; Liènard 2006; Mealer 2013; Stenning 2018b; Wyman 2020). However, ADAMON reported that "… one site refused the audit, and in the last five audited trials, 29 sites with less than three patients were not audited due to limited resources, in large sites (>45 patients), only a centrally preselected random sample of patients was audited. Arms are not fully balanced in numbers of patients audited (755 extensive on‐site monitoring and 863 risk‐adapted monitoring) overall" (Brosteanu 2017b). Another study was terminated prematurely due to slow participant recruitment, but the number of centers that randomized participants were equal in both groups (low risk of bias) (Liènard 2006).
Selective reporting
A design publication was available for one study (START Monitoring Substudy [two publications] Hullsiek 2015; Wyman 2020) and three studies published a protocol (ADAMON: Brosteanu 2017b; OPTIMON: Journot 2017; TEMPER: Stenning 2018b). Three of these studies reported on all outcomes described in the protocol or design paper in their publications (Brosteanu 2017b; Stenning 2018b; Wyman 2020), and one study has not been published as a full report yet, but provided outcomes stated in the protocol in the available conference presentation (Journot 2017). One study has only been published as an abstract to date (Knott 2015), but results of the prespecified outcomes were communicated to us by the study authors. For the three remaining studies, there were no protocol or registry entries available but the outcomes listed in the methods sections of their publications were all reported in the results and discussion sections (MONITORING: Fougerou‐Leurent 2019; Liènard 2006; Mealer 2013).
Other potential sources of bias
There was an additional potential source of bias for one study (MONITORING: Fougerou‐Leurent 2019). If the clinical research assistant spotted false or missing non‐key data when checking key data, he or she may have corrected the non‐key data in the CRF. This potential bias may have led to an underestimate of the difference between the two monitoring strategies. The full SDV CRF was considered without errors.
Effect of methods
In order to summarize the results of the eight included studies, we grouped them according to their intervention comparisons and their outcomes.
Primary outcome
Combined outcome of critical and major monitoring findings
Five studies, three randomized (ADAMON: Brosteanu 2017b; OPTIMON: Journot 2017; START Monitoring Substudy: Wyman 2020), and two matched pair (TEMPER: Stenning 2018b; Knott 2015), reported a combined monitoring outcome with four to six underlying error domains (e.g. eligibility violations). The ADAMON and OPTIMON studies defined findings as protocol and GCP violations that were not corrected or identified by the randomized monitoring strategy. The START Monitoring Substudy directly compared findings identified by the randomized monitoring strategies without a subsequent evaluation of remaining findings not corrected by the monitoring intervention. The classification into different severities of findings comprised different categories in three included studies that had different denominations (non‐conformity/major non‐conformity [Journot 2017], minor/major/critical [Brosteanu 2017b; Stenning 2018b]), but were consistent in the assessment of severity with regard to participant's rights and safety or to validity of study results. Only findings classified as major or critical (or both) were included in the primary comparison of monitoring strategies in the ADAMON and OPTIMON studies. The START Monitoring Substudy only assessed major violations, which constitutes the highest severity of findings with regard to participant's rights and safety or to validity of study results. All three of these studies defined monitoring findings for the most critical aspects in the domains for consent violations, eligibility violations, SAE reporting violations, and errors in endpoint assessment. Since the START Monitoring Substudy focused on only one trial, these descriptions of critical aspects are very trial specific compared to the broader range of critical aspects considered in ADAMON and OPTIMON with a combined monitoring outcome. Critical and major findings are defined according to the classification of GCP findings described in EMA 2017. For detailed information about the classification of monitoring findings in the included studies, see the Additional tables.
1. Risk‐based monitoring versus extensive on‐site monitoring
ADAMON and OPTIMON evaluated the primary outcome as the remaining combined major and critical findings not corrected by the randomized monitoring strategy. Pooling the results of ADAMON and OPTIMON for the proportion of trial participants with at least one major or critical outcome not corrected by the monitoring intervention resulted in a risk ratio of 1.03 with a 95% CI of 0.80 to 1.33 (below 1.0 would be in favor of the risk‐based strategy; Analysis 1.1; Figure 4). However, START Monitoring evaluated the primary outcome of combined major and critical findings as a direct comparison of monitoring findings during trial conduct and the comparison of monitoring strategies differed from the one assessed in ADAMON and OPTIMON. Therefore, we did not include START Monitoring in the pooled analysis, but reported its results separately below.
1.1. Analysis.
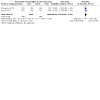
Comparison 1: Risk‐based versus on‐site monitoring – combined primary outcome, Outcome 1: Combined outcome of critical and major monitoring findings
4.

Forest plot of comparison: 1 Risk‐based versus on‐site monitoring – combined primary outcome, outcome: 1.1 Combined outcome of critical and major monitoring findings.
In the ADAMON study, 59.2% of participants with any major finding not corrected by the randomized monitoring strategy was identified in the risk‐based monitoring intervention group compared to 64.2% of participants with any major finding in the 100% on‐site group (Brosteanu 2017b). The analysis of the composite monitoring outcome in the ADAMON study using a random‐effects model, estimated with logistic regression and with sites as random effects accounting for clustering, resulted in evidence of non‐inferiority (point estimates near zero on the logit scale and all two‐sided 95% CIs clearly excluding the prespecified tolerance limit) (Brosteanu 2017a).
The OPTIMON study reported the proportions of participants without major monitoring findings (Journot 2017). When considering the proportions of participants with major monitoring findings, 40% of participants in the risk‐adapted monitoring intervention group had a monitoring outcome not identified by the randomized monitoring strategy compared to 34% in the 100% on‐site group. Analysis of the composite primary outcome via the GEE logistic model resulted in an estimated relative difference between strategies of 8% in favor of the 100% on‐site strategy. Since the upper one‐sided confidence limit of this difference was 22%, non‐inferiority with the set non‐inferiority margin of 11% could not be demonstrated.
2. Central monitoring with triggered on‐site visits versus regular (untriggered) on‐site visits
Two studies used a matched comparator design (Knott 2015; Stenning 2018b). In these new strategies, on‐site visits were triggered by the exceeding of prespecified trigger thresholds. The studies reported the number of triggered sites that had monitoring findings versus the number of control sites that had a monitoring finding.
We pooled these two studies for the primary combined outcome of major and critical monitoring findings including all error domains (Analysis 3.1; Figure 5) and also after excluding re‐consent for the TEMPER study (Analysis 4.1; Figure 6). Excluding the error domain "re‐consent" gave a risk ratio of 2.04 (95% CI 0.77 to 5.38) in favor of the triggered monitoring while including re‐consent findings gave a risk ratio of 1.83 (95% CI 0.51 to 6.55) in favor of the triggered monitoring intervention. These results provide some evidence that the trigger process was effective in guiding on‐site monitoring but the differences were not statistically significant.
3.1. Analysis.
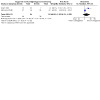
Comparison 3: Triggered versus untriggered on‐site monitoring, Outcome 1: Sites ≥ 1 major monitoring finding combined outcome
5.

Forest plot of comparison: 3 Triggered versus untriggered on‐site monitoring, outcome: 3.1 Sites one or more major monitoring finding combined outcome.
4.1. Analysis.
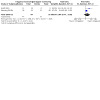
Comparison 4: Sensitivity analysis of the comparison: triggered versus untriggered on‐site monitoring (sensitivity outcome TEMPER), Outcome 1: Sites ≥ 1 major monitoring finding excluding re‐consent
6.

Forest plot of comparison: 4 Sensitivity analysis of the comparison: triggered versus untriggered on‐site monitoring (sensitivity outcome TEMPER), outcome: 4.1 Sites one or more major monitoring finding excluding re‐consent.
In the study conducted by Knott and colleagues, 21 sites (12 identified by central statistical monitoring, nine others as comparators) received an on‐site visit and 11 of 12 identified by central statistical monitoring had one or more major or critical monitoring finding (92%), while only two of nine comparator sites (22%) had a monitoring finding (Knott 2015). Therefore, the difference in proportions of sites with at least one major or critical monitoring finding was 70%. Minor findings indicative of 'sloppy practice' were identified at 10 of 12 sites in the triggered group and in two of nine in the comparator group. At one site identified by central statistical monitoring, there were serious findings indicative of an underperforming site. These results suggest that information from central statistical monitoring can help focus the nature of on‐site visits and any interventions required to improve site quality.
The TEMPER study identified 37 of 42 (88.1%) triggered sites with one or more major or critical finding not already identified through central monitoring or a previous visit and 34 of 42 (81.0%) matched untriggered sites with one of more major or critical finding (difference 7.1%, 95% CI –8.3% to 22.5%; P = 0.365) (Stenning 2018b). More than 70% of on‐site findings related to issues in recording informed consent, and 70% of these to re‐consent. The prespecified sensitivity analysis excluding re‐consent findings demonstrated a clear difference in event rate. When excluding re‐consent findings, the numbers reduced to 85.7% for triggered sites and 59.5% for untriggered sites (difference 26.2%, 95% CI 8.0% to 44.4%; P = 0.007). Thus, triggered monitoring in the TEMPER study did not satisfactorily distinguish sites with higher and lower levels of concerning on‐site monitoring findings. However, the prespecified sensitivity analysis excluding re‐consent findings demonstrated a clear difference in event rate. There was greater consistency between trials in the sensitivity and secondary analyses. In addition, there was some evidence that the trigger process used could identify sites at increased risk of serious concern: around twice as many triggered visits had one or more critical finding in the primary and sensitivity analyses.
3. Central and local monitoring with annual on‐site visits versus central and local monitoring only
The START Monitoring study (Wyman 2020), with 196 sites in a single large international trial, reported a higher proportion of participants with a monitoring finding detected in the on‐site monitoring group (6.4%) compared to the group with only central and local monitoring (3.8%), resulting in an odds ratio (OR) of 1.7 (95% CI 1.1 to 2.7; P = 0.03) (Wyman Engen 2020). However, it is not clearly reported if the findings within the groups were identified on‐site (on‐site visit or local monitoring) or by central monitoring and it was not verified whether central monitoring and local monitoring alone were unable to detect any violations or discrepancies within sites randomized to the intervention group. In addition, relatively few monitoring findings that would have impacted START results were identified by on‐site monitoring (no findings of participants who were inadequately consented, no findings of data alteration or fraud).
4. Traditional 100% source data verification versus remote or targeted source data verification
The two studies of targeted (MONITORING: Fougerou‐Leurent 2019) and remote (Mealer 2013) SDV reported findings only related to source documents. Different components of source data were assessed including consent verification as well as key data, but findings were reported only as a combined outcome. Minimal relative differences of parameters assessing the effectiveness of these methods in comparison to full SDV were identified in both studies. Both studies only assessed the SDV as the process of double checking that the same piece of information was written in the study database as well as in source documents. Processes, often referred to as Source Data Review, that confirm that the trial conduct complies with the protocol and GCP and ensure that appropriate regulatory requirements have been followed, are not included as study outcomes.
In the prospective cross‐over MONITORING study, comparing the databases of full SDV and target SDV, after the data management process, identified an overall error rate of 1.47% (95% CI 1.41% to 1.53%) and an error rate of 0.78% (95% CI 0.65% to 0.91%) on key data (Fougerou‐Leurent 2019). The majority of these discrepancies, considered as the remaining errors with targeted monitoring, were observed on baseline prognostic variables. The researchers further assessed the impact of the two different monitoring strategies on data‐management workload. While the overall number of queries was larger with the targeted SDV, there was no statistical difference for the queries related to key data (13 [standard deviation (SD) 16] versus 5 [SD 6]; P = 0.15) and targeted SDV generated fewer corrections on key data in the data‐management process step. Considering the increased workload for data management at least in the early setup phase of a targeted SDV strategy, monitoring and data management should potentially be viewed as a whole in terms of efficacy .
The pilot study conducted by Mealer and colleagues assessed the feasibility of remote SDV in two clinical trial networks (Mealer 2013). The accuracy and completeness of remote versus on‐site SDV was determined by analyzing the number of data values that were either identical or different in the source data, missing or unknown after remote SDV reconciliated to all data values identified via subsequent on‐site monitoring. The percentage of data values that could either not be identified or were missed via remote access were compared to direct on‐site monitoring in another group of participants. In the adult network, only 0.47% (95% CI 0.03% to 0.79%) of all data values assigned to monitoring could not be correctly identified via remote monitoring and in the ChiLDReN network, all data values were correctly identified. In comparison, three data values could not be identified in the only on‐site group (0.13%, 95% CI 0.03% to 0.37%). In summary, 99.5% of all data values were correctly identified via remote monitoring. Information on the difference in monitoring findings during the two SDV methods was not reported in the publication. The study showed that remote SDV was feasible despite marked differences in remote access and remote chart review policies and technologies.
5. On‐site initiation visit versus no on‐site initiation visit
There were no data on critical and major findings in Liènard 2006.
Secondary outcomes
Individual components of the primary outcome
Individual components of the primary outcome considered in the included studies were:
major eligibility violations;
major informed‐consent violations;
findings that raised doubt about the accuracy or credibility of key trial data and deviations of intervention from the trial protocol (with impact on patient safety or data validity);
errors in endpoint assessment; and
errors in SAE reporting.
1. Risk‐based versus extensive on‐site monitoring
In the ADAMON study, there was non‐inferiority for all of the five error domain components of the combined primary outcome: informed consent process, patient eligibility, intervention, endpoint assessment, and SAE reporting (Brosteanu 2017a). In the OPTIMON study, the biggest difference between monitoring strategies was observed for findings related to eligibility violations (12% of participants with major non‐conformity in eligibility error domain in the risk‐adapted group versus 6% of participants in the extensive on‐site group), while remaining findings related to informed consent were higher in the extensive on‐site monitoring group (7% of participants with major non‐conformity in informed consent error domain in the risk‐adapted group versus 10% of participants in the extensive on‐site group). In the OPTIMON study, consent form signature was checked remotely using a modified consent form and a validated specific procedure in the risk‐adapted strategy (Journot 2013). To summarize the domain specific monitoring outcomes of the ADAMON and OPTIMON studies, we analyzed the results of both studies within the four common error domains (Analysis 2.1, including unpublished results from OPTIMON). Pooling the results of the four common error domains (informed consent process, patient eligibility, endpoint assessment, and SAE reporting) resulted in a risk ratio of 0.95 (95% CI 0.81 to 1.13) in favor of the risk‐based monitoring intervention (Figure 7).
2.1. Analysis.
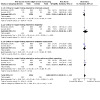
Comparison 2: Risk‐based versus on‐site monitoring – error domains of major findings, Outcome 1: Combined outcome of critical and major findings in 4 error domains
7.

Forest plot of comparison: 2 Risk‐based versus on‐site monitoring – error domains of major findings, outcome: 2.1 Combined outcome of major or critical findings in four error domains.
2. Central monitoring with triggered on‐site visits versus regular (untriggered) on‐site visits
In TEMPER, informed consent violations were more frequently identified by a full on‐site monitoring strategy (Stenning 2018b). During the study, but prior to the first analysis, the TEMPER Endpoint Review Committee recommended a sensitivity analysis to exclude all findings related to re‐consent, because these typically communicated minor changes in the adverse effect profile that could have been communicated without requiring re‐consent. Excluding re‐consent findings to evaluate the ability of the applied triggers to identify sites at higher risk for critical on‐site findings resulted in a significant difference of 26.2% (95% CI 8.0% to 44.4%; P = 0.007). Excluding all consent findings also resulted in a significant difference of 23.8% (95% CI 3.3% to 44.4%; P = 0.027).
There were no data on individual components of critical and major findings in Knott 2015.
3. Central and local monitoring with annual on‐site visits versus central and local monitoring only
In the START Monitoring Substudy, informed consent violations accounted for most of the primary monitoring outcomes in each group (41 [1.8%] participants in the no on‐site group versus 56 [2.7%] participants in the on‐site group) with an OR of 1.3 (95% CI 0.6 to 2.7; P = 0.46) (Wyman 2020). The most common consent violation was the most recently signed consent signature page being missing and that the surveillances for these consent violations by on‐site monitors varied. Within the START Monitoring Substudy, they had to modify the primary outcome component for consent violations prior to the outcomes assessment in February 2016 because documentation and ascertainment of consent violations were not consistent across sites. This suggests that these inconsistencies and variation between sites could have influenced the results of this primary outcome component. In addition, the follow‐up on consent violations by the co‐ordinating centers identified no individuals who had not been properly consented. The largest relative difference was for the findings related to eligibility (1 [0.04%] participant in the no on‐site group versus 12 [0.6%] participants in the on‐site group; OR 12.2, 95% CI 1.8 to 85.2; P = 0.01), but 38% of eligibility violations were first identified by site staff. In addition, a relative difference was reported for SAE reporting (OR 2.0, 95% CI 1.1 to 3.7; P = 0.02), while the differences for the error domains primary endpoint reporting (OR 1.5, 95% CI 0.7 to 3.0; P = 0.27) and protocol violation of prescribing initial antiretroviral therapy not permitted by START (OR 1.4, 95% CI 0.6 to 3.4; P = 0.47) as well as for the informed consent domain were small.
4. Traditional 100% source data verification versus remote or targeted source data verification
There were no data on individual components of critical and major findings in MONITORING (Fougerou‐Leurent 2019) or Mealer 2013.
5. Systematic on‐site initiation visit versus on‐site initiation visit upon request
There were no data on individual components of critical and major findings in Liènard 2006.
Impact of the monitoring strategy on participant recruitment and follow‐up
Only two included studies reported participant recruitment and follow‐up as an outcome for the evaluation of different monitoring strategies (Liènard 2006; START Monitoring Substudy: Wyman 2020).
Liènard 2006 assessed the impact of their monitoring approaches on participant recruitment and follow‐up in their primary outcomes. Centers were randomized to receive an on‐site initiation visit by monitors or no visit. There was no statistical difference in the number of recruited participants between these two groups (302 participants in the on‐site group versus 271 participants in the no on‐site group) as well as no impact of monitoring visits on recruitment categories (poor, average, good, and excellent). About 80% of participants were recruited in only 30 of 135 centers, and almost 62% in the 17 'excellent recruiters'. The duration of follow‐up at the time of analysis did not differ significantly between the randomized groups. However, the proportion of participants with no follow‐up at all was larger in the visited group than in the non‐visited group (82% in the on‐site group versus 70% in the no on‐site group).
Within the START Monitoring Substudy, central monitoring reports included tracking of losses to follow‐up (Wyman 2020). Losses to follow‐up were similar between groups (proportion of participants lost to follow‐up: 7.1% in the on‐site group versus 8.6% in the no on‐site group; OR 0.8, 95% CI 0.5 to 1.1), and a similar percentage of study visits were missed by participants in each monitoring group (8.6% in the on‐site group versus 7.8% in the no on‐site group).
Effect of monitoring strategies on resource use (costs)
Five studies provided data on resource use.
1. Risk‐based versus extensive on‐site monitoring
The ADAMON study reported that with extensive on‐site monitoring, the number of monitoring visits per participant and the cumulative monitoring time on‐site was higher compared to risk‐adapted monitoring by a factor of 2.1 (monitoring visits) and 2.7 (cumulative monitoring time) (ratios of the efforts calculated within each trial and summarized with the geometric mean) (Brosteanu 2017b). This difference was more pronounced for the lowest risk category, resulting in an increase of monitoring visits per participant by a factor of 3.5 and an increase in the cumulative monitoring time on‐site by a factor of 5.2. In the medium‐risk category, the number of monitoring visits per participant was higher by a factor of 1.8 and the cumulative monitoring time on‐site was higher by a factor of 2.1 for the extensive on‐site group compared to the risk‐based monitoring group.
In the OPTIMON study, travel costs were calculated depending on the distance and on‐site visits were assumed to require two days for one monitor, resulting in monitoring costs of EUR 180 per visit (Journot 2017). The costs were higher by a factor of 2.7 for the 100% on‐site strategy when considering travel costs only, and by a factor of 3.4 when considering travel and monitor costs.
2. Central monitoring with triggered on‐site visits versus regular (untriggered) on‐site visits
There were no data on resource use from TEMPER (Stenning 2018b) or Knott 2015.
3. Central and local monitoring with annual on‐site visits versus central and local monitoring only
In the START Monitoring Substudy, the economic consequence of adding on‐site monitoring to local and central monitoring was assessed by the person‐hours that on‐site monitors and co‐ordinating centers spent performing on‐site monitoring‐related activities and was estimated to be 16,599 person‐hours (Wyman 2020). With a salary allocation of USD 75 per hour for on‐site monitors, this equated to USD 1,244,925. With the addition of USD 790,467 international travel costs that were allocated for START monitoring, a total of USD 2,035,392 was attributed to on‐site monitoring. It has to be considered that there were four additional visits for cause in the on‐site group and six visits for cause in the no on‐site group.
4. Traditional 100% source data verification versus remote or targeted source data verification
For the MONITORING study, economic data were assessed in terms of time spent on SDV and data management with each strategy (Fougerou‐Leurent 2019). A query was estimated to take 20 minutes to handle for a data manager and 10 minutes for the clinical study co‐ordinator. Across the six studies, 140 hours were devoted by the clinical research associate to the targeted SDV versus 317 hours for the full SDV. However, targeted SDV generated 587 additional queries across studies, with a range of less than one (0.3) to more than eight additional queries per participant, depending on the study. In terms of time spent on these queries, based on an estimate of 30 minutes for handling a single query, the targeted SDV‐related additional queries resulted in 294 hours of extra time spent (mean 2.4 [SD 1.7] hours per participant).
For the cost analysis, the hourly costs for a clinical research associate were estimated to be EUR 33.00, a data‐manager was EUR 30.50, and a clinical study co‐ordinator was EUR 30.50. Based on these estimates, the targeted SDV strategy provided a EUR 5841 saving on monitoring but an additional EUR 8922 linked to the queries, totaling an extra cost of EUR 3081.
The study on remote SDV by Mealer 2013 only compared time consumed per data item and time per case report form for both included networks. Although there was no relevant difference (less than 30 seconds) per data item between the two strategies, more time was spent with remote SDV. However, this study did not consider travel time for monitors, and the delayed access and increased response time for the communication with study co‐ordinators affected the overall time spent. The authors proposed SOPs for prescheduling times to review questions by telephone and the introduction of a single electronic health record.
For both of the introduced SDV monitoring strategies, a gain of experience with these new methods would most likely translate into improved efficiency, making it difficult to estimate the long‐term resource use from these initial studies. For the risk‐based strategy in the OPTIMON study, a remote pre‐enrollment check of consent forms was a good preventive measure and improved quality of consent forms (80% of non‐conformities identified via remote checking). In general, remote SDV monitoring may reduce the frequency of on‐site visits or influence their timing ultimately decreasing the resources needed for on‐site monitoring.
5. Systematic on‐site initiation visit versus on‐site initiation visit upon request
There were no data on resource use from Liènard 2006.
Qualitative research data or process evaluations of the monitoring interventions
The Mealer 2013 pilot study of traditional 100% SDV versus remote SDV provided some qualitative information. This came from an informal post‐study interview of the study monitors and site co‐ordinators. These interviews revealed a high level of satisfaction with the remote monitoring process. None of the study monitors reported any difficulty with using the different electronic access methods and data review applications.
The secondary analyses of the TEMPER study assessed the ability of individual triggers and site characteristics to predict on‐site findings by comparing the proportion of visits with the outcome of interest (one major/critical finding) for triggered on‐site visits with regular (untriggered) on‐site visits (Stenning 2018b). This analysis also considered information of potential prognostic value obtained from questionnaires completed by the trials unit and site staff prior to the monitoring visits. Trials unit teams completed 90/94 pre‐visit questionnaires. There was no clear evidence of a linear relationship between the trial team ratings and the presence of major or critical findings, including or excluding consent findings (data not shown). A total of 76/94 sites provided pre‐visit site questionnaires. There was no evidence of a linear association between the chance of one major/critical finding and the number of active trials either per site or per staff member (data not shown). There was, however, evidence that the greater the number of different trial roles undertaken by the research nurse, the lower the probability of major/critical findings (number of research nurse roles (grouped) – proportion of one or more major or critical finding within the group, excluding re‐consent findings: less than 3: 94%; 4: 94%; 5: 80%; 6: 48% (P < 0.001; from Chi 2 test for linear trend) (Stenning 2018b, Online Supplementary Material Table S5).
Discussion
Summary of main results
We identified eight studies that prospectively compared different monitoring interventions in clinical trials. These studies were heterogeneous in design and content, and covered different aspects of new monitoring approaches. We identified no ongoing eligible studies.
Two large studies compared risk‐based versus extensive on‐site monitoring (ADAMON: Brosteanu 2017b; OPTIMON: Journot 2017), and the pooled results provided no evidence of inferiority of a risk‐based monitoring intervention in terms of major and critical findings, based on moderate certainty of evidence (Table 1). However, a formal demonstration of non‐inferiority would require more studies.
Considering the commonly reported error domains of monitoring findings (informed consent, eligibility, endpoint assessment, SAE reporting), we found no evidence for inferiority of a risk‐based monitoring approach in any of the error domains except eligibility. However, CIs were wide. To verify the eligibility of a participant usually requires extensive SDV, which might explain the potential difference in this error domain. We found a similar trend in the START Monitoring Substudy for the eligibility error domain. Expanding processes for remote SDV may improve the performance of monitoring strategies with a larger proportion of central and remote monitoring components. The OPTIMON study used an established process to remotely verify the informed consent process (Journot 2013), which was shown to be efficient in reducing non‐conformities related to informed consent. A similar remote approach for SDV related to eligibility before randomization might improve the performance of risk‐based monitoring interventions in this domain.
In the TEMPER study (Stenning 2018b) and the START Monitoring Substudy (Wyman 2020), most findings related to documenting the consent process. However, in the START Monitoring Substudy, there were no findings of participants whose consent process was inadequate and, in the ADAMON and the OPTIMON studies, findings in the informed consent process were lower in the risk‐adapted groups. Timely central monitoring of consent forms and eligibility documents with adequate anonymization (Journot 2013) may mitigate the effects of many consent form completion errors and identify eligibility violations prior to randomization. This is also supported by the recently published further analysis of the TEMPER study (Cragg 2021a), which suggested that most visit findings (98%) were theoretically detectable or preventable through feasible, centralized processes, especially all the findings relating to initial informed consent forms, thereby preventing patients starting treatment if there are any issues. Mealer 2013 assessed a remote process for SDV and found it to be feasible. Data values were reviewed to confirm eligibility and proper informed consent, to validate that all adverse events were reported, and to verify data values for primary and secondary outcomes. Almost all (99.6%) data values were correctly identified via remote monitoring at five different trial sites despite marked differences in remote access and remote chart review policies and technologies. In the MONITORING study, the number of remaining errors after targeted SDV (verified by full SDV) was very small for the overall data and even smaller for key data items (Fougerou‐Leurent 2019). These results provide evidence that new concepts in the process of SDV do not necessarily lead to a decrease in data quality or endanger patient rights and safety. Processes involved with on‐site SDV and often referred to as source data review, that confirm that the trial conduct complies with the protocol and GCP and ensure that appropriate regulatory requirements have been followed, have to be assessed separately. Evidence from retrospective studies evaluating SDV suggest that intensive SDV is often of little benefit to clinical trials, with any discrepancies found having minimal impact on the robustness of trial conclusions (Andersen 2015; Olsen 2016; Tantsyura 2015; Tudur Smith 2012a).
Furthermore, we found evidence that central monitoring can guide on‐site monitoring of trial sites via triggers. The prespecified sensitivity analysis of the TEMPER results excluding re‐consent findings (Stenning 2018b) and the results from Knott 2015 suggested that using triggers from a central monitoring process can identify sites at higher risk for major GCP violations. However, the triggers used in TEMPER may not have been ideal for all included trials and some tested triggers seemed not to have any prognostic value. Additional work is needed to identify more discriminatory triggers and should encompass work on key performance indicators (Gough 2016) and central statistical monitoring (Venet 2012). Since Knott 2015 focused on one study only, the triggers used in TEMPER were more trial specific. Developing trial specific triggers may lead to even more efficient triggers for on‐site monitoring. This may help to distinguish low performing sites from high performing sites and guide monitors to the most urgent problems within the identified site. Study‐specific triggers could even provoke specific monitoring activities (e.g. staff turnover indicates additional training, or data quality issues could trigger SDV activities). Central review of information across sites and time would help direct the on‐site resources to targeted SDV and activities best performed in‐person, for example, process review or training. We found no evidence that the addition of untriggered on‐site monitoring to central statistical monitoring assessed in the START Monitoring Substudy had a major impact on trial results or on participants' rights and safety (Wyman 2020). In addition, there was no evidence that the no on‐site group was inferior in the study‐specific secondary outcomes including the percentage of participants lost to follow‐up, timely data submission and query resolution, and the absolute number of monitoring outcomes in the START Monitoring Substudy was very low (Wyman 2020). This might be due to a study‐specific definition of critical and major findings in the monitoring plan and the presence of an established central monitoring system in both intervention groups of the study.
With respect to resource use, both studies evaluating a risk‐based monitoring approach showed that considerable resources could be saved with risk‐based monitoring (factor three to five; Brosteanu 2017b; Journot 2017). However, the potential increase in resource use at the co‐ordinating centers (including data management) was not considered in any of the analyses. The START Monitoring Substudy reported more than USD 2,000,000 for on‐site monitoring, taking into account the monitoring hours as well as the international travel costs (Wyman 2020). In both groups, central and local monitoring by site staff were performed to an equal extent, suggesting that there is no difference in the resources consumed by data management. The MONITORING study reported a reduction in cost of on‐site monitoring by the targeted SDV approach, but this was offset by an increase in data management resources due to queries (Fougerou‐Leurent 2019). This increase in data management resources may to some degree be due to the inexperience with the new approach of site staff and trial monitors. There was no statistical difference in number of queries related to key data between targeted SDV and full SDV. When an infrastructure for centralized monitoring and remote data checks is already established, a larger difference between resources spent on risk‐based compared to extensive on‐site monitoring would be expected. Setting up the infrastructure for automated checks, remote processes, and other data management structures as well as the training of monitors and data managers on a new monitoring strategy requires an upfront investment.
Only two studies assessed the impact of different monitoring strategies on recruitment and follow‐up. This is an important outcome for monitoring interventions because it is crucial for the successful completion of a clinical trial (Houghton 2020). The START Monitoring study found no significant difference in the percentage of participants lost to follow‐up between the on‐site and no on‐site groups (Wyman 2020). Also, on‐site initiation visits had no effect on participant recruitment in Liènard 2006. Closely monitoring site performance in terms of recruitment and losses to follow‐up could enable early action to support affected sites. Secondary qualitative analyses of the TEMPER study revealed that the experience of the research nurse had an impact on the monitoring outcomes (Stenning 2018b). The experience of the study team and the site staff might also be an important factor to be considered in a risk assessment of the study or in the prioritization of on‐site visits.
Overall completeness and applicability of evidence
Although we extensively searched for eligible studies, we only found one or two studies for specific comparisons of monitoring strategies. This very limited evidence base stands in stark contrast to the number of clinical trials run each year, each of which needs to perform monitoring in some form. None of the included studies reported on all primary and secondary outcomes specified for this review and most studies reported only a few. For instance, only one study reported on participant recruitment (Liènard 2006), and only two studies reported on participant retention (Liènard 2006; Wyman 2020). Some monitoring comparisons were nested in a single clinical trial limiting the generalizability of results (e.g. Knott 2015; START Monitoring: Wyman 2020 ). However, the OPTIMON (Journot 2017) and ADAMON (Brosteanu 2017b) studies included multiple and heterogeneous clinical trials for their comparison of risk‐based and extensive on‐site monitoring strategies increasing the generalizability of their results. The risk assessments of the ADAMON and OPTIMON studies differed in certain aspects (Table 7), but the main concept of categorizing studies according to their evaluated risk and adapting the monitoring requirements depending on the risk category was very similar. The much lower number of overall monitoring findings in the START study (based on one clinical trial only) compared with OPTIMON or ADAMON (involving multiple clinical trials) suggests that the trial context is crucial with respect to monitoring findings. Violations considered in the primary outcome of the START Monitoring Substudy were tailored to issues that could impact the validity of the trial's results or the safety of study participants. A definition of assets focused on the most critical aspects of a study that should be monitored closely is often missing in extensive monitoring plans and allows for some margin of interpretation by study monitors.
The TEMPER study introduced triggers that could direct on‐site monitoring and evaluated the prognostic values of these triggers (Stenning 2018b). Only three of the proposed triggers showed a significant prognostic impact across all three included trials. A set of triggers or performance measures of trial sites that are promising indicators for the need of additional support across a wide range of clinical trials are yet to be determined and trigger refinement is still ongoing. Triggers will to some degree always depend on the specific risks determined by the study procedures, management structure, and design of the study at hand. A combination of performance metrics appropriate for a large group of trials and study‐specific performance measures might be most effective. Multinational, multicenter trials might benefit the most from the directing of on‐site monitoring to sites that show low quality of performance. More studies in trials with large numbers of participants and sites, and trials covering diverse geographic areas, are needed to assess the value of centralized monitoring to assist with the identification of sites where additional support in terms of training is needed the most. This would lead to a more 'needs‐oriented' approach, so that clinical routine and study processes in well‐performing sites will not be unnecessarily interrupted. An overview of the progress of the ongoing trial in terms of site performance and other aspects such as recruitment and retention would also support the whole complex management processes of trial conduct in these large trials.
Since this review focused on prospective comparisons of monitoring interventions, the evidence from retrospective studies and reports from implementation studies is not included in the above results but is discussed below. We excluded retrospective studies because standardization of extracted data is not possible since data were collected before considering the analysis, especially for our primary outcome. However, trending analyses provide valuable information on outcomes such as improved data quality, recruitment, and follow‐up compliance, and thus demonstrate the effect of monitoring approaches on the overall trial conduct and success of the study. We considered the results from retrospective studies in our discussion of monitoring strategies but also pointed out the need to establish more SWAT to prospectively compare methods with a predefined mode of analysis.
Quality of the evidence
Overall, the certainty of this body of evidence on monitoring strategies for clinical intervention studies was low or very low for most comparisons and outcomes (Table 1; Table 2; Table 3; Table 4; Table 5). This was mainly due to imprecision of effect estimates because of small numbers of observations and indirectness because some comparisons were based on only one study nested in a single trial. The included studies varied considerably in terms of the reported outcomes with most studies reporting only some. In addition, the risk of bias varied across studies. A risk of performance bias was attributed to six of the included studies and was unclear in two studies. Since it was difficult to blind monitors to the different monitoring interventions, an influence of the monitors' performance on the monitoring outcomes could not be excluded in these studies. Two studies were at high risk of bias because of their non‐randomized design (Knott 2015 ; TEMPER: Stenning 2018b). However, since the intervention determined the selection of sites for an on‐site visit in the triggered groups, a randomized design was not practicable. In addition, the TEMPER study attempted to balance groups by design and controlled the risk of known confounding factors by using a matching algorithm. Therefore, the judgment of high risk of bias for TEMPER (Stenning 2018b) and Knott 2015 remains debatable. In the START Monitoring Substudy, no independent validation of remaining findings was performed after monitoring intervention. Therefore, it is uncertain if central monitoring without on‐site monitoring missed any major GCP violations and chance findings cannot be ruled out. More evidence is needed to evaluate the value of on‐site initiation visits. Liènard 2006 found no evidence that on‐site initiation visits affected participant recruitment, or data quality in terms of timeliness of data transfer and data queries. However, the informative value of the study was limited by its early termination and the small number of ongoing monitoring visits. In general, embedding methodology studies in clinical intervention trials provides valuable information for the improvement and adaptation of methodology guidelines and the practice of trials (Bensaaud 2020; Treweek 2018a; Treweek 2018b). Whenever randomization is not practicable in a methodology substudy, the attempt to follow a 'diagnostic study design' and minimize confounding factors as much as possible can increase the generalizability and impact of the study results.
Potential biases in the review process
We screened all potentially relevant abstracts and full‐text articles independently and in duplicate, assessed the risk of bias for included studies independently and in duplicate, and extracted information from included studies independently and in duplicate. We did not calculate any agreement statistics, but all disagreements were resolved by discussion. We successfully contacted authors from all included studies for additional information. Since we were unable to extract only the outcomes of the randomized trials included in the OPTIMON study (Journot 2015), we used the available data that included mainly randomized trials but also a few cohort and cross‐sectional studies. The focus of this review was on monitoring strategies for clinical intervention studies and including all studies from the OPTIMON study might introduce some bias. With regard to the pooling of study results, our judgment of heterogeneity might be debatable. The process of choosing comparator sites for triggered sites differed between the TEMPER study (Stenning 2018b) and Knott 2015. While both studies selected high scoring sites for triggered monitoring and low scoring sites as control, the TEMPER study applied a matching algorithm to identify sites that resembled the high scoring sites in certain parameters. In Knott 2015, comparator sites from the same countries were identified by the country teams as potentially problematic among the low scoring sites without a pairwise matching to a high scoring site. However, the principle of choosing sites for evaluation based on results from central statistical monitoring closely resembled methods used in the TEMPER study. Therefore, we decided to pool results from TEMPER and Knott 2015.
Agreements and disagreements with other studies or reviews
Although there are no definitive conclusions from available research comparing the effectiveness of risk‐based monitoring tools, the OECD advises clinical researchers to use risk‐based monitoring tools (OECD 2013). They emphasized that risk‐based monitoring should become a more reactive process where the risk profile and performance is continuously reviewed during trial conduct and monitoring practices are modified accordingly. One systematic review on risk‐based monitoring tools for clinical trials by Hurley and colleagues summarized a variety of new risk‐based monitoring tools for clinical trial monitoring that had been implemented in recent years by grouping common ideas (Hurley 2016). They did not identify a standardized approach for the risk assessment process for a clinical trial in the 24 included risk‐based monitoring tools, although the process developed by TransCelerate BioPharma Inc. has been replicated by six other risk‐based monitoring tools (TransCelerate BioPharma Inc 2014). Hurley and colleagues suggested that the responsiveness of the tool depends on their mode of administration (paper‐based, powered by Microsoft Excel, or operated as a Service as a system) and the degree of centralized monitoring involved (Hurley 2016). An electronic data capture system is beneficial to the efficient performance of centralized monitoring. However, to support the reactive process of risk‐based monitoring, tools should be able to incorporate information on risks provided by on‐site experiences from the study monitors. This is in agreement with our findings that a risk‐based monitoring tool should support both on‐site and centralized monitoring and that assessments are continuously reviewed during study conduct. Monitoring is most efficient when integrated as part of a risk‐based quality management system as also discussed by Buyse et al. (Buyse 2020), where a focus on trial aspects that have a potentially high impact on patient safety and trial validity and on systematic errors is emphasized.
From the five main comparisons that we identified through our review, four have also been assessed in available retrospective studies.
Risk‐based versus extensive on‐site monitoring: Kim and colleagues retrospectively reviewed three multicenter, investigator‐initiated trials that were monitored by a modified ADAMON method consisting of on‐site and central monitoring according to the risk of the trial (Kim 2021). Central monitoring was more effective than on‐site monitoring in revealing minor errors and showed comparable results in revealing major issues such as investigational product compliance and delayed reporting of SAEs. The risk assessment assessed by Higa and colleagues was based on the Risk Assessment Categorization Tool (RACT) originally developed by TransCelerate BioPharma Inc. (TransCelerate BioPharma Inc 2014), and was continuously adopted during the study based on results of centralized monitoring in parallel with site (on‐site/off‐site) monitoring. Mean on‐site monitoring frequency decreased as the study progressed and a Pharmaceutical and Medical Devices Agency inspection after study end found no significant non‐conformance that would have affected the study results and patient safety (Higa 2020).
Central monitoring with triggered on‐site visits versus regular on‐site visits: several studies have assessed triggered monitoring approaches that depend on individual study risks in trending analysis of their effectiveness. Diani and colleagues evaluated the effectiveness of their risk‐based monitoring approach in clinical trials involving implantable cardiac medical devices (Diani 2017). Their strategy included a data‐driven risk assessment methodology to target on‐site monitoring visits and they found significant improvement in data quality related to the three risk factors that were most critical to the overall compliance of cardiac rhythm management along with an improvement in a majority of measurable risk factors at the worst performing site quantiles. The methodology evaluated by Agrafiotis and colleagues is centered on quality by design, central monitoring, and triggered, adaptive on‐site and remote monitoring. The approach is based on a set of risk indicators that are selected and configured during the setup of each trial and are derived from various operational and clinical metrics. Scores from these indicators form the basis of an automated, data‐driven recommendation on whether to prioritize, increase, decrease, or maintain the level of monitoring intervention at each site. They assessed the trending impact of their new approach by retrospectively analyzing the change in risk level later in the trials. All 12 included trials showed a positive effect in risk level change and results were statistically significant in eight of them (Agrafiotis 2018). The evaluation of a new trial management method for monitoring and managing data return rates in a multicenter phase III trial performed by Cragg and colleagues adds to the findings of increased efficiency by prioritizing sites for support (Cragg 2019). Using an automated database report to summarize the data return rate, overall and per center, enabled the early notification of centers whose data return rate appeared to be falling, or crossed the predefined acceptability threshold of data return rate. Concentrating on the gradual improvement of centers having persistent data return problems, resulted in an increase in the overall data return rate and return rates above 80% in all centers. These results agree with the evidence we found for the effectiveness of a triggered monitoring approach evaluated in TEMPER (Stenning 2018b) and Knott 2015, and emphasize the need for study‐specific performance indicators. In addition, the data‐driven risk assessment implemented by Diani 2017 highlighted key focus areas for both on‐site and centralized monitoring efforts and enabled an emphasis of site performance improvements where it is needed the most. Our findings agree with retrospective assessments that focusing on the most critical aspects of a trial and guiding monitoring resources to trial sites in need of support may be efficient to improve the overall trial conduct.
Central statistical v ersu s on‐site monitoring: one retrospective analysis of the potential of central monitoring to completely replace on‐site monitoring performed by trial monitors showed that the majority of reviewed on‐site findings could be identified using central monitoring strategies (Bakobaki 2012). One recent scoping review focused on methods used to identify sites of 'concern', at which monitoring activity may be targeted, and consequently sites 'not of concern', monitoring of which may be reduced or omitted (Cragg 2021b). It included all original reports describing methods for using centrally held data to assess site‐level risk described in a reproducible way. Thus, in agreement with our research, they only identified one full report of a study (Stenning 2018b) that prospectively assessed the methods' ability to target on‐site monitoring visits to most problematic sites. However, through contacting the authors of Knott 2015, which is only available as an abstract, we gained more detailed information on the methodology of the study and were able to include the results in our review. In contrast to our review, Cragg 2021b included retrospective assessments (in comparison to on‐site monitoring, effect on data quality or other trial parameters) as well as case studies, illustrations of methods on data, assessment of methods' ability to identify simulated problem sites, or known problems in real trial data. Thus, it constitutes an overview of methods introduced to the research community, and simultaneously underlines the lack of evidence for their efficacy or effectiveness.
Traditional 100% SDV versus targeted or remote SDV: in addition to these retrospective evaluations of methods to prioritize sites and the increased use of centralized monitoring methods, several studies retrospectively assessed the value and effectiveness of remote monitoring methods including alternative SDV methods. Our findings related to a reduction of 100% on‐site SDV in Mealer 2013 and the MONITORING study (Fougerou‐Leurent 2019) are in agreement with Tudur Smith 2012b, which assessed the value of 100% SDV in a cancer clinical trial. In their retrospective comparison of data discrepancies and comparative treatment effects obtained following 100% SDV to those based on data without SDV, the identified discrepancies for the primary outcome did not differ systematically across treatment groups or across sites and had little impact on trial results. They also suggested that a focus of SDV on less‐experienced sites or sites with differing reporting characteristics of SDV‐related information (e.g. SAE reporting compared to other sites), with provision of regular training may be more efficient. Similarly, the study by Anderson and colleagues analyzed error rates of data from three randomized phase III trials monitored with a combination of complete SDV or partial SDV that were subjected to post hoc complete SDV (Andersen 2015). Comparing partly and fully monitored trial participants, there were only minor differences between variables of major importance to efficacy or safety. In agreement with these studies, the study by Embleton‐Thirsk and colleagues showed that the impact of extensive retrospective SDV and further extensive quality checks in a phase III academic‐led, international, randomized cancer trial was minimal (Embleton‐Thirsk 2019). Besides the potential reduction in SDV, remote monitoring systems for full or partial SDV are becoming more relevant during the COVID‐19 pandemic and are currently evaluated in various forms. Another recently published study assessed the clinical trial monitoring effectiveness of remote risk‐based monitoring versus on‐site monitoring with 100% SDV (Yamada 2021). It used a cloud‐based remote monitoring system that does not require site‐specific infrastructure for remote monitoring since it can be downloaded onto mobile devices as an application and involves the upload of photographs. Remote monitoring was focused on risk items that could lead to critical data and process errors, determined using the risk assessment and categorization tool developed by TransCelerate BioPharma Inc. (TransCelerate BioPharma Inc 2014). Using this approach, 92.9% (95% CI 68.5% to 98.7%) of critical process errors could be detected by remote risk‐based monitoring. With a retrospective review of monitoring reports, Hirase and colleagues supported an increased efficiency of monitoring and resources used by a combination of on‐site and remote monitoring using a web‐conference system (Hirase 2016).
The qualitative finding in TEMPER (Stenning 2018b) that the experience of the research nurse had an impact on the monitoring outcomes is also reflected in the retrospective study by von Niederhäusern and colleagues, which found that one of the factors associated with lower numbers of monitoring findings was experienced site staff and concluded that the human factor was underestimated in the current risk‐based monitoring approach (von Niederhausern 2017).
Authors' conclusions
Implication for systematic reviews and evaluations of healthcare.
We found no evidence for inferiority of a risk‐based monitoring approach compared to extensive on‐site monitoring in terms of critical and major monitoring findings. The overall certainty of the evidence for this outcome was moderate. The initial risk assessment of a study can facilitate a reduction of monitoring. However, it might be more efficient to use the outcomes of a risk assessment to guide on‐site monitoring in terms of prioritizing sites with conspicuously low performance quality of critical assets identified by the risk assessment. Some triggers that were used in the TEMPER study (Stenning 2018b) and Knott 2015 could help identify sites that would benefit the most from an on‐site monitoring visit. Trigger refinement and inclusion of more trial‐specific triggers will, however, be necessary. The development of remote access to trial documentation may further improve the impact of central triggers. Timely central monitoring of consent forms or eligibility documents with adequate anonymization and data protection may mitigate the effects of many formal documentation errors. More studies are needed to assess the feasibility of eligibility and informed consent‐related assessment and remote contact to the site teams in terms of data security and effectiveness without on‐site review of documents. The COVID‐19 pandemic has resulted in innovative monitoring approaches in the context of restricted on‐site monitoring that also includes the remote monitoring of consent forms and other original records as well as compliance to study procedures usually verified on‐site. Whereas central data monitoring and remote monitoring of documents were formerly applied to improve efficiency, it now has to substitute on‐site monitoring to comply with pandemic restrictions, making evaluated monitoring methods in this review even more valuable to the research community. Both the Food and Drug Administration (FDA) and European Medicines Agency have provided guidance on aspects of clinical trial conduct during the COVID‐19 pandemic including remote site monitoring, handling informed consent in remote settings, and the importance of maintaining data integrity and audit trail (EMA 2021; FDA 2020). The FDA has also adopted contemporary approaches to consent involving telephone calls or video visits in combination with a witnessed signing of the informed consent (FDA 2020). Experiences on new informed consent processes and advice on how remote monitoring and centralized methods can be used to protect the safety of patients and preserve trial integrity during the pandemic have been published and provide additional support for sites and sponsors (Izmailova 2020; Love 2021; McDermott 2020). This review may support study teams faced by pandemic‐related restrictions with information on evaluated methods that focus primarily on remote and centralized methods. It will be important to provide more management support for clinical trials in the academic setting and develop new recruitment strategies. In our review, low certainty of evidence suggested that initiation visits or more frequent on‐site visits were not associated with increased recruitment or retention of trial participants. Consequently, trial investigators should plan for other, more trial‐specific strategies to support recruitment and retention. To what extent recruitment or retention can be improved through real‐time central monitoring remains to be evaluated. Research has emphasized the need for evidence on effective recruitment strategies (Treweek 2018b), and new flexible recruitment approaches initiated during the pandemic may add to this. During the COVID‐19 pandemic, both social media and digital health platforms have been leveraged in novel ways to recruit heterogeneous cohorts of participants (Gaba 2020). In addition, the pandemic underlines the need for a study management infrastructure supported by central data monitoring and remote communication (Shiely 2021). One retrospective study at the Beijing Cancer Hospital assessed the impact of their newly implemented remote management model on critical trial indicators: protocol compliance rate, rate of loss to follow‐up, rate of participant withdrawal, rates of disease progression and mortality, and detection rate of monitoring problems (Fu 2021). The measures implemented after the first COVID‐19 outbreak led to significantly higher rates of protocol compliance and significantly lower rates of loss to follow‐up or withdrawal after the second outbreak compared to the first, without affecting rates of disease progression or mortality. In general, new experiences with electronic methods initiated throughout the COVID‐19 pandemic might facilitate development and even improvement of clinical trial management.
Implication for methodological research.
Several new monitoring interventions were introduced in recent years. However, the evidence base gathered for this Cochrane Review is limited in terms of quantity and quality. Ideally, for each of the five identified comparisons (risk‐based versus extensive on‐site monitoring, central statistical monitoring with triggered on‐site visits versus regular [untriggered] on‐site visits, central and local monitoring with annual on‐site visits versus central and local monitoring only, traditional 100% source data verification [SDV] versus remote or targeted SDV, and on‐site initiation visit versus no on‐site initiation visit) more randomized monitoring studies nested in clinical trials and measuring effects on all outcomes specified in this review are necessary to draw more reliable conclusions. The development of triggers to guide on‐site monitoring while centrally monitoring incoming data is ongoing and different triggers might be used in different settings. In addition, more evidence on risk indicators that help to identify sites with problems or the prognostic value of triggers is needed to further optimize central monitoring strategies. Future methodological research should particularly evaluate approaches with an initial trial‐specific risk assessment followed by close central monitoring and the possibility for triggered and targeted on‐site visits during trial conduct. Outcome measures such as the impact on recruitment, retention, and site support should be emphasized in further research and the potential of central monitoring methods to support the whole study management process needs to be evaluated. Directing monitoring resources to sites with problems independent of data quality issues (recruitment, retention) could promote the role of experienced study monitors as a site support team in terms of training and advice. The overall progress in conduct and success of a trial should be considered in the evaluation of every new approach. The fact that most of the eligible studies identified for this review are government or charity funded suggests a need for industry‐sponsored trials to evaluate their monitoring and management approaches. This could particularly promote the development and evaluation of electronic case report form‐based centralized monitoring tools, which require substantial resources.
What's new
| Date | Event | Description |
|---|---|---|
| 3 January 2022 | Amended | Minor edits made |
History
Protocol first published: Issue 12, 2019 Review first published: Issue 12, 2021
Acknowledgements
We thank the monitoring team of the Department of Clinical Research at the University Hospital Basel, including Klaus Ehrlich, Petra Forst, Emilie Müller, Madeleine Vollmer, and Astrid Roesler, for sharing their experience and contributing to discussions on monitoring procedures. We would further like to thank the information specialist Irma Klerings for peer reviewing our electronic database searches.
Appendices
Appendix 1. Search strategies CENTRAL, PubMed, and Embase
Cochrane Review on monitoring strategies: search strategies Terms shown in italics were different compared to the strategy in PubMed.
CENTRAL
3 May 2019: 842 hits (836 trials/6 reviews); Update 16 March 2021: 1044 hits (monitor* NEAR/2 (site OR risk OR central*)): ti,ab OR "monitoring strategy":ti,ab OR "monitoring method":ti,ab OR "monitoring technique":ti,ab OR "triggered monitoring":ti,ab OR "targeted monitoring":ti,ab OR "risk proportionate":ti,ab OR "trial monitoring":ti,ab OR "study monitoring":ti,ab OR "statistical monitoring":ti,ab
PubMed 13 May 2019: 1697 hits; Update 16 March 2021: 2198 hits
("on site monitoring"[tiab] OR "on‐site monitoring"[tiab] OR "monitoring strategy"[tiab] OR "monitoring method"[tiab] OR "monitoring technique"[tiab] OR "triggered monitoring"[tiab] OR "targeted monitoring"[tiab] OR "risk‐adapted monitoring"[tiab] OR "risk adapted monitoring"[tiab] OR "risk‐based monitoring"[tiab] OR "risk based monitoring"[tiab] OR "risk proportionate"[tiab] OR "centralized monitoring"[tiab] OR "centralised monitoring"[tiab] OR "statistical monitoring"[tiab] OR "central monitoring"[tiab] OR “trial monitoring”[tiab] OR “study monitoring”[tiab]) AND ("Clinical Studies as Topic"[Mesh] OR (("randomized controlled trial"[pt] OR controlled clinical trial[pt] OR trial*[tiab] OR study[tiab] OR studies[tiab]) AND (conduct*[tiab] OR practice[tiab] OR manag*[tiab] OR standard*[tiab] OR harmoni*[tiab] OR method*[tiab] OR quality[tiab] OR performance[tiab])))
Embase (via Elsevier) 13 May 2019: 1245 hits; Update 16 March 2021: 1494 hits ('monitoring strategy':ti,ab OR 'monitoring method':ti,ab OR 'monitoring technique':ti,ab OR 'triggered monitoring':ti,ab OR 'targeted monitoring':ti,ab OR 'risk‐adapted monitoring':ti,ab OR 'risk adapted monitoring':ti,ab OR 'risk based monitoring'/exp OR 'risk proportionate':ti,ab OR 'trial monitoring':ti,ab OR 'study monitoring':ti,ab OR 'statistical monitoring':ti,ab OR (monitor* NEAR/2 (site OR risk OR central*)):ti,ab) AND ('clinical trial (topic)'/exp OR ((trial* OR study OR studies) NEAR/3 (conduct* OR practice OR manag* OR standard* OR harmoni* OR method* OR quality OR performance)):ti,ab)
Appendix 2. Grey literature search
Sources:
OpenSIGLE
(Discipline: Medicine)
British Library
Direct Plus
BIOSIS databases ( www.biosis.org/ ).
Web of Science
Citation Index
(Conferences)
Web of Science (Core Collection) Proceedings Paper, Meeting Abstracts
Handsearch of References in identifies articles
WHO Registry (ICTRP portal)
ECRIN
Risk‐based Monitoring Toolbox
Appendix 3. Data collection form content
1. General Information
Name of person extracting data, report title, report ID, publication type, study funding source, possible conflicts of interest.
2. Methods and study population (trials)
Study design, duration study, design of host trials, characteristics of host trials (primary care, tertiary care, allocated …), total number of sites randomized, total number of sites included in the analysis, stratification of sites. Example: stratified on risk level, country, projected enrolment etc., inclusion/exclusion criteria for host trials.
3. Risk of bias assessment
Random sequence generation, allocation concealment, blinding of outcome assessment, performance bias, incomplete outcome data, selective outcome reporting, other bias, validated outcome assessment – grading of findings (minor, major, critical).
4. Intervention groups
Number randomized to group, duration of intervention period, was there an initial risk assessment preceding the monitoring plan?, classification of trials/sites, risk assessment characteristics, differing monitoring plan for risk classification groups, what was the extent of on‐site monitoring in the risk‐based monitoring group?, triggers or thresholds that induced on‐site monitoring, targeted on‐site monitoring visits or according to the original trials monitoring plan?, timing (frequency of monitoring visits, frequency of central/remote monitoring), number of monitoring visits per participant, cumulative monitoring time on‐site, mean number of monitoring visits per site, delivery (procedures used for central monitoring structure/components of on‐site monitoring triggers/thresholds), who performed the monitoring (part of study team, trial staff – qualification of monitors), degree of source data verification (median number of participants undergoing source data verification), co‐interventions (site/study‐specific co‐interventions).
5. Outcomes
Primary outcome, secondary outcomes, components of primary outcome (finding error domains), predefined level of outcome variables (major, critical, others, upgraded)?, time points measured (end of trial/during trial), factors impacting the outcome measure, person performing the outcome assessment, was outcome/tool validated?, statistical analysis of outcome data, imputation of missing data.
6. Results
Comparison of interventions, outcome, subgroup (error domains), postintervention or change from baseline?, unit of analysis, statistical methods used and appropriateness of these methods.
7. Other information (key conclusions of study authors).
Appendix 4. Risk of bias assessment for non‐randomized studies
|
Preintervention Domain |
Study | Judgment | Support for judgment | |
| Confounding | Stenning 2018b | Low risk of bias | Decision for on‐site visit dependent on the same triggers within 1 study. Confounding was minimized by matched pair design. | |
| Knott 2015 | Moderate risk of bias | No matching of sites, confounding by other factors possible. | ||
| Fougerou‐Leurent 2019 | Low risk of bias | Same CRF was analyzed with different methods. | ||
| Selection bias | Stenning 2018b | Low risk of bias | Matching of comparator sites by algorithm. Same triggers used for all sites within 1 study. | |
| Knott 2015 | Serious risk of bias | Choice of comparator only matched by region, choice not entirely dependent on trigger scores. | ||
| Fougerou‐Leurent 2019 | Low risk of bias | Prospective cross‐over design: the same case report forms were analyzed with full or targeted source data verification. | ||
| Information bias | Stenning 2018b | Moderate risk of bias | Monitoring was not blinded to intervention. | |
| Knott 2015 | Moderate risk of bias | Monitoring was not blinded to intervention. | ||
| Fougerou‐Leurent 2019 | Serious risk of bias | Monitoring was not blinded. If the clinical research associate spotted false or missing non‐key data when checking a key data, they may have corrected the non‐key data in the case report form. This bias may have led to underestimate the difference between the 2 monitoring strategies. The full source data verification case report form was considered without errors. |
||
| Postintervention | ||||
| Confounding | Stenning 2018b | Low risk of bias | The same monitoring extend was performed in both groups, no sign for non‐adherence to the intervention. | |
| Knott 2015 | Low risk of bias | The same monitoring extend was performed in both groups, no sign for non‐adherence to the intervention. | ||
| Fougerou‐Leurent 2019 | Low risk of bias | Cross‐over design, time factor did not influence results. | ||
| Selection bias | Stenning 2018b | Low risk of bias | All follow‐up considered. | |
| Knott 2015 | Low risk of bias | All follow‐up considered. | ||
| Fougerou‐Leurent 2019 | Low risk of bias | All follow‐up considered. | ||
| Information bias | Stenning 2018b | Moderate risk of bias | Judgment of findings not blinded. | |
| Knott 2015 | Moderate risk of bias | Judgment of findings not blinded. | ||
| Fougerou‐Leurent 2019 | Moderate risk of bias | The same data management program (missing data, consistency, protocol deviations) was subsequently implemented in each strategy by central data management staff. No information on blinding. | ||
| Reporting bias | Stenning 2018b | Low risk of bias | Several reports published, all outcomes reported. | |
| Knott 2015 | Moderate risk of bias | No published protocol and no full report published. | ||
| Fougerou‐Leurent 2019 | Low risk of bias | Full report published, all outcomes of method section reported. | ||
Data and analyses
Comparison 1. Risk‐based versus on‐site monitoring – combined primary outcome.
| Outcome or subgroup title | No. of studies | No. of participants | Statistical method | Effect size |
|---|---|---|---|---|
| 1.1 Combined outcome of critical and major monitoring findings | 2 | 2377 | Risk Ratio (IV, Random, 95% CI) | 1.03 [0.81, 1.32] |
Comparison 2. Risk‐based versus on‐site monitoring – error domains of major findings.
| Outcome or subgroup title | No. of studies | No. of participants | Statistical method | Effect size |
|---|---|---|---|---|
| 2.1 Combined outcome of critical and major findings in 4 error domains | 2 | 9508 | Risk Ratio (IV, Random, 95% CI) | 0.95 [0.81, 1.13] |
| 2.1.1 Critical or major finding related to informed consent | 2 | 2377 | Risk Ratio (IV, Random, 95% CI) | 0.80 [0.63, 1.02] |
| 2.1.2 Critical or major finding related to eligibility | 2 | 2377 | Risk Ratio (IV, Random, 95% CI) | 1.31 [0.56, 3.07] |
| 2.1.3 Critical or major finding related to endpoint assessment | 2 | 2377 | Risk Ratio (IV, Random, 95% CI) | 0.91 [0.63, 1.32] |
| 2.1.4 Critical or major finding related to serious adverse effect reporting | 2 | 2377 | Risk Ratio (IV, Random, 95% CI) | 1.01 [0.83, 1.23] |
Comparison 3. Triggered versus untriggered on‐site monitoring.
| Outcome or subgroup title | No. of studies | No. of participants | Statistical method | Effect size |
|---|---|---|---|---|
| 3.1 Sites ≥ 1 major monitoring finding combined outcome | 2 | 105 | Risk Ratio (IV, Random, 95% CI) | 1.83 [0.51, 6.55] |
Comparison 4. Sensitivity analysis of the comparison: triggered versus untriggered on‐site monitoring (sensitivity outcome TEMPER).
| Outcome or subgroup title | No. of studies | No. of participants | Statistical method | Effect size |
|---|---|---|---|---|
| 4.1 Sites ≥ 1 major monitoring finding excluding re‐consent | 2 | 105 | Risk Ratio (IV, Random, 95% CI) | 2.04 [0.77, 5.38] |
Characteristics of studies
Characteristics of included studies [ordered by study ID]
Brosteanu 2017b.
| Study characteristics | ||
| Methods | Design: cluster randomized study Duration of monitoring study: 7 years (due to funding and time limitations, audits were performed in 4 trials after last participant was recruited but before the end of trial; in 2 trials, accrual was still ongoing at the time trial sites were audited; in these cases, audits were restricted to participants having completed their treatment) Support for participating sites: CTU |
|
| Data | Monitoring data from 11 randomized trials with trial sites randomized to 2 different monitoring strategies (randomized at the beginning of the trial) | |
| Comparisons |
Intervention: initial risk assessment according to Brosteanu 2009 with 3 different risk levels and corresponding intensity of on‐site monitoring Control: extensive on‐site monitoring without risk assessment |
|
| Outcomes |
Primary outcome: participant‐level composite outcome (informed consent process violation, eligibility criteria violation, SAE reporting violation, errors in endpoint assessment, protocol deviation with impact on patient safety or data validity) Secondary outcomes: economic data (mean number of monitoring visits and time spent on‐site) |
|
| Clinical area and setting of host trial | International and national multicenter trials in secondary and tertiary care in the areas of oncology, neonatology, neurology, intensive care, surgery, and cardiology, including adults and children; involved countries: Germany and the US | |
| Number of patients randomized (analyzed) | 1967 randomized (1920 analyzed) participants in 213 randomized (156 analyzed) sites; difference in number of participants randomized and analyzed due to inclusion of sites that did not recruit any participants | |
| Notes | Funding source: German Federal Ministry for Education and Research (non‐industry funded) Published as peer‐reviewed article in English |
|
| Risk of bias | ||
| Item | Authors' judgement | Support for judgement |
| Selection bias | Yes | Randomization of trial sites within participating trials was performed centrally in Leipzig. |
| Performance bias | No | Quote: "Trial sites were informed by their respective trial sponsor about ADAMON and the planned audits, but not about the assigned monitoring arm. Sponsors, Monitors and Adamon team were aware of assignment." |
| Detection bias | Yes | Quote: "Audit teams were not informed of the sites' monitoring strategy and did not have access to any monitoring reports. Audit findings were reviewed in a blinded manner by members of the ADAMON team and discussed with auditors, as necessary, to ensure that reporting was consistent with the ADAMON audit manuals." |
| Attrition bias | Yes | However: (quote) "… one site refused the audit, and in the last five audited trials, 29 sites with less than three patients were not audited due to limited resources, in large sites (>45 patients), only a centrally preselected random sample of patients was audited. Arms are not fully balanced in numbers of patients audited (755 extensive on‐site monitoring and 863 risk‐adapted monitoring) overall." |
| Reporting bias | Yes | Protocol available, no indication of selective reporting. |
| Other bias | Yes | |
Fougerou‐Leurent 2019.
| Study characteristics | ||
| Methods | Design: prospective cross‐over study Duration of monitoring study: 2 years Support for participating sites: Clinical Investigation Center, INSERM, Rennes, France |
|
| Data | Monitoring data from 126 participants in 6 ongoing phase II and phase III randomized trials (selected participants for whom the data monitoring had not started) | |
| Comparisons |
Intervention: targeted SDV on key data for all participants Control: full SDV on 100% of data points for 100% of participants |
|
| Outcomes |
Primary outcome: error rate in the final dataset prepared using the targeted SDV monitoring process, on total data and on key data. Secondary outcomes: impact of targeted SDV on the DM workload and the staffing cost of the trial. Secondary endpoints were the number of discrepancies between the datasets prepared using the 2 monitoring strategies at each step, the number of queries issued with each strategy, and the time spent on SDV and DM with each strategy |
|
| Clinical area and setting of host trial | National, single center/multicenter trials in secondary and tertiary care settings involving adults (one trial was multinational, the others were national); limited to Rennes, France | |
| Number of patients randomized (analyzed) | 126 randomized in the monitoring study (126 analyzed in the monitoring study) | |
| Notes | Funding source: University Hospital Rennes (non‐industry funded) Published as peer‐reviewed article in English |
|
| Risk of bias | ||
| Item | Authors' judgement | Support for judgement |
| Selection bias | Yes | Prospective cross‐over design: the same CRFs were analyzed with full or targeted SDV. Participants from Rennes, for whom the data monitoring had not started. |
| Performance bias | No | It is difficult to blind personnel on full vs partial SDV. |
| Detection bias | Unclear | The same DM program (missing data, consistency, protocol deviations) was subsequently implemented in each strategy by central DM staff. No information on blinding. |
| Attrition bias | Yes | All outcomes of methods section included in the outcome data. |
| Reporting bias | Yes | No indication for reporting bias, all outcomes were reported in the methods section. |
| Other bias | No | If the CRA spotted a false or missing non‐key data when checking a key data, they may have corrected the non‐key data in the CRF. This bias may have underestimated the difference between the 2 monitoring strategies. The full SDV CRF was considered without errors. |
Journot 2017.
| Study characteristics | ||
| Methods | Design: cluster randomized trial Duration of monitoring study: 3 years (OPTIMON staff collected OPTIMON data after completion of monitoring of the trials by the responsible CTU. When the duration for recruitment or main endpoint collection was > 6 months or 1 year, OPTIMON outcome variables were collected at an earlier time point, and only for a certain number of participants) Support for participating sites: clinical research centers |
|
| Data | Monitoring data from 22 trials (15 randomized trials, 4 cohort studies, 3 cross‐sectional studies) on participants and trial sites (83 proposed) randomized to 2 different monitoring strategies | |
| Comparisons |
Intervention: initial risk assessment published in Journot 2011 – 4 different risk levels (A, B, C, D) – different degrees of monitoring Control: full on‐site monitoring (including SDV) without risk assessment |
|
| Outcomes |
Primary outcome: participant‐level composite outcome (eligibility violations, informed consent violations, SAE reporting violation, value missing for the primary endpoint) Secondary outcomes: economic data (indicators of direct and indirect costs. (The costs directly related to applying each strategy should be taken into account stating: 1. investments necessary in material and training and costs of maintenance, which thus provides the cost of acquisition. Investments classified as redeployable or not, i.e. whether or not limiting the possibility of doing other things in the future and therefore the cost of abandoning; 2. costs related to carrying out the study (if possible, individual per participant); 3. cost of the detection of errors; 4. cost of the consequences of detected and undetected errors; 5. cost of the surveillance of the monitoring strategies) Timeliness, overall data completeness, breakdown of the main judgment criterion according to the type of serious error (proportion of errors related to consent, proportion of errors relating to serious or unexpected adverse events, proportion of errors relating to eligibility criteria, proportion of errors relating to the main judgment criterion of the clinical research study) |
|
| Clinical area and setting of host trial | National and international, multicenter trials in secondary care settings and including adults, older people, and children. 19 studies dealt with chronic diseases. 10 studies were on specific populations. 8 studies with risk level A, 4 with risk level B, and 10 with risk level C. Countries involved: France | |
| Number of patients randomized (analyzed) | 954 participants randomized in monitoring study (759 analyzed), randomization of 83 sites (68 analyzed); difference in number of participants randomized and analyzed due to inclusion of sites that did not recruit any participants | |
| Notes | Funding source: French National Hospital Clinical Research Program (PHRC) (academic funded) Only published as abstract and conference proceedings, no full report published |
|
| Risk of bias | ||
| Item | Authors' judgement | Support for judgement |
| Selection bias | Yes | Randomization by the OPTIMON team's statistician and validated by an independent statistician. Randomization carried out per level in line with the A, B, or C risk levels of the clinical research studies. A complete document describing the randomization procedure (methods, block size, program used) was kept confidentially by the OPTIMON team's statistician. The result of the randomization was automatically sent to the methodology and management center by fax . |
| Performance bias | No | Randomization was kept confidential and site staff were not informed about assignment. Monitors were not blinded and the same CRA was allowed to performed the monitoring in both arms of the same study. |
| Detection bias | Yes | Assessors were not blinded. However, main outcome was validated by a blinded validation committee. |
| Attrition bias | Yes | No indication of missing data (some sites did not recruit any participants and were not included in the analysis, balanced between groups). |
| Reporting bias | Yes | Protocol available at the study homepage, no full report published yet but data available from conference presentations. |
| Other bias | Yes | |
Knott 2015.
| Study characteristics | ||
| Methods | Design: matched comparator design Duration: 18 months Support for participating sites: Clinical Trial Service Unit, Nuffield Department of Population Health, University of Oxford, Oxford, UK |
|
| Data | Monitoring data from 21 sites (6 UK sites, 4 China, 11 Scandinavia) of 1 international trial in 245 sites included in analysis | |
| Comparisons |
Intervention: on‐site monitoring visits targeted as a result of high scores determined through central statistical monitoring procedures Control: on‐site visits in comparator sites chosen by the regional co‐ordinating center among low scoring sites determined through central statistical monitoring procedures |
|
| Outcomes |
Primary outcome: site‐level composite outcome. Proportion of sites with ≥ 1 major or serious finding not already identified through central monitoring Secondary outcomes: proportion of sites with ≥ 1 minor finding, proportion of sites with ≥ 1 serious finding |
|
| Clinical area and setting of host trial | International, multicenter trial; countries involved: UK, China, Scandinavia (Norway, Finland, Sweden, Denmark) | |
| Number of patients randomized (analyzed) | No information on number of participants included in the study (25,673 were randomized in the host trial). 238 sites were considered in the central statistical monitoring procedure and 21 sites were included in the comparison | |
| Notes | Funding source: Clinical Trial Service Unit, Nuffield Department of Population Health, University of Oxford, Oxford, UK (non‐industry funded) Only published as conference abstract, no full report published |
|
| Risk of bias | ||
| Item | Authors' judgement | Support for judgement |
| Selection bias | No | Non‐randomized study. Matched comparator design. |
| Performance bias | No | Monitors performing the on‐site visits were not blinded. |
| Detection bias | Unclear | No full report published yet. |
| Attrition bias | Yes | No full report published yet, but all available information provided by the study team. |
| Reporting bias | Yes | No full report published yet, but all available information provided by the study team. |
| Other bias | Yes | |
Liènard 2006.
| Study characteristics | ||
| Methods | Design: cluster randomized trial Duration: 2 years Support for participating sites: International Drug Development Institute |
|
| Data | Monitoring data from 573 participants in 135 participating centers of a large cancer trial | |
| Comparisons |
Intervention: monitoring strategy where on‐site initiation visits were only performed when requested by the investigator Control: monitoring strategy that included the routine on‐site initiation visits |
|
| Outcomes |
Primary outcome: outcomes of interest to assess the impact of on‐site monitoring visits were: number of randomized participants per center, length of participant follow‐up in each center, number of CRF pages submitted by each center to the co‐ordinating office, and quality of data assessed by the number of computer‐generated data queries for each center (queries per page and queries per participant). Data inserted into Excel Secondary outcomes: economic data. Time spent for monitoring was reported in discussion section, but defined as a secondary outcome. |
|
| Clinical area and setting of host trial | Multinational, multicenter trial in secondary care centers and involving only adults in the study population; involved countries: only centers in France participated in the methodological substudy of the cancer trial | |
| Number of patients randomized (analyzed) | 573 participants randomized (573 analyzed) | |
| Notes | Funding source: the host trial (AERO B‐2000) was mainly supported by an unrestricted research grant from Bristol‐Myers Squibb France with additional support from Chugai Laboratories (industry‐funded) Published as peer‐reviewed article in English |
|
| Risk of bias | ||
| Item | Authors' judgement | Support for judgement |
| Selection bias | Yes | French centers that had expressed an interest in the trial were randomly allocated by the co‐ordinating office (International Drug Development Institute, Brussels, Belgium) |
| Performance bias | No | Investigators were not informed that they would be randomized to be visited or not, for such information might have compromised the purpose of the study. They were told that the trial budget would not allow for regular, extensive on‐site monitoring visits such as those typically performed in registration trials of new drugs. Investigators requesting on‐site visits were visited regardless of the randomized group their center had been allocated to. |
| Detection bias | Unclear | For the outcome recruitment blinding is not necessary. Unclear if data managers assessing the quality of the data submitted were blinded . |
| Attrition bias | Yes | Data did not appear to have been excluded. However, because the study was terminated prematurely, the reported data were incomplete in terms of what was planned for the study. Number of centers that randomized participants were equal in both groups. |
| Reporting bias | Yes | All outcomes reported in the methods section were reported. Some data were incomplete due to premature termination (e.g. participant follow‐up). Hours of work for monitoring were reported in the discussion session, but not in the methods or results. |
| Other bias | Yes | |
Mealer 2013.
| Study characteristics | ||
| Methods | Design: randomized trial Duration: 2 years (pilot study) Support for participating sites: co‐ordinating centers of the ARDS and ChiLDReN networks |
|
| Data | Monitoring data from 32 participants in trials from 2 large trial networks | |
| Comparisons |
Intervention: remote SDV Control: full on‐site SDV |
|
| Outcomes |
Primary outcome: accuracy and completeness of remote SDV vs on‐site monitoring determined by analyzing the number of data values assigned to 4 outcomes: 1. found‐match (data value recorded on the CRF matched the data value in the source document); 2. found‐different (data value recorded on the CRF was different (did not match) the data value in the source document); 3. missing data (value recorded on the CRF could not be found in the source document); and 4. unknown (no data on the CRF or in the source document related to a data value that was supposed to be collected) compared to all data values other than those assigned to the "not monitored" outcome. Secondary outcomes: economic outcome data – efficiency was measured by analyzing the amount of time it took to complete the SDV tasks by individual data item and by CRF form. |
|
| Clinical area and setting of host trial | National, multicenter trials in secondary and tertiary care settings including adults and children in their study population. Involved countries: USA | |
| Number of patients randomized (analyzed) | 32 participants randomized (32 analyzed) | |
| Notes | Funding source: NIH/NCATS Colorado CTSI Grant Number UL1 TR000154. The ARDS network was supported by
HHSN268200536‐179C (MGH) and N01‐56167 (University of Colorado). The ChiLDReN network is supported by CCC: 5U01DK062456‐11 (University of Michigan) and 2U01DK06243‐08 (University of Colorado) (non‐industry funded) Published as peer‐reviewed article in English |
|
| Risk of bias | ||
| Item | Authors' judgement | Support for judgement |
| Selection bias | Unclear | Quote: "Our study is also limited by the non blinded randomization method chosen." |
| Performance bias | No | For each research network, the same monitor performed both remote and local monitoring. Remote monitors had telephone access to the same local co‐ordinators who were available during on‐site monitoring visits. |
| Detection bias | Unclear | Monitoring was not performed blindly. Unclear if the analysis was done blinded. |
| Attrition bias | Yes | No attrition reported. |
| Reporting bias | Yes | No indication for reporting bias, all outcomes were reported in the methods section |
| Other bias | Yes | |
Stenning 2018b.
| Study characteristics | ||
| Methods | Design: prospective matched‐pair study Duration: 31 months Support for participating sites: MRC CTU at UCL, Cancer Research UK, UK |
|
| Data | Monitoring data from 42 matched paired visits (84 visits) at 63 sites were included in the analysis. The matching algorithm proposed untriggered sites to visit, minimizing differenced in number of participants, and time since first participant randomized and maximizing differences in trigger score | |
| Comparisons |
Intervention: triggered monitoring strategy in which targeted on‐site monitoring based on trial data and conduct that were scrutinized centrally with prespecified triggers for visits to sites Control: normal on‐site visits to sites without activated triggers |
|
| Outcomes |
Primary outcome: site‐level composite outcome (eligibility violations, informed‐consent violations, SAE reporting violations, errors in key data and endpoint assessment, errors in pharmacy documents and facilities, and investigator site files). Defined as proportion of sites with ≥ 1 major or critical finding not already identified through central monitoring or a previous visit ('new' findings). Secondary outcomes: number of major and critical findings, number of critical findings, proportion of sites with ≥ 1 critical finding and category of major/critical findings |
|
| Clinical area and setting of host trial | UK sites in 3 well‐established international, multicenter trials cancer trials in secondary care setting including adults only. Involved countries: UK | |
| Number of patients randomized (analyzed) | 42 matched paired visits conducted (84 visits) at 63 sites | |
| Notes | Funding source: Cancer Research UK (grant C1495/A13305 from the Population Research Committee); Medical Research Council (MC_EX_UU_G0800814) and the MRC London Hub for Trial Methodology Research (MC_UU_12023/24) (non‐industry funded) Published as peer‐reviewed article in English |
|
| Risk of bias | ||
| Item | Authors' judgement | Support for judgement |
| Selection bias | No | Non‐randomized study. Investigators attempted to balance groups by design and controlled for known confounding factors by using the Microsoft matching algorithm. |
| Performance bias | No | To ensure visits were arranged and conducted as per normal practice, site staff were not explicitly informed about the TEMPER study or the reason for a monitoring visit. The trials unit staff present at triggered and untriggered visits were not blind to visit type. |
| Detection bias | Yes | Observation bias due to lack of blinding of monitoring staff was mitigated by consistent training on the trials and monitoring methods, the use of a common finding grading system and independent review of all major and critical findings that was blind to visit type. |
| Attrition bias | Yes | All 84 visits were included in the analysis. |
| Reporting bias | Yes | No indication of reporting bias. Scores of matched sites are published in Diaz‐Montana 2019a . |
| Other bias | Yes | Exact site selection is not fully reported: chosen sites usually had the highest total trigger scores, but general concerns sometimes led to other sites being prioritized . Visits per site (triggered and control) were not reported. Only that 84 visits were completed in 63 sites (of 156 total). |
Wyman 2020.
| Study characteristics | ||
| Methods | Design: cluster randomized trial Duration: 5.25 years Support for participating sites: all clinical sites were associated with 1 of 4 international co‐ordinating centers, located in Copenhagen, Denmark; London, UK; Sydney, Australia; and Washington DC, US |
|
| Data | Monitoring data from 1 randomized trial in infectious disease with sites randomized to 2 different monitoring strategies; data collection for the monitoring study included 4371 participants (2107 participants in the on‐site group, 2264 in the no on‐site group) from 196 sites in 34 countries | |
| Comparisons |
Intervention: central and local monitoring alone Control: central, local, and on‐site monitoring |
|
| Outcomes |
Primary outcome: participant‐level composite outcome (eligibility violations, primary event/SAE not reported within 6 months, informed consent violations, use of antiretroviral therapy not permitted by START, data alteration) Secondary outcomes: economic data (person‐hours spent conducting on‐site monitoring), percentage of participants lost to follow‐up, percentage of missed follow‐up data collection visits, data submission timelines |
|
| Clinical area and setting of host trial | 1 international, multicenter trial in infectious disease in a secondary care setting including adults only; involved countries: 34 countries from Europe, North America, South America, Asia, and Africa (Argentina, Australia, Austria, Belgium, Brazil, Chile, Czechia, Denmark, Estonia, Finland, France, Germany, Greece, India, Ireland, Israel, Italy, Luxembourg, Malaysia, Mali, Mexico, Morocco, Nigeria, Norway, Peru, Poland, Portugal, Puerto Rico, South Africa, Spain, Sweden, Switzerland, Thailand, Uganda, the UK, the USA) | |
| Number of patients randomized (analyzed) | 4371 participants in 196 sites | |
| Notes | Funding source: National Institute of Allergy and Infectious Disease (non‐industry funded) Published as peer‐reviewed article in English |
|
| Risk of bias | ||
| Item | Authors' judgement | Support for judgement |
| Selection bias | Yes | Site randomization was stratified by country and projected START‐MV enrollment (< 15, 15–30, > 30 participants), and was carried out by the statistical center using block randomization prior to the beginning of the substudy. |
| Performance bias | No | Co‐ordinating centers were informed of the assignments. While sites were not notified of the randomization assignment it was not blinded, as, within the first year, sites randomized to the central + local + on‐site monitoring arm were contacted to schedule a monitoring visit. It is unclear if monitors performing the on‐site visits were blinded. |
| Detection bias | Unclear | No indication of blinded outcome assessment. Quote: "A procedure was implemented for statistical center staff to centrally review consent violations found by on‐site monitors to determine if the violation met the revised criteria." No information whether statistical center staff were blinded. |
| Attrition bias | Yes | All randomized sites were included in the analysis. |
| Reporting bias | Yes | No indication of selective reporting based on the design paper introducing the INSIGHT START monitoring substudy ( Hullsiek 2015 ). |
| Other bias | Yes | |
ARDS network: Acute Respiratory Distress Syndrome network; ChiLDReN: Childhood Liver Disease Research Network; CRA: clinical research associate; CRF: case report form; CTU: clinical trials unit; DM: data management; SAE: serious adverse event; SDV: source data verification.
Characteristics of excluded studies [ordered by study ID]
| Study | Reason for exclusion |
|---|---|
| Agrafiotis 2018 | Not a prospective study. |
| Andersen 2015 | Not a prospective study. |
| Bailey 2017 | No comparison of different monitoring strategies (only abstract available). |
| Bakobaki 2011 | Not a prospective study. |
| Bakobaki 2012 | Not a prospective study. |
| Biglan 2016 | Not a prospective study (only abstract available). |
| Collett 2019 | No comparison of different monitoring strategies. |
| Cragg 2019 | Not a prospective study. |
| Del Alamo 2018 | No comparison of different monitoring strategies. |
| Diani 2017 | Not a prospective study. |
| Diaz‐Montana 2019b | No comparison of different monitoring strategies. |
| Edwards 2014 | No comparison of different monitoring strategies. |
| Elsa 2011 | No comparison of different monitoring strategies. |
| Fu 2021 | Not a prospective study. |
| Hatayama 2020 | No comparison of different monitoring strategies. |
| Heels‐Ansdell 2010 | No comparison of different monitoring strategies. |
| Higa 2020 | Not a prospective study. |
| Hirase 2016 | Not a prospective study. |
| Jones 2019 | Not a prospective study (abstract only). |
| Jung 2020 | No comparison of different monitoring strategies (centralized monitoring used only for medication adherence). |
| Kim 2011 | Not a prospective study (abstract only). |
| Kim 2021 | Not a prospective study. |
| Lane 2013 | No comparison of different monitoring strategies. |
| Lim 2017 | No comparison of different monitoring strategies. |
| Lindley 2015 | No comparison of different monitoring strategies (abstract only). |
| Miyamoto 2019 | No comparison of different monitoring strategies. |
| Morales 2020 | No comparison of different monitoring strategies. |
| Murphy 2019 | No comparison of different monitoring strategies (abstract only). |
| Pei 2019 | No comparison of different monitoring strategies. |
| Stock 2017 | No comparison of different monitoring strategies. |
| Sudo 2017 | No comparison of different monitoring strategies. |
| Thom 1996 | No comparison of different monitoring strategies. |
| Tudur Smith 2012b | Not a prospective study. |
| von Niederhäusern 2017 | Not a prospective study. |
| Yamada 2021 | Not a prospective study. |
| Yorke‐Edwards 2019 | No comparison of different monitoring strategies. |
| Zhao 2013 | No comparison of different monitoring strategies. |
Differences between protocol and review
We did not estimate the intracluster correlation and heterogeneity across sites within the ADAMON and OPTIMON studies as planned in our review protocol (Klatte 2019) due to lack of information. .
We planned in the protocol to assess the statistical heterogeneity of studies in meta‐analyses. Due to the small number of included studies per comparison, it was not reasonable to assess heterogeneity statistically.
Planned sensitivity analyses were also not performed because of the small number of included studies.
We removed characteristics of monitoring strategies from the list of secondary outcomes upon request of reviewers and included the information in the section on general characteristic of included studies. We changed the order of the secondary outcomes in an attempt to improve the logical flow of the Results section.
Contributions of authors
KK, CPM, and MB conceived the study and wrote the first draft of the protocol.
SL, MS, PB, NB, HE, PAJ, and MMB reviewed the protocol and suggested changes for improvement.
HE and KK developed the search strategy and conducted all searches.
KK, CPM, and MB screened titles and abstracts as well as full texts, and selected eligible studies.
KK and MMB extracted relevant data from included studies and assessed risk of bias.
KK conducted the statistical analyses and interpreted the results together with MB and CPM.
KK and MB assessed the certainty of the evidence according to GRADE and wrote the first draft of the review manuscript.
CPM, SL, MS, PB, NB, HE, PAJ, and MMB critically reviewed the manuscript and made suggestions for improvement.
Sources of support
Internal sources
-
Department of Clinical Research, Switzerland
The Department of Clinical Research provided salaries for review contributors.
External sources
No sources of support provided
Declarations of interest
KK: none.
CPM: none.
SL: none.
MS was a co‐investigator on an included study (TEMPER), but had no role in study selection, risk of bias, or certainty of evidence assessment for this review. He has no other relevant conflicts to declare.
PB: none.
NB: none.
HE: none.
PAJ: none.
MMB: none.
MB: none.
Edited (no change to conclusions)
References
References to studies included in this review
Brosteanu 2017b {published data only}
- Brosteanu O, Houben P, Ihrig K, Ohmann C, Paulus U, Pfistner B, et al. Risk analysis and risk adapted on-site monitoring in noncommercial clinical trials. Clinical Trials 2009;6:585-96. [DOI] [PubMed] [Google Scholar]
- Brosteanu O, Schwarz G, Houben P, Paulus U, Strenge-Hesse A, Zettelmeyer U, et al. Risk-adapted monitoring is not inferior to extensive on-site monitoring: results of the ADAMON cluster-randomised study. Clinical Trials 2017;14:584-96. [DOI] [PMC free article] [PubMed] [Google Scholar]
- Study protocol ("Prospektive cluster-randomisierte Untersuchung studienspezifisch adaptierterStrategien für das Monitoring vor Ort in Kombination mit zusätzlichenqualitätssichernden Maßnahmen"). www.tmf-ev.de/ADAMON/Downloads.aspx (accessed prior to 19 August 2021).
Fougerou‐Leurent 2019 {published and unpublished data}
- Fougerou-Leurent C, Laviolle B, Bellissant E. Cost-effectiveness of full versus targeted monitoring of randomized controlled trials. Fundamental & Clinical Pharmacology 2018;32(S1):49 (PM2-035). [Google Scholar]
- Fougerou-Leurent C, Laviolle B, Tual C, Visseiche V, Veislinger A, Danjou H, et al. Impact of a targeted monitoring on data-quality and data-management workload of randomized controlled trials: a prospective comparative study. British Journal of Clinical Pharmacology 2019;85(12):2784-92. [DOI: 10.1111/bcp.14108] [DOI] [PMC free article] [PubMed] [Google Scholar]
Journot 2017 {published and unpublished data}
- Journot V, Perusat-Villetorte S, Bouyssou C, Couffin-Cadiergues S, Tall A, Chene G. Remote preenrollment checking of consent forms to reduce nonconformity. Clinical Trials 2013;10:449-59. [DOI] [PubMed] [Google Scholar]
- Journot V, Pignon JP, Gaultier C, Daurat V, Bouxin-Metro A, Giraudeau B, et al. Validation of a risk-assessment scale and a risk-adapted monitoring plan for academic clinical research studies – the Pre-Optimon study. Contemporary Clinical Trials 2011;32:16-24. [DOI] [PubMed] [Google Scholar]
- Journot V. OPTIMON – first results of the French trial on optimisation of monitoring. ssl2.isped.u-bordeaux2.fr/OPTIMON/docs/Communications/2015-Montpellier/OPTIMON%20-%20EpiClin%20Montpellier%202015-05-20%20EN.pdf (accessed 2 October 2019).
- Journot V. OPTIMON – the French trial on optimization of monitoring. SCT Annual Meeting; 2017 May 7-10; Liverpool, UK.
- Study protocol: evaluation of the efficacy and cost of two monitoring strategies for public clinical research. OPTIMON study: OPTImisation of MONitoring. ssl2.isped.u-bordeaux2.fr/OPTIMON/DOCS/OPTIMON%20-%20Protocol%20v12.0%20EN%202008-04-21.pdf (accessed prior to 19 August 2021).
Knott 2015 {published and unpublished data}
- Knott C, Valdes-Marquez E, Landray M, Armitage J, Hopewell J. Improving efficiency of on-site monitoring in multicentre clinical trials by targeting visits. Trials 2015;16(Suppl 2):O49. [Google Scholar]
Liènard 2006 {published data only}
- Liénard JL, Quinaux E, Fabre-Guillevin E, Piedbois P, Jouhaud A, Decoster G, et al. Impact of on-site initiation visits on patient recruitment and data quality in a randomized trial of adjuvant chemotherapy for breast cancer. Clinical Trials 2006;3(5):486-92. [DOI: 10.1177/1740774506070807] [DOI] [PubMed] [Google Scholar]
Mealer 2013 {published data only}
- Mealer M, Kittelson J, Thompson BT, Wheeler AP, Magee JC, Sokol RJ, et al. Remote source document verification in two national clinical trials networks: a pilot study. PloS One 2013;8(12):e81890. [DOI] [PMC free article] [PubMed] [Google Scholar]
Stenning 2018b {published data only}
- Cragg WJ, Hurley C, Yorke-Edwards V, Stenning SP. Assessing the potential for prevention or earlier detection of on-site monitoring findings from randomised controlled trials: further analyses of findings from the prospective TEMPER triggered monitoring study. Clinical Trials 2021;18(1):115-26. [DOI: 10.1177/1740774520972650] [DOI] [PMC free article] [PubMed] [Google Scholar]
- Diaz-Montana C, Choudhury R, Cragg W, Joffe N, Tappenden N, Sydes MR, et al. Managing our TEMPER: monitoring triggers and site matching algorithms for defining triggered and control sites in the temper study. Trials 2017;18:P149. [DOI] [PMC free article] [PubMed] [Google Scholar]
- Diaz-Montana C, Cragg WJ, Choudhury R, Joffe N, Sydes MR, Stenning SP. Implementing monitoring triggers and matching of triggered and control sites in the TEMPER study: a description and evaluation of a triggered monitoring management system. Trials 2019;20:227. [DOI] [PMC free article] [PubMed] [Google Scholar]
- Stenning SP, Cragg WJ, Joffe N, Diaz-Montana C, Choudhury R, Sydes MR, et al. Triggered or routine site monitoring visits for randomised controlled trials: results of TEMPER, a prospective, matched-pair study. Clinical Trials 2018;15:600-9. [DOI] [PMC free article] [PubMed] [Google Scholar]
- Study protocol: TEMPER (TargetEd Monitoring: Prospective Evaluation and Refinement) prospective evaluation and refinement of a targeted on-site monitoring strategy for multicentre cancer clinical trials. journals.sagepub.com/doi/suppl/10.1177/1740774518793379/suppl_file/793379_supp_mat_2.pdf (accessed prior to 19 August 2021).
Wyman 2020 {published data only}
- Hullsiek KH, Kagan JM, Engen N, Grarup J, Hudson F, Denning ET, et al. Investigating the efficacy of clinical trial monitoring strategies: design and implementation of the cluster randomized START monitoring substudy. Therapeutic Innovation and Regulatory Science 2015;49:225-33. [DOI] [PMC free article] [PubMed] [Google Scholar]
- Wyman Engen N, Huppler Hullsiek K, Belloso WH, Finley E, Hudson F, Denning E, et al. A randomized evaluation of on-site monitoring nested in a multinational randomized trial. Clinical Trials 2020;17(1):3-14. [DOI: 10.1177/1740774519881616] [DOI] [PMC free article] [PubMed] [Google Scholar]
References to studies excluded from this review
Agrafiotis 2018 {published data only}
- Agrafiotis DK, Lobanov VS, Farnum MA, Yang E, Ciervo J, Walega M, et al. Risk-based monitoring of clinical trials: an integrative approach. Clinical Therapeutics 2018;40:1204-12. [DOI] [PubMed] [Google Scholar]
Andersen 2015 {published data only}
- Andersen JR, Byrjalsen I, Bihlet A, Kalakou F, Hoeck HC, Hansen G, et al. Impact of source data verification on data quality in clinical trials: an empirical post hoc analysis of three phase 3 randomized clinical trials. British Journal of Clinical Pharmacology 2015;79:660-8. [DOI] [PMC free article] [PubMed] [Google Scholar]
Bailey 2017 {published data only}
- Bailey L, Straw FK, George SE. Implementing a risk based monitoring approach in the early phase myeloma portfolio at Leeds CTRU. Trials 2017;18:220. [Google Scholar]
Bakobaki 2011 {published data only}
- Bakobaki J, Rauchenberger M, Kaganson N, McCormack S, Stenning S, Meredith S. The potential for central monitoring techniques to replace on-site monitoring in clinical trials: a review of monitoring findings from an international multi-centre clinical trial. Clinical Trials 2011;8:454-5. [DOI] [PubMed] [Google Scholar]
Bakobaki 2012 {published data only}
- Bakobaki JM, Rauchenberger M, Joffe N, McCormack S, Stenning S, Meredith S. The potential for central monitoring techniques to replace on-site monitoring: findings from an international multi-centre clinical trial. Clinical Trials 2012;9:257-64. [DOI] [PubMed] [Google Scholar]
Biglan 2016 {published data only}
- Biglan K, Brocht A, Raca P. Implementing risk-based monitoring (RBM) in STEADY-PD III, a phase III multi-site clinical drug trial for Parkinson disease. Movement Disorders 2016;31(9):E10. [Google Scholar]
Collett 2019 {published data only}
- Collett L, Gidman E, Rogers C. Automation of clinical trial statistical monitoring. Trials 2019;20(Suppl 1):P-251. [Google Scholar]
Cragg 2019 {published data only}
- Cragg WJ, Cafferty F, Diaz-Montana C, James EC, Joffe J, Mascarenhas M, et al. Early warnings and repayment plans: novel trial management methods for monitoring and managing data return rates in a multi-centre phase III randomised controlled trial with paper case report forms. Trials 2019;20:241. [DOI: 10.1186/s13063-019-3343-2] [DOI] [PMC free article] [PubMed] [Google Scholar]
Del Alamo 2018 {published data only}
- Del Alamo M, Sanchez AI, Serrano ML, Aguilar M, Arcas M, Alvarez A, et al. Monitoring strategies for clinical trials in primary care: an independent clinical research perspective. Basic & Clinical Pharmacology & Toxicology 2018;123:25-6. [Google Scholar]
Diani 2017 {published data only}
- Diani CA, Rock A, Moll P. An evaluation of the effectiveness of a risk-based monitoring approach implemented with clinical trials involving implantable cardiac medical devices. Clinical Trials 2017;14:575-83. [DOI] [PubMed] [Google Scholar]
Diaz‐Montana 2019b {published data only}
- Diaz-Montana C, Masters L, Love SB, Lensen S, Yorke-Edwards V, Sydes MR. Making performance metrics work: developing a triggered monitoring management system. Trials 2019;20(Suppl 1):P-63. [Google Scholar]
Edwards 2014 {published data only}
- Edwards P, Shakur H, Barnetson L, Prieto D, Evans S, Roberts I. Central and statistical data monitoring in the Clinical Randomisation of an Antifibrinolytic in Significant Haemorrhage (CRASH-2) trial. Clinical Trials 2014;11:336-43. [DOI] [PubMed] [Google Scholar]
Elsa 2011 {published data only}
- Elsa VM, Jemma HC, Martin L, Jane A. A key risk indicator approach to central statistical monitoring in multicentre clinical trials: method development in the context of an ongoing large-scale randomized trial. Trials 2011;12:A135. [Google Scholar]
Fu 2021 {published data only}
- Fu ZY, Liu XH, Zhao SH, Yuan YN, Jiang M. A preliminary analysis of remote monitoring practice in clinical trials. Chinese Journal of New Drugs 2021;30(3):209-14. [Google Scholar]
Hatayama 2020 {published data only}
- Hatayama T, Yasui S. Bayesian central statistical monitoring using finite mixture models in multicenter clinical trials. Contemporary Clinical Trials Communication 2020;19:100566. [DOI] [PMC free article] [PubMed] [Google Scholar]
Heels‐Ansdell 2010 {published data only}
- Heels-Ansdell D, Walter S, Zytaruk N, Guyatt G, Crowther M, Warkentin T, et al. Central statistical monitoring of an international thromboprophylaxis trial. American Journal of Respiratory and Critical Care Medicine 2010;181:A6041. [Google Scholar]
Higa 2020 {published data only}
- Higa A, Yagi M, Hayashi K, Kosako M, Akiho H. Risk-based monitoring approach to ensure the quality of clinical study data and enable effective monitoring. Therapeutic Innovation and Regulatory Science 2020;54(1):139-43. [DOI] [PubMed] [Google Scholar]
Hirase 2016 {published data only}
- Hirase K, Fukuda-Doi M, Okazaki S, Uotani M, Ohara H, Furukawa A, et al. Development of an efficient monitoring method for investigator-initiated clinical trials: lessons from the experience of ATACH-II trial. Japanese Pharmacology and Therapeutics 2016;44:s150-4. [Google Scholar]
Jones 2019 {published data only}
- Jones L, Ogburn E, Yu LM, Begum N, Long A, Hobbs FD. On-site monitoring of primary outcomes is important in primary care clinical trials: Benefits of Aldosterone Receptor Antagonism in Chronic Kidney Disease (BARACK-D) trial – a case study. Trials 2019;20(Suppl 1):P-272. [Google Scholar]
Jung 2020 {published data only}
- Jung HY, Jeon Y, Seong SJ, Seo JJ, Choi JY, Cho JH, et al. Information and communication technology-based centralized monitoring system to increase adherence to immunosuppressive medication in kidney transplant recipients: a randomized controlled trial. Nephrology, Dialysis, Transplantation 2020;35(Suppl 3):gfaa143.P1734. [DOI: 10.1093/ndt/gfaa143.P1734] [DOI] [Google Scholar]
Kim 2011 {published data only}
- Kim J, Zhao W, Pauls K, Goddard T. Integration of site performance monitoring module in web-based CTMS for a global trial. Clinical Trials 2011;8:450. [Google Scholar]
Kim 2021 {published data only}
- Kim S, Kim Y, Hong Y, Kim Y, Lim JS, Lee J, et al. Feasibility of a hybrid risk-adapted monitoring system in investigator-sponsored trials in cancer. Therapeutic Innovation and Regulatory Science 2021;55(1):180-9. [DOI] [PubMed] [Google Scholar]
Lane 2013 {published data only}
- Lane JA, Wade J, Down L, Bonnington S, Holding PN, Lennon T, et al. A Peer Review Intervention for Monitoring and Evaluating sites (PRIME) that improved randomized controlled trial conduct and performance. Journal of Clinical Epidemiology 2011;64:628-36. [DOI] [PubMed] [Google Scholar]
- Lane JA. Improving trial quality through a new site monitoring process: experience from the Protect Study. Clinical Trials 2008;5:404. [Google Scholar]
- Lane JJ, Davis M, Down E, Macefield R, Neal D, Hamdy F, et al. Evaluation of source data verification in a multicentre cancer trial (PROTECT). Trials 2013;14:83. [Google Scholar]
Lim 2017 {published data only}
- Lim JY, Hackett M, Munoz-Venturelli P, Arima H, Middleton S, Olavarria VV, et al. Monitoring a large-scale international cluster stroke trial: lessons from head position in stroke trial. Stroke 2017;48:ATP371. [Google Scholar]
Lindley 2015 {published data only}
- Lindley RI. Cost effective central monitoring of clinical trials. Neuroepidemiology 2015;45:303. [Google Scholar]
Miyamoto 2019 {published data only}
- Miyamoto K, Nakamura K, Mizusawa J, Balincourt C, Fukuda H. Study risk assessment of Japan Clinical Oncology Group (JCOG) clinical trials using the European Organisation for Research and Treatment of Cancer (EORTC) study risk calculator. Japanese Journal of Clinical Oncology 2019;49(8):727-33. [DOI] [PubMed] [Google Scholar]
Morales 2020 {published data only}
- Morales A, Miropolsky L, Seagal I, Evans K, Romero H, Katz N. Case studies on the use of central statistical monitoring and interventions to optimize data quality in clinical trials. Osteoarthritis and Cartilage 2020;28:S460. [Google Scholar]
Murphy 2019 {published data only}
- Murphy J, Durkina M, Jadav P, Kiru G. An assessment of feasibility and cost-effectiveness of remote monitoring on a multicentre observational study. Trials 2019;20(Suppl 1):P-265. [Google Scholar]
Pei 2019 {published data only}
- Pei XJ, Han L, Wang T. Enhancing the system of expedited reporting of safety data during clinical trials of drugs and strengthening the management of clinical trial risk monitoring. Chinese Journal of New Drugs 2019;28(17):2113-6. [Google Scholar]
Stock 2017 {published data only}
- Stock E, Mi Z, Biswas K, Belitskaya-Levy I. Surveillance of clinical trial performance using centralized statistical monitoring. Trials 2017;18:200. [Google Scholar]
Sudo 2017 {published data only}
- Sudo T, Sato A. Investigation of the factors affecting risk-based quality management of investigator-initiated investigational new-drug trials for unapproved anticancer drugs in Japan. Therapeutic Innovation and Regulatory Science 2017;51:589-96. [DOI: 10.1177/2168479017705155] [DOI] [PubMed] [Google Scholar]
Thom 1996 {published data only}
- Thom E, Das A, Mercer B, McNellis D. Clinical trial monitoring in the face of changing clinical practice. The NICHD MFMU Network. Controlled Clinical Trials 1996;17:58S-59S. [Google Scholar]
Tudur Smith 2012b {published data only}
- Tudur Smith C, Stocken DD, Dunn J, Cox T, Ghaneh P, Cunningham D, et al. The value of source data verification in a cancer clinical trial. PloS One 2012;7(12):e51623. [DOI] [PMC free article] [PubMed] [Google Scholar]
von Niederhäusern 2017 {published data only}
- Niederhäusern B, Orleth A, Schädelin S, Rawi N, Velkopolszky M, Becherer C, et al. Generating evidence on a risk-based monitoring approach in the academic setting – lessons learned. BMC Medical Research Methodology 2017;17:26. [DOI] [PMC free article] [PubMed] [Google Scholar]
Yamada 2021 {published data only}
- Yamada O, Chiu SW, Takata M, Abe M, Shoji M, Kyotani E, et al. Clinical trial monitoring effectiveness: remote risk-based monitoring versus on-site monitoring with 100% source data verification. Clinical Trials (London, England) 2021;18(2):158-67. [DOI: 10.1177/1740774520971254] [PMID: ] [DOI] [PubMed] [Google Scholar]
Yorke‐Edwards 2019 {published data only}
- Yorke-Edwards VE, Diaz-Montana C, Mavridou K, Lensen S, Sydes MR, Love SB. Risk-based trial monitoring: site performance metrics across time. Trials 2019;20(Suppl 1):P-33. [Google Scholar]
Zhao 2013 {published data only}
- Zhao W. Risk-based monitoring approach in practice-combination of real-time central monitoring and on-site source document verification. Clinical Trials 2013;10:S4. [Google Scholar]
Additional references
ADAMON study protocol 2008
- ADAMON study protocol. Study protocol ("Prospektive cluster-randomisierte Untersuchung studienspezifisch adaptierterStrategien für das Monitoring vor Ort in Kombination mit zusätzlichenqualitätssichernden Maßnahmen"). www.tmf-ev.de/ADAMON/Downloads.aspx (accessed prior to 19 August 2021).
Anon 2012
- Anon. Education section: Studies Within A Trial (SWAT). Journal of Evidence-based Medicine 2012;5:44-5. [DOI] [PubMed] [Google Scholar]
Baigent 2008
- Baigent C, Harrell FE, Buyse M, Emberson JR, Altman DG. Ensuring trial validity by data quality assurance and diversification of monitoring methods. Clinical Trials 2008;5:49-55. [DOI] [PubMed] [Google Scholar]
Bensaaud 2020
- Bensaaud A, Gibson I, Jones J, Flaherty G, Sultan S, Tawfick W, et al. A telephone reminder to enhance adherence to interventions in cardiovascular randomized trials: a protocol for a Study Within A Trial (SWAT). Journal of Evidence-based Medicine 2020;13(1):81-4. [DOI: 10.1111/jebm.12375] [DOI] [PubMed] [Google Scholar]
Brosteanu 2009
- Brosteanu O, Houben P, Ihrig K, Ohmann C, Paulus U, Pfistner B, et al. Risk analysis and risk adapted on-site monitoring in noncommercial clinical trials. Clinical Trials 2009;6:585-96. [DOI] [PubMed] [Google Scholar]
Brosteanu 2017a
- Brosteanu O, Schwarz G, Houben P, Paulus U, Strenge-Hesse A, Zettelmeyer U, et al. Risk-adapted monitoring is not inferior to extensive on-site monitoring: results of the ADAMON cluster-randomised study. Clinical Trials 2017;14:584-96. [DOI] [PMC free article] [PubMed] [Google Scholar]
Buyse 2020
- Buyse M, Trotta L, Saad ED, Sakamoto J. Central statistical monitoring of investigator-led clinical trials in oncology. International Journal of Clinical Oncology 2020;25(7):1207-14. [DOI] [PMC free article] [PubMed] [Google Scholar]
Chene 2008
- Chene G. Evaluation of the efficacy and cost of two monitoring strategies for public clinical research. OPTIMON study: OPTImisation of MONitoring. ssl2.isped.u-bordeaux2.fr/OPTIMON/DOCS/OPTIMON%20-%20Protocol%20v12.0%20EN%202008-04-21.pdf (accessed 2 October 2019).
Cragg 2021a
- Cragg WJ, Hurley C, Yorke-Edwards V, Stenning SP. Assessing the potential for prevention or earlier detection of on-site monitoring findings from randomised controlled trials: further analyses of findings from the prospective TEMPER triggered monitoring study. Clinical Trials 2021;18(1):115-26. [DOI: 10.1177/1740774520972650] [PMID: ] [DOI] [PMC free article] [PubMed] [Google Scholar]
Cragg 2021b
- Cragg WJ, Hurley C, Yorke-Edwards V, Stenning SP. Dynamic methods for ongoing assessment of site-level risk in risk-based monitoring of clinical trials: a scoping review. Clinical Trials 2021;18(2):245-59. [DOI: 10.1177/1740774520976561] [PMID: ] [DOI] [PMC free article] [PubMed] [Google Scholar]
DerSimonian 1986
- DerSimonian R, Laird N. Meta-analysis in clinical trials. Controlled Clinical Trials 1986;7(3):177-88. [DOI] [PubMed] [Google Scholar]
Diaz‐Montana 2019a
- Diaz-Montana C, Cragg WJ, Choudhury R, Joffe N, Sydes MR, Stenning SP. Implementing monitoring triggers and matching of triggered and control sites in the TEMPER study: a description and evaluation of a triggered monitoring management system. Trials 2019;20:227. [DOI] [PMC free article] [PubMed] [Google Scholar]
Duley 2008
- Duley L, Antman K, Arena J, Avezum A, Blumenthal M, Bosch J, et al. Specific barriers to the conduct of randomised trials. Clinical Trials 2008;5:40-8. [DOI] [PubMed] [Google Scholar]
EC 2014
- European Commission. Risk proportionate approaches in clinical trials. Recommendations of the expert group on clinical trials for the implementation of Regulation (EU) No 536/2014 on clinical trials on medicinal products for human use. ec.europa.eu/health/sites/default/files/files/eudralex/vol-10/2017_04_25_risk_proportionate_approaches_in_ct.pdf (accessed 28 July 2021).
EMA 2013
- European Medicines Agency. Reflection paper on risk based quality management in clinical trials, 2013. ema.europa.eu/docs/en_GB/document_library/Scientific_guidelines/2013/11/WC500155491.pdf (accessed 2 July 2021).
EMA 2017
- European Medicines Agency. Procedure for reporting of GCP inspections requested by the Committee for Medicinal Products for Human Use, 2017. ema.europa.eu/en/documents/regulatory-procedural-guideline/ins-gcp-4-procedure-reporting-good-clinical-practice-inspections-requested-chmp_en.pdf (accessed 2 July 2021).
EMA 2021
- EMA European Medicines Agency. Guidance on the management of clinical trial during the COVID-19 (coronavirus) pandemic. European Medicines Agency 2021;V4(https://ec.europa.eu/health/sites/default/files/files/eudralex/vol-10/guidanceclinicaltrials_covid19_en.pdf (accessed August 2021)).
Embleton‐Thirsk 2019
- Embleton-Thirsk A, Deane E, Townsend S, Farrelly L, Popoola B, Parker J, et al. Impact of retrospective data verification to prepare the ICON6 trial for use in a marketing authorization application. Clinical Trials 2019;16(5):502-11. [DOI] [PMC free article] [PubMed] [Google Scholar]
EPOC 2016
- Effective Practice Organisation of Care. What study designs should be included in an EPOC review and what should they be called? EPOC resources for review authors, 2016. epoc.cochrane.org/sites/epoc.cochrane.org/files/public/uploads/EPOC%20Study%20Designs%20About.pdf (accessed 2 July 2021).
EPOC 2017
- Effective Practice Organisation of Care. Suggested risk of bias criteria for EPOC reviews. EPOC resources for review authors, 2017. epoc.cochrane.org/sites/epoc.cochrane.org/files/public/uploads/Resources-for-authors2017/suggested_risk_of_bias_criteria_for_epoc_reviews.pdf (accessed 2 July 2021).
FDA 2013
- US Department of Health and Human Services Food and Drug Administration. Guidance for industry oversight of clinical investigations – a risk-based approach to monitoring. www.fda.gov/downloads/Drugs/Guidances/UCM269919.pdf (accessed 2 July 2021).
FDA 2020
- US Food and Drug Administration. FDA guidance on conduct of clinical trials of medical products during COVID-19 public health emergency: guidance for industry, investigators, and institutional review boards, 2020. www.fda.gov/media/136238/download (accessed 19 August 2021).
Funning 2009
- Funning S, Grahnén A, Eriksson K, Kettis-Linblad A. Quality assurance within the scope of good clinical practice (GCP) – what is the cost of GCP-related activities? A survey within the Swedish Association of the Pharmaceutical Industry (LIF)'s members. Quality Assurance Journal 2009;12(1):3-7. [DOI: 10.1002/qaj.433] [DOI] [Google Scholar]
Gaba 2020
- Gaba P Bhatt DL. The COVID-19 pandemic: a catalyst to improve clinical trials. Nature Reviews. Cardiology 2020;17:673-5. [DOI] [PMC free article] [PubMed] [Google Scholar]
Gough 2016
- Gough J, Wilson B, Zerola M. Defining a central monitoring capability: sharing the experience of TransCelerateBioPharmas approach, part 2. Therapeutic Innovation and Regulatory Science 2016;50(1):8-14. [DOI: 10.1177/2168479015618696] [PMID: ] [DOI] [PubMed] [Google Scholar]
GRADEpro GDT [Computer program]
- GRADEpro GDT. Version Accessed August 2021. Hamilton (ON): McMaster University (developed by Evidence Prime Inc), 2020. Available at gradepro.org.
Grignolo 2011
- Grignolo A. The Clinical Trials Transformation Initiative (CTTI). Annali dell'Istituto Superiore di Sanita 2011;47:14-8. [DOI: 10.4415/ANN_11_01_04] [PMID: ] [DOI] [PubMed] [Google Scholar]
Guyatt 2013a
- Guyatt GH, Oxman AD, Santesso N, Helfand M, Vist G, Kunz R, et al. GRADE guidelines: 12. Preparing summary of findings tables – binary outcomes. Journal of Clinical Epidemiology 2013;66:158-72. [DOI] [PubMed] [Google Scholar]
Guyatt 2013b
- Guyatt GH, Thorlund K, Oxman AD, Walter SD, Patrick D, Furukawa TA, et al. GRADE guidelines: 13. Preparing summary of findings tables and evidence profiles – continuous outcomes. Journal of Clinical Epidemiology 2013;66:173-83. [DOI] [PubMed] [Google Scholar]
Hearn 2007
- Hearn J, Sullivan R. The impact of the 'Clinical Trials' directive on the cost and conduct of non-commercial cancer trials in the UK. European Journal of Cancer 2007;43:8-13. [DOI] [PubMed] [Google Scholar]
Higgins 2016
- Higgins JP, Lasserson T, Chandler J, Tovey D, Churchill R. Methodological Expectations of Cochrane Intervention Reviews. London (UK): Cochrane, 2016. [Google Scholar]
Higgins 2020
- Higgins JP, Thomas J, Chandler J, Cumpston M, Li T, Page MJ, et al, editor(s). Cochrane Handbook for Systematic Reviews of Interventions Version 6.1 (updated September 2020). Cochrane, 2020. Available from handbook: training.cochrane.org/handbook/archive/v6.1.
Horsley 2011
- Horsley T, Dingwall O, Sampson M. Checking reference lists to find additional studies for systematic reviews. Cochrane Database of Systematic Reviews 2011, Issue 8. Art. No: MR000026. [DOI: 10.1002/14651858.MR000026.pub2] [DOI] [PMC free article] [PubMed] [Google Scholar]
Houghton 2020
- Houghton C, Dowling M, Meskell P, Hunter A, Gardner H, Conway A, et al. Factors that impact on recruitment to randomised trials in health care: a qualitative evidence synthesis. Cochrane Database of Systematic Reviews 2020, Issue 10. Art. No: MR000045. [DOI: 10.1002/14651858.MR000045.pub2] [DOI] [PMC free article] [PubMed] [Google Scholar]
Hullsiek 2015
- Hullsiek KH, Kagan JM, Engen N, Grarup J, Hudson F, Denning ET, et al. Investigating the efficacy of clinical trial monitoring strategies: design and implementation of the cluster randomized START monitoring substudy. Therapeutic Innovation and Regulatory Science 2015;49(2):225-33. [DOI: 10.1177/2168479014555912] [PMID: ] [DOI] [PMC free article] [PubMed] [Google Scholar]
Hurley 2016
- Hurley C, Shiely F, Power J, Clarke M, Eustace JA, Flanagan E, et al. Risk based monitoring (RBM) tools for clinical trials: a systematic review. Contemporary Clinical Trials 2016;51:15-27. [DOI] [PubMed] [Google Scholar]
ICH 1996
- International Council for Harmonisation of Technical Requirements for Pharmaceuticals for Human Use. ICH Harmonised Tripartite Guideline: guideline for good clinical practice E6 (R2). www.ema.europa.eu/en/documents/scientific-guideline/ich-e-6-r2-guideline-good-clinical-practice-step-5_en.pdf (accessed 28 July 2021).
ICH 2016
- International Council for Harmonisation of Technical Requirements for Pharmaceuticals for Human Use. Integrated Addendum to ICH E6(R1): guideline for good clinical practice E6R(2). database.ich.org/sites/default/files/E6_R2_Addendum.pdf (accessed 2 July 2021).
Izmailova 2020
- Izmailova ES, Ellis R, Benko C. Remote monitoring in clinical trials during the COVID-19 pandemic. Clinical and Translational Science 2020;13(5):838-41. [DOI: 10.1111/cts.12834] [DOI] [PMC free article] [PubMed] [Google Scholar]
Journot 2011
- Journot V, Pignon JP, Gaultier C, Daurat V, Bouxin-Metro A, Giraudeau B, et al. Validation of a risk-assessment scale and a risk-adapted monitoring plan for academic clinical research studies – the Pre-Optimon study. Contemporary Clinical Trials 2011;32:16-24. [DOI] [PubMed] [Google Scholar]
Journot 2013
- Journot V, Perusat-Villetorte S, Bouyssou C, Couffin-Cadiergues S, Tall A, Chene G. Remote preenrollment checking of consent forms to reduce nonconformity. Clinical Trials 2013;10:449-59. [DOI] [PubMed] [Google Scholar]
Journot 2015
- Journot V. OPTIMON – first results of the French trial on optimisation of monitoring. ssl2.isped.u-bordeaux2.fr/OPTIMON/docs/Communications/2015-Montpellier/OPTIMON%20-%20EpiClin%20Montpellier%202015-05-20%20EN.pdf (accessed 28 July 2021).
Landray 2012
- Landray MJ, Grandinetti C, Kramer JM, Morrison BW, Ball L, Sherman RE. Clinical trials: rethinking how we ensure quality. Drug Information Journal 2012;46:657-60. [DOI: 10.1177/0092861512464372] [DOI] [Google Scholar]
Lefebvre 2011
- Lefebvre C, Manheimer E, Glanville J. Chapter 6: Searching for studies. In: Higgins JP, Green S, editor(s). Cochrane Handbook for Systematic Reviews of Interventions Version 5.1.0 (updated March 2011). The Cochrane Collaboration, 2011. Available from training.cochrane.org/handbook/archive/v5.1/.
Love 2021
- Love SB, Armstrong E, Bayliss C, Boulter M, Fox L, Grumett J, et al. Monitoring advances including consent: learning from COVID-19 trials and other trials running in UKCRC registered clinical trials units during the pandemic. Trials 2021;22:279. [DOI] [PMC free article] [PubMed] [Google Scholar]
McDermott 2020
- McDermott MM, Newman AB. Preserving clinical trial integrity during the coronavirus pandemic. JAMA 2020;323(21):2135-6. [DOI] [PubMed] [Google Scholar]
McGowan 2016
- McGowan J, Sampson M, Salzwedel DM, Cogo E, Foerster V, Lefebvre C. PRESS Peer Review of Electronic Search Strategies: 2015 guideline statement. Journal of Clinical Epidemiology 2016;75:40-6. [DOI: 10.1016/j.jclinepi.2016.01.021] [PMID: ] [DOI] [PubMed] [Google Scholar]
Meredith 2011
- Meredith S, Ward M, Booth G, Fisher A, Gamble C, House H, et al. Risk-adapted approaches to the management of clinical trials: guidance from the Department of Health (DH) / Medical Research Council (MRC)/Medicines and Healthcare Products Regulatory Agency (MHRA) Clinical Trials Working Group. Trials 2011;12:A39. [Google Scholar]
Moher 2009
- Moher D, Liberati A, Tetzlaff J, Altman DG. Preferred reporting items for systematic reviews and meta-analyses: the PRISMA statement. Journal of Clinical Epidemiology 2009;62:1006-12. [DOI] [PubMed] [Google Scholar]
Morrison 2011
- Morrison BW, Cochran CJ, White JG, Harley J, Kleppinger CF, Liu A, et al. Monitoring the quality of conduct of clinical trials: a survey of current practices. Clinical Trials 2011;8(3):342-9. [DOI] [PubMed] [Google Scholar]
OECD 2013
- Organisation for Economic Co-operation and Development. OECD recommendation on the governance of clinical trials. oecd.org/sti/inno/oecdrecommendationonthegovernanceofclinicaltrials.htm (accessed 2 July 2021).
Olsen 2016
- Olsen R, Bihlet AR, Kalakou F. The impact of clinical trial monitoring approaches on data integrity and cost? A review of current literature. European Journal of Clinical Pharmacology 2016;72:399-412. [DOI] [PubMed] [Google Scholar]
OPTIMON study protocol 2008
- OPTIMON study protocol. Study protocol: evaluation of the efficacy and cost of two monitoring strategies for public clinical research. OPTIMON study: OPTImisation of MONitoring. ssl2.isped.u-bordeaux2.fr/OPTIMON/DOCS/OPTIMON%20-%20Protocol%20v12.0%20EN%202008-04-21.pdf (accessed prior to 19 August 2021).
Oxman 1992
- Oxman AD, Guyatt GH. A consumer's guide to subgroup analyses. Annals of Internal Medicine 1992;116:78-84. [DOI] [PubMed] [Google Scholar]
Review Manager 2014 [Computer program]
- Review Manager 5 (RevMan 5). Version 5.3. Copenhagen: Nordic Cochrane Centre, The Cochrane Collaboration, 2014.
SCTO 2020
- Monitoring Platform of the Swiss Clinical Trial Organisation (SCTO) F dated. Fact sheet: central data monitoring in clinical trials? V 1.0. www.scto.ch/monitoring (accessed 2 July 2021).
Shiely 2021
- Shiely F, Foley J, Stone A, Cobbe E, Browne S, Murphy E, et al. Managing clinical trials during COVID-19: experience from a clinical research facility. Trials 2021;22:62. [DOI] [PMC free article] [PubMed] [Google Scholar]
Stenning 2018a
- Stenning SP, Cragg WJ, Joffe N, Diaz-Montana C, Choudhury R, Sydes MR, et al. Triggered or routine site monitoring visits for randomised controlled trials: results of TEMPER, a prospective, matched-pair study. Clinical Trials 2018;15:600-9. [DOI] [PMC free article] [PubMed] [Google Scholar]
Sun 2010
- Sun X, Briel M, Walter SD, Guyatt GH. Is a subgroup effect believable? Updating criteria to evaluate the credibility of subgroup analyses. BMJ 2010;340:c117. [DOI] [PubMed] [Google Scholar]
Tantsyura 2015
- Tantsyura V, Dunn IM, Fendt K. Risk-based monitoring: a closer statistical look at source document verification, queries, study size effects, and data quality. Therapeutic Innovation and Regulatory Science 2015;49:903-10. [DOI] [PubMed] [Google Scholar]
Thomas 2010 [Computer program]
- EPPI-Reviewer: software for research synthesis. EPPI-Centre Software. Thomas J, Brunton J, Graziosi S, Version 4.0. London (UK): Social Science Research Unit, Institute of Education, University of London, 2010.
TransCelerate BioPharma Inc 2014
- TransCelerateBiopharmaInc. Risk-based monitoring methodology. www.transceleratebiopharmainc.com/wp-content/uploads/2016/01/TransCelerate-RBM-Position-Paper-FINAL-30MAY2013.pdf (accessed 28 July 2021).
Treweek 2018a
- Treweek S, Bevan S, Bower P, Campbell M, Christie J, Clarke M, et al. Trial Forge Guidance 1: what is a Study Within A Trial (SWAT)? Trials 2018;19:139. [DOI: 10.1186/s13063-018-2535-5] [DOI] [PMC free article] [PubMed] [Google Scholar]
Treweek 2018b
- Treweek S, Pitkethly M, Cook J, Fraser C, Mitchell E, Sullivan F, et al. Strategies to improve recruitment to randomised trials. Cochrane Database of Systematic Reviews 2018, Issue 2. Art. No: MR000013. [DOI: 10.1002/14651858.MR000013.pub6] [DOI] [PMC free article] [PubMed] [Google Scholar]
Tudur Smith 2012a
- Tudur Smith C, Stocken DD, Dunn J, Cox T, Ghaneh P, Cunningham D, et al. The value of source data verification in a cancer clinical trial. PloS One 2012;7:e51623. [DOI] [PMC free article] [PubMed] [Google Scholar]
Tudur Smith 2014
- Tudur Smith C, Williamson P, Jones A, Smyth A, Hewer SL, Gamble C. Risk-proportionate clinical trial monitoring: an example approach from a non-commercial trials unit. Trials 2014;15:127. [DOI] [PMC free article] [PubMed] [Google Scholar]
Valdés‐Márquez 2011
- Valdés-Márquez E, Hopewell CJ, Landray M, Armitage J. A key risk indicator approach to central statistical monitoring in multicentre clinical trials: method development in the context of an ongoing large-scale randomized trial. Trials 2011;12(Suppl 1):A135. [Google Scholar]
Venet 2012
- Venet D, Doffagne E, Burzykowski T, Beckers F, Tellier Y, Genevois-Marlin E, et al. A statistical approach to central monitoring of data quality in clinical trials. Clinical Trials 2012;9:705-13. [DOI] [PubMed] [Google Scholar]
von Niederhausern 2017
- Niederhausern B, Orleth A, Schadelin S, Rawi N, Velkopolszky M, Becherer C, et al. Generating evidence on a risk-based monitoring approach in the academic setting – lessons learned. BMC Medical Research Methodology 2017;17:26. [DOI] [PMC free article] [PubMed] [Google Scholar]
Wyman Engen 2020
- Wyman Engen N, Huppler Hullsiek K, Belloso WH, Finley E, Hudson F, Denning E, et al. A randomized evaluation of on-site monitoring nested in a multinational randomized trial. Clinical Trials 2020;17(1):3-14. [DOI: 10.1177/1740774519881616] [PMID: ] [DOI] [PMC free article] [PubMed] [Google Scholar]
Young 2011
- Young T, Hopewell S. Methods for obtaining unpublished data. Cochrane Database of Systematic Reviews 2011, Issue 11. Art. No: MR000027. [DOI: 10.1002/14651858.MR000027.pub2] [DOI] [PMC free article] [PubMed] [Google Scholar]
References to other published versions of this review
Klatte 2019
- Klatte K, Pauli-Magnus C, Love S, Sydes M, Benkert P, Bruni N, et al. Monitoring strategies for clinical intervention studies. Cochrane Database of Systematic Reviews 2019, Issue 12. Art. No: MR000051. [DOI: 10.1002/14651858.MR000051] [DOI] [PMC free article] [PubMed] [Google Scholar]