

Abstract
Background
The aim of this systematic review was to evaluate current inter-modality agreement of noninvasive clinical intraventricular flow (IVF) assessment with 3 emerging imaging modalities: echocardiographic particle image velocimetry (EPIV), vector flow mapping (VFM), and 4-dimensional flow cardiovascular magnetic resonance imaging (4D flow CMR).
Methods
We performed a systematic literature review in the databases EMBASE, Medline OVID and Cochrane Central for identification of studies evaluating left ventricular (LV) flow patterns using one of these flow visualization modalities. Of the 2224 initially retrieved records, 10 EPIV, 23 VFM, and 25 4D flow CMR studies were included in the final analysis.
Results
Vortex parameters were more extensively studied with EPIV, while LV energetics and LV transport mechanics were mainly studied with 4D flow CMR, and LV energy loss and vortex circulation were implemented by VFM studies. Pooled normative values are provided for these parameters. The meta- analysis for the values of two vortex morphology parameters, vortex length and vortex depth, failed to reveal a significant change between heart failure patients and healthy controls.
Conclusion
Agreement between the different modalities studying intraventricular flow is low and different methods of measurement and reporting were used among studies. A multimodality framework with a standardized set of flow parameters is necessary for implementation of noninvasive flow visualization in daily clinical practice. The full potential of noninvasive flow visualization in addition to diagnostics could also include guiding medical or interventional treatment.
Supplementary Information
The online version contains supplementary material available at 10.1186/s12947-021-00269-8.
Keywords: Intraventricular flow, Flow mapping, Flow visualization, Multimodality imaging, vortex flow, 4d-flow cardiovascular magnetic resonance, Echocardiography
Background
The assessment of intraventricular flow (IVF) is a potential novel indicator for global ventricular function. Earlier evidence from studies on IVF by Doppler imaging suggested that these complex flow patterns and vortex formation in the left ventricle (LV) have further clinical importance in both physiological and in pathological conditions [1]. The advent of novel imaging modalities as well as advances in software and hardware technology made it possible to study these complex IVF patterns in more detail.
Noninvasive clinical evaluation of IVF and vortex formation became available with the following 3 imaging modalities in the last two decades [2–4] (Table 1):
Table 1.
Comparison of left ventricle flow visualization modalities
| Echocardiographic particle image velocimetry | Vector flow mapping | 4D flow Cardiovascular Magnetic Rensonce | |
|---|---|---|---|
| Signal source | Contrast Echocardiography | Color Flow Doppler | Phase contrast MRI |
| Flow Analysis | 2D | 2D | 3D |
| Temporal resolution | 60 Hz | 27–40 Hz | 20–40 frames/cycle* |
| Spatial resolution | 32–42 mm2 | 22 mm2 | 1.53–33 mm3 |
| Upper velocity limitation | 40 cm/sec | 2 x Nyquist limit | VENC ⁑ |
| Low velocities | Accurate | Underestimation | Accurate† |
| Scan Time | < 5 min | < 5 min | 5–15 min |
| Commercial hardware | + | + | + |
| Commercial software | + | + | – |
| Offline/online | Offline | Offline/Online ‡ | Offline |
| Contrast | Required | Not required | Not required✽ |
| Cost | Lower | Lower | Higher |
| Availability | Higher | Higher | Lower |
| Dependence on Chest anatomy | + | + | – |
| Medical implants | § | § | § |
| Assessment of LV vortex | ↑↑↑ | ↑ | ↑↑ |
| Assessment of energetics | ↑ | ↑↑ | ↑↑↑ |
| Volume analysis | – | – | ↑↑↑ |
| Estimation of pressure fields | ↑↑ | ↑↑ | ↑↑ |
| Next generation |
• High frame rate echocardiography • Blood speckle tracking • 3D-PIV |
• 3D-iVFM • Doppler Vortography |
• Multipoint 5D flow CMR |
Abbreviations VENC velocity encoding, CHD congenital heart disease, 3D-PIV 3-dimensional particle image velocimetry, 3D-iVFM 3-dimensional vector flow mapping *number of reconstructed phases, this value is set by the operator ⁑ usually set 150,200 cm/sec. † underestimation of turbulent - nonlaminar flow ‡ the VFM analysis software is integrated on Hitachi echocardiography machines ✽ contrast is not strictly necessary but might increase signal to noise ratio,§. increased artifact with prosthetic material, difficulty in obtaining images in proper angles with assist device cannulae, increased artifact generation with resultant decrease in image quality as well as safety concerns, (−): not applicable/not available (+): present, objective strength in assessments (−) not applicable/not available, ↑: lower strength, ↑↑: moderate strength, ↑↑↑: higher strength
1) Echocardiographic particle image velocimetry (EPIV) tracks the motion of intravenously injected ultrasound contrast agents (UCA) in (usually 2D) ultrasound image sequences to obtain a Eulerian velocity field over the whole region of interest (usually the LV) [5, 6]. Main advantages are bedside applicability, low cost and high spatiotemporal resolution. Main limitations are the necessity of UCA, planar simplification arising from the assumption that the speckles stay in-plane, and dependence on chest anatomy [7].
2) Vector flow mapping (VFM) utilizes color Doppler imaging (CDI) for constructing velocity fields [2, 8]. Frame-by-frame analysis reveals flow patterns in the LV [9]. It allows bedside evaluation of IVF without the need of UCA. There are several limitations of this technique. Because frame rate could drop below 20 Hz when imaging the LV, data from multiple cardiac cycles are combined to improve the velocity tracking accuracy. In addition, calculation of angular component of the velocity vectors is based on various different algorithms in different approaches and none of these algorithms are validated thoroughly [7].
3) 4-dimensional flow cardiovascular magnetic resonance imaging (4D flow CMR) is a technique with time-resolved flow-encoding capabilities in three spatial dimensions. 3D velocity encoding resulted in the evolution of 4D flow CMR from the conventional 2D-phase contrast CMR (2D-PC CMR) (10). The main advantage of this technique is the 3D flow assessment and independence of the chest anatomy, while the main disadvantages would be longer scan times, limited accuracy in presence of turbulent flows, relatively low availability and higher cost compared with ultrasound based modalities (11) (Table 1).
Despite the well-established framework of IVF with each modality separately, the inter-modality agreement with regard to quantitative measures of normal IVF was not studied before. Therefore, we aimed in this current review 1) to evaluate inter-modality implementation of parameters of IVF, 2) to provide normative values for parameters that are frequently reported in the literature, 3) to perform a meta-analysis for changes in flow parameters in patients with LV systolic dysfunction, and 4) to review the future perspectives in the field of noninvasive IVF imaging.
Methods
Search strategy
A systematic review was conducted for evaluating inter-modality agreement in analysis of LV flow. The search was performed in compliance with Preferred Reporting Items for Systematic Reviews and Meta-Analyses (PRISMA) statement (12). The search was performed on February 11th, 2019 in the databases EMBASE, Medline OVID, and Cochrane central with structured keywords (Supplementary Table 1). Following deduplication, two independent authors (FOM, AvdB) performed title and abstract screening (13).
Inclusion and exclusion criteria
The current study focused on the IVF findings in healthy adults. Studies that enrolled at least 10 healthy participants and examined LV flow patterns with EPIV, VFM, or 4D flow CMR were included. Studies conducted on animals, children, or in-vitro models were excluded. Additionally, studies published in a language other than English were also excluded. Supplementary Tables 2, 3, and 4 display the list of the included studies for EPIV, VFM, and 4D flow CMR, respectively.
Data extraction
One author (FOM) extracted all the relevant data using a spreadsheet. A second author verified these findings (AvdB). The following data were collected: year of publication, first author, number of healthy participants / patients, quantitative measures, and qualitative descriptors of IVF.
Data analysis
Continuous variables were presented as mean ± standard deviation. Categorical variables were presented as percentages. Normative values of parameters implemented by multiple studies were calculated, when the method of measurement was uniform. A meta-analysis procedure was executed for two parameters reported both in healthy adult controls and heart failure patients: vortex depth and vortex length. Heterogeneity indexes (I2) were calculated for the pooled results with the metaphor package, in R statistical software (version 3.5.2) (14). The random effects model was utilized for the calculation of the heterogeneity index.
Results
Figure 1 displays the PRISMA chart of the study inclusion process. Two studies were found and added by cross-referencing (15, 16). Of the finally included 58 studies, 10 utilized EPIV, 23 VFM, and 25 4D flow CMR.
Fig. 1.

Inclusion of studies, flowchart modified from the Prisma statement for reporting systematic reviews and meta-analyses [12]
The IVF parameters were classified in four major groups: parameters of 1) LV vortex, 2) LV energetics, 3) LV transport mechanics, 4) LV pressure and velocity fields. A previous framework suggested by Mele et al. was modified for this classification (5). While EPIV studies paid more attention to LV vortex analysis, 4D flow CMR studies more often focused on characterizing LV energetics and LV transport mechanics. VFM studies also mainly focused on LV energetics. There were four 4D flow CMR, three EPIV and two VFM studies that reported intraventricular velocity and pressure profiles. These parameters are summarized in Supplementary Table 5.
Table 2 demonstrates LV vortex parameters. These parameters defined four aspects of LV vortex: 1) size and localization, 2) timing, 3) extent of vortical (or swirling) motion, and 4) the extent of fluctuations in LV vortex throughout the cardiac cycle. Vortex area/or volume was reported by all three modalities. However, there was no inter-modality standardization on methods of measurement for this parameter. While the ultrasound-based modalities have reported 2D vortex parameters, 4D flow CMR allowed the 3D characterization of the torus-shaped LV vortex (Fig. 2) (17). Vortex circulation, although terming varied among studies, was another LV parameter implemented by multimodality imaging. There was significant inter-modality heterogeneity with regard to value ranges (15).
Table 2.
Left ventricular vortex parameters by multimodality imaging
| Parameters | Definition | EPIV | VFM | 4D flow CMR | Clinical implications | Ref. |
|---|---|---|---|---|---|---|
| Size and localization of the vortex | Increased vortex depth, length, radius and area values in patients with LV systolic dysfunction | [s.1–7] | ||||
| Vortex length | Apico-basal diameter indexed to LV length | + | – | + | ||
| Vortex width | Mediolateral diameter indexed to LV transverse width | + | – | + | ||
| Vortex radius | Maximum or mean radius/diameter of the vortex | – | + | – | ||
| Vortex size | Vortex area, absolute value or indexed to LV area | + | + | + | ||
| Vortex depth | Distance to the mitral annulus indexed to LV length | + | – | + | ||
| Vortex transversal position | Distance of the vortex core to septum, indexed to LV length | + | – | + | ||
| Vortex sphericity index | Vortex width indexed to vortex length | + | – | + | ||
| Timing and duration of the vortex | Delayed diastolic vortex formation, longer duration of persistence of vortex during ejection time despite unchanged total vortex duration in DCM patients | [s.6, 8–10] | ||||
| Vortex duration | Duration of vortex in the LV | + | + | – | ||
| Time to diastolic vortex formation | Time from mitral valve opening to vortex formation | + | – | – | ||
| Vorticity parameters | Significant heterogeneity in reported value ranges as well as the direction of change with diseases compared with controls | [s.3, 6, 8, 11–21] | ||||
| Vortex circulation | Vorticity over the main diastolic vortex | + | + | + | ||
| Vortex strength | Clockwise and counterclockwise vorticity indexed to total LV circulation | + | – | – | ||
| Vorticity fluctuation index | Standard deviation of the squared vorticity | + | – | – | ||
| Reynolds number | V.D/v, where V is linear velocity, D is the diameter of flow chamber and v is the kinematic viscosity. Higher number indicates increased vortical flow. | – | + | + | Higher mean Reynolds numbers in the LV in patients with heart failure. No difference between controls and patients with Fontan circulation. | [s.8, 21] |
| Vortex pulsatility parameters | [s.16, 22, 23] | |||||
| Relative strength | Pulsatile/nonpulsatile vorticity over LV | + | – | – | Lower in DCM patients, higher in patients with left bundle branch block compared to healthy controls. | |
| Vortex relative strength | Pulsatile/nonpulsatile vorticity over vortex | + | – | – | ||
| Vortex Pulsation correlation | Correlation of steady and pulsatile vortex components with zeroeth order vorticity | + | – | – |
EPIV echocardiographic particle image velocimetry, VFM vector flow mapping, 4D flow CMR 4-dimensional flow cardiovascular magnetic resonance, LV left ventricle, DCM dilated cardiomyopathy, (−) not available, (+) available
Fig. 2.
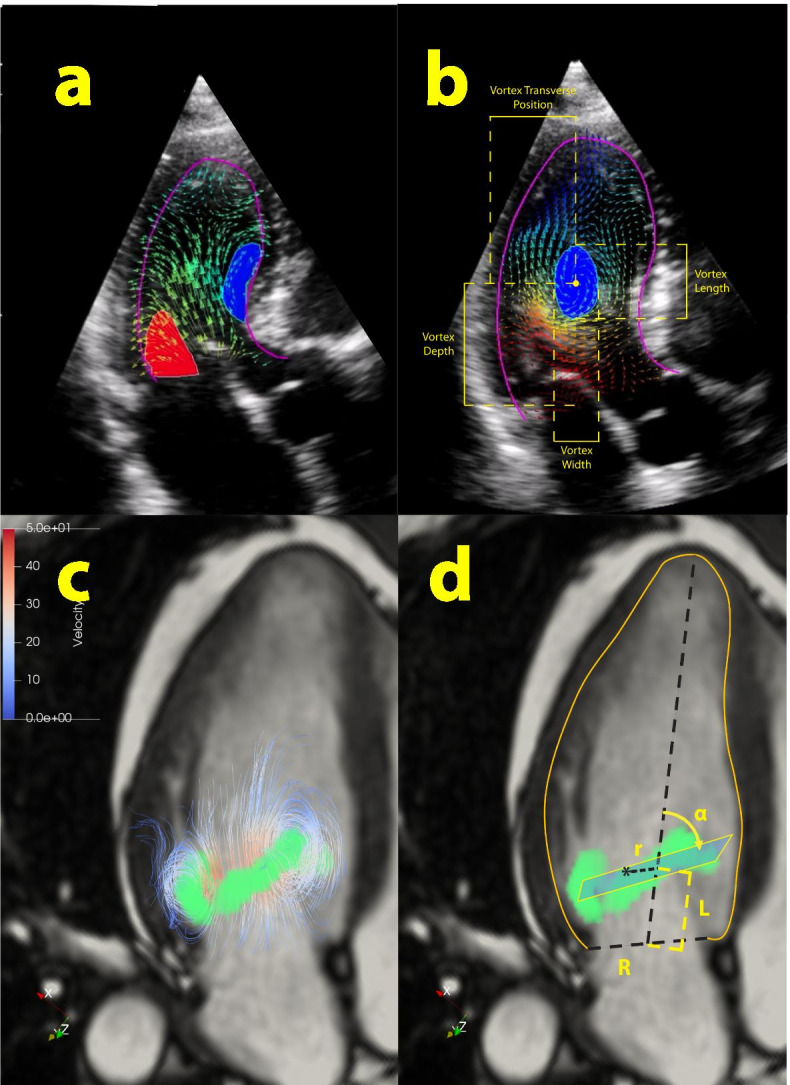
A. Early diastolic vortex ring demonstrated by EPIV, with clockwise anterior (blue) and anti-clockwise posterior (red) arms. B. 2-dimensional quantification of the late diastolic vortex core by Hyperflow software. Vortex length and vortex depth are indexed to LV apicobasal length while vortex width and vortex transversal position are indexed to LV posterioseptal length. C. Three dimensional structure of the toroid early diastolic LV vortex demonstrated by 4D flow CMR D. 3-dimensional quantification of the early diastolic vortex ring. Radial coordinate (r) is indexed to basal endocardial radius (R). Longitudinal coordinate (L) is indexed to LV apicobasal length. Vortex ring orientation (α) is the angle between the vortex plane and the LV longitudinal axis
Parameters of LV energetics and LV blood transport mechanics are demonstrated in Table 3. All three modalities reported energy expenditure (or loss) over the LV; however, the measurement methods differed. A unitless cumulative kinetic energy dissipation index was reported by EPIV whereas a viscous planar energy loss value was reported by VFM. 4D flow CMR was superior in the fact that three different parameters of energetics; viscous energy loss, kinetic energy dissipation, and turbulent kinetic energy could be reported in a 3D manner. Parameters of LV blood transport mechanics were mainly studied with the use of 4D flow CMR. One of these parameters, Vdirect, is the volume that enters and leaves LV in a single beat, and has been suggested as a measure of LV pump efficiency and found to be decreased in patients with impaired LV systolic function. There is low level of agreement between modalities with regard to parameters of the IV velocity and pressure profiles. These parameters are presented in Supplementary Table 5.
Table 3.
Parameters of left ventricular energetics / blood transport mechanics
| Parameter | Definition | EPIV | VFM | 4D flow CMR | Clinical Implications | Ref. |
|---|---|---|---|---|---|---|
| LV Energetics | [s.11, 21, 24–32] | |||||
| Kinetic Energy Dissipation | Kinetic energy over LV | + | – | + | Kinetic energy dissipation was increased in post-MI patients with LVEF > 50%, decreased in patients with ischemic LVSD and TOF, increased in patients with DCM and Fontan circulation. Turbulent kinetic energy was increased in DCM patients, the values increase with increasing size of LV. Energy loss was increased with cardiovascular disease/systemic diseases with cardiovascular involvement. | |
| Turbulent kinetic energy | Velocity fluctuation intensity in perpendicular directions | – | – | + | ||
| Energy loss | Total energy loss dissipated as kinetic energy and viscous friction | – | + | + | ||
| LV blood transport mechanics | [s.11, 33] | |||||
| Direct volume | Volume of blood entering the LV and leaving in the analyzed beat | + | – | + | Vdirect was the parameter with the most robust evidence. It has shown to be a surrogate marker of LV energetic efficiency. It constitutes the majority of the VEDV, maintains a position closer to LVOT and a smaller angle to LVOT axis and correlates with LVEF significantly. | |
| Delayed ejection volume | Volume not entered the LV in the previous beat but ejects in the analyzed beat | – | – | + | ||
| Retained flow | Volume entering the LV but not ejecting in the analyzed beat | – | – | + | ||
| Residual flow | Volume not entering and not leaving in the analyzed beat | – | – | + |
EPIV: echocardiographic particle image velocimetry, VFM: vector flow mapping, 4D flow CMR: 4-dimensional flow cardiovascular magnetic resonance imaging, LV: left ventricle, LVSD: left ventricle systolic dysfunction, TOF: Tetralogy of Fallot, DCM: dilated cardiomyopathy, MI: myocardial infarction, LVEF: left ventricle ejection fraction, LVEDV: left ventricle end-diastolic volume, LVOT: left ventricle outflow tract, (−) not available, (+) available
Normative values of the commonly reported LV flow parameters are summarized in Table 4. The most commonly reported parameters (in more than 100 patients) in healthy individuals were energy loss, vortex circulation, vortex length, and vortex area. A meta-analysis was performed for change of LV flow in patients with LV systolic dysfunction for two vortex parameters: vortex length and vortex depth (Fig. 3). A high heterogeneity index with no significant difference between controls versus heart failure with reduced ejection fraction patients was demonstrated for both parameters (Vortex Length: 0.53 ± 0.59 versus 0.61 ± 0.57, t = 0.56, p = .632, I2 = 89%, p < .001; Vortex Depth: 0.44 ± 0.31 versus 0.38 ± 0.33, t = 0.48, p = .679, I2 = 77%, p < .001, for heart failure patients versus healthy adults, respectively).
Table 4.
Normative ranges for the parameters of intraventricular flow
| Imaging modality | Pooled n | Mean ± S.D. | Ref. | |
|---|---|---|---|---|
| Size and localization of the vortex | ||||
| Vortex Area (/LVEDA) | EPIV | 104 | 0.29 ± 0.08 | [s.10, 11, 13, 15, 22, 24] |
| Vortex length (/LV width) | EPIV | 126 | 0.61 ± 0.27 | [s.10, 11, 13, 16, 22–24, 34] |
| Vortex depth (/LV width) | EPIV | 85 | 0.40 ± 0.11 | [s.11, 16, 22–24] |
| Vorticity Parameters | ||||
| Vortex Circulation (cm2/s) | VFM | 135 | 16.3 ± 11.1 | [s.3, 6, 19] |
| Vortex Pulsatility Parameters | ||||
| Relative Strength | EPIV | 35 | 1.6 ± 0.6 | [s.16, 22, 23] |
| Vortex Relative Strength | EPIV | 35 | 0.6 ± 0.3 | [s.16, 22, 23] |
| Vortex Pulsation Correlation | EPIV | 35 | 0.3 ± 0.6 | [s.16, 22, 23] |
| LV Energetics | ||||
| Kinetic Energy Dissipation | EPIV | 80 | 0.5 ± 0.2 | [s.11, 13, 24, 34] |
| Kinetic Energy Fluctuation | EPIV | 60 | 1.8 ± 0.3 | [s.11, 13, 24] |
| Energy Loss Systolic (mW/m) | VFM | 203 | 16.2 ± 7.2 | [s.29, 30, 35, 36] |
| Energy Loss Diastolic (mW/m) | VFM | 203 | 22.7 ± 8.2 | [s.29, 30, 35, 36] |
| Peak kinetic energy systole (mJ) | 4D flowCMR | 44 | 3.9 ± 1.1 | [s.21, 37, 38] |
| LV blood transport mechanics | ||||
| Vdirect (%) | 4D flow CMR | 74 | 37 ± 5 | [s.33, 39–41] |
| Retained flow (%) | 4D flow CMR | 74 | 18 ± 5 | [s.33, 39–41] |
| Delayed ejection flow (%) | 4D flow CMR | 74 | 17 ± 3 | [s.33, 39–41] |
| Residual volume (%) | 4D flow CMR | 74 | 28 ± 5 | [s.33, 39–41] |
E-PIV echocardiographic particle image velocimetry, VFM vector flow mapping, 4D flowCMR 4-dimensional flow cardiovascular magnetic resonance, LVEDA left ventricle end-diastolic area, EDV end-diastolic volume
Fig. 3.

Meta-analysis for vortex length (A) and depth (B) in heart failure with reduced ejection fraction patients versus healthy controls with EPIV. SD: standard deviation, SMD: standard mean difference, CI: confidence interval
Discussion
Identification of flow patterns in the heart and their clinical implications has evolved as a major endeavor of research in cardiovascular imaging. All the three dedicated noninvasive cardiovascular flow imaging modalities discussed in this paper, are commercially available for clinical use; however, the flow imaging data is still not implemented in clinical practice. The current study demonstrated important pitfalls and areas that need improvement.
The findings from this review could be summarized as follows: 1) there is virtually no inter-modality standardization with regard to methods of analysis, units of measurement or ranges of normative values for IVF parameters, 2) vortex area and vortex length with EPIV, energy loss with VFM; and LV-volumes analyzed by particle tracing with 4D flow CMR were the main parameters over which intra-modality agreement was found, and 3) meta-analysis of the differences of two vortex parameters, vortex length and vortex depth, demonstrated no significant difference between controls and heart failure patients.
Previous validation studies demonstrated accurate evaluation of flow with EPIV (18), VFM (19) and 4D flow CMR (20), in describing velocity fields, mainly against phantom models. Inter-modality agreement of the velocity fields was also evaluated in healthy individuals for VFM versus 4D flow CMR previously (21). However, cross-validation of the parameters calculated by post-processing of the velocity fields, summarized in Tables 2 and 3 is largely lacking, mainly because these parameters are not available on the analysis software of each modality. There is intra-modality agreement with regard to utilized software for EPIV and VFM. For 4D flow CMR, use of in house custom software allows calculation of additional parameters, such as 3D vorticity (22) and 3D morphology parameters (17) (Supplementary Tables 2 and 3, Fig. 2). Additionally, inherent technical limitations of the modalities may result in inaccuracies in measurement of certain parameters with certain modalities. For example, EPIV highly underestimates the velocity value and is inappropriate for KE that is dominated by high velocities; KE dissipation is a combination of velocity gradients and it necessarily depends on the spatial resolution that is very different among modalities; and vortex geometry depends on the pattern of low velocity that is inaccurate in VFM.
Our findings highlight the need for validating of flow parameters used in the studies against gold standard tests and in between modalities, as well as standardization in measurement methods and reporting. We additionally presented normative values for flow parameters over which intra-modality agreement was present. Energy loss, analyzed by VFM, was the most commonly reported parameter and was found increased in cardiovascular disease as well as cardiovascular involvement in systemic disease, such as diabetes mellitus [23] and end-stage renal disease [24]. This parameter was also implemented by 4D flow CMR with the use of experimental software, and was associated with disturbed vortex pattern in patients with surgically repaired atrioventricular septal defect [17].
Parameters of vortex size and localization were comprehensively studied with EPIV. One of them, vortex area, was also implemented by VFM [25] and 4D flow CMR [26]. The finding of larger vortices that descend deeper into the LV in patients with left ventricle systolic dysfunction was confirmed with VFM [25]. In contrast, in our meta-analysis we didn’t observe a statistically significant difference between controls and HF patients, when vortex size is evaluated by vortex length. This shows that the findings from the small observational studies should be interpreted with caution until the changes in parameters in patients are validated in large cohorts. Of note, most clinical studies about LV flow are aimed to search which parameters, if any, may provide useful indications regarding LV function that is incremental with respect to existing parameters. Probably, none of them has been successful so far. Thus, the heterogeneity of results with the different modalities, occasionally also within a same modality, is partly imputable to the fact that these are research-oriented studies, which favored the exploration of potential measures rather than the rigor of their reproducibility.
The LV transport mechanics were studied with delineation of the LV volume fractions by particle tracing with 4D flow CMR. 4D flow CMR findings that this parameter reflects the efficiency of LV as a pump and was decreased in patients with LVSD. A 2D implementation of Vdirect with EPIV demonstrated findings similar to 4D-CMR version. [27]. The role of the Vdirect as a marker of the efficiency of LV transport should be further investigated.
We suggest implementing a small set of 2D parameters that could be measured with all these three modalities. This small set of parameters could be integrated in the flow analysis software of all three modalities, standardized with respect to measurement method and reporting, and should be tested in large cohorts of healthy individuals to determine the reference ranges. Additionally, the modalities should be cross-validated against each other. In this manner, a common terminology and language, which is vital for use in clinical settings, could be reached. There is a clear need for a multimodality flow visualization taskforce, with clinicians and engineers working with different modalities including industry representatives for inter-modality standardization of parameters and to coordinate clinical implementation.
Future perspectives
Although the novel flow visualization modalities allowed measurement of new parameters, there is no clinical implementation of these parameters. The flow transit (Vdirect) is one of the most promising parameters, although it is still unclear if it provides additional information with respect to EF; energetic properties require a standardization to make them independent of image resolution and acquisition/filtering settings; intraventricular pressure gradient (or hemodynamic force) is another candidate although first results (EPIV and 4D flow CMR) are not yet conclusive. Inherent technical limitations causing decreased accuracy is probably the most important limiting factor in implementation of these novel parameters in the clinical practice.
There is ongoing research that aims overcoming the limitations of the current modalities. High frame rate echocardiography is an upgrade to EPIV which was shown to accurately track IVF velocities [28]. For pediatric imaging, blood speckle tracking using high frame rate echocardiography, can estimate blood velocity fields without the need for ultrasound contrast agent - making it a promising tool for studying congenital heart dysfunction; however its use in adults is currently limited due to low signal to noise ratio at depths greater than 8 cm [29].
There are 2 successors of VFM: Doppler vortography and 3D-iVFM. Doppler vortography relies on a fast detection algorithm for identification of vortex cores on CDI acquisition [30]. This technique was recently combined with high frame rate imaging and demonstrated good to excellent agreement with 4D flow CMR in measurement of LV vorticity [31]. 3D-iVFM, based on 3D ultrafast Doppler imaging, allowed temporal resolutions more than 1000 volumes/sec with promising initial in-vivo results [32]. The 3-dimensional EPIV and VFM might allow the same 3D parameters as 4D flow CMR to be measured.
For 4D flow CMR, intravoxel velocity standard deviation mapping, or turbulence mapping is based on introduction of additional velocity encoding points for each spatial axis. With Bayesian processing, this method allows the turbulent flow in voxels to be estimated. Respiratory motion resolved imaging instead of respiratory gating is introduced to make scan times shorter and more predictable. The combination of these 2 techniques is termed Multipoint 5D Flow MRI [33]. Automatic and semi-automatic segmentation decrease analysis time, intra and interobserver variability and as a result is expected to increase precision in the future [34].
Conclusions
The inter-modality agreement with regard to intracardiac flow parameters is not sufficient for clinical implementation, a single parameter that is measured the same way with all 3 modalities is missing. A standardized set of flow parameters, with well-defined reference ranges will substantially facilitate translation of the insights from IVF visualization to clinical practice. Coordinated interdisciplinary efforts of professionals working in the field, along with technical advances will unleash the full potential of flow visualization in diagnosis and treatment of cardiovascular disease.
Supplementary Information
Additional file 1: Supplementary table 1. Keywords used for database search. Supplementary table 2. Included EPIV studies. Supplementary table 3. Included and excluded VFM studies. Supplementary table 4. Included and excluded 4D flow CMR studies. Supplementary table 5. Intraventricular velocity and pressure profiles.
Additional file 2. Supplementary references
Additional file 3. Graphical abstract. Noninvasive flow visualization with multimodality imaging.
Acknowledgements
Not applicable.
Abbreviations
- IVFf
Intraventricular flow
- EPIV
Echocardiographic particle image velocimetry
- VFM
Vector flow mapping
- 4D flow CMR
4-dimensional flow cardiovascular magnetic resonance imaging
- LV
Left ventricle
- UCA
Ultrasound contrast agent
- CDI
Color doppler imaging
- 2D-PC CMR
2D-phase contrast CMR
Authors’ contributions
Conception (FOM, AvdB), design of the work (FOM, NvdV, JV, JGB, JWRH, RJvdG, AH, AvdB), acquisition&analysis (FOM, AvdB, NvdV), interpretation of the data (FOM, JWRH, AvdB), the creation of new software used in the work (not applicable), drafting and/or substantial revision of the work (FOM, NvdV, JV, JGB, JWRH, RJvdG, AH, AvdB). All the authors have approved the submitted version (and any substantially modified version that involves the author’s contribution to the study), and to have agreed both to be personally accountable for the author’s own contributions and to ensure that questions related to the accuracy or integrity of any part of the work, even ones in which the author was not personally involved, are appropriately investigated, resolved, and the resolution documented in the literature.
Funding
Dr. Ferit Onur Mutluer is the recipient of a Turkish Society of Cardiology Research Grant for the year 2019 and an European Association of Cardiovascular Imaging (EACVI) research grant for the year 2020.
Availability of data and materials
The datasets used and/or analysed during the current study are available from the corresponding author on reasonable request.
Declarations
Ethics approval and consent to participate
Not applicable.
Consent for publication
Not applicable.
Competing interests
The authors declare that they have no competing interests.
Footnotes
Publisher’s Note
Springer Nature remains neutral with regard to jurisdictional claims in published maps and institutional affiliations.
References
- 1.Delemarre BJ, Bot H, Visser CA, Dunning AJ. Pulsed Doppler echocardiographic description of a circular flow pattern in spontaneous left ventricular contrast. J Am Soc Echocardiogr. 1988;1(2):114–118. doi: 10.1016/S0894-7317(88)80092-0. [DOI] [PubMed] [Google Scholar]
- 2.Garcia D, Del Alamo JC, Tanne D, Yotti R, Cortina C, Bertrand E, et al. Two-dimensional intraventricular flow mapping by digital processing conventional color-Doppler echocardiography images. IEEE Trans Med Imaging. 2010;29(10):1701–1713. doi: 10.1109/TMI.2010.2049656. [DOI] [PubMed] [Google Scholar]
- 3.Willert CE, Gharib M. Digital particle image velocimetry. Exp Fluids. 1991;10(4):181–193. doi: 10.1007/BF00190388. [DOI] [Google Scholar]
- 4.Bolger AF, Heiberg E, Karlsson M, Wigstrom L, Engvall J, Sigfridsson A, et al. Transit of blood flow through the human left ventricle mapped by cardiovascular magnetic resonance. J Cardiovasc Magn Reson. 2007;9(5):741–747. doi: 10.1080/10976640701544530. [DOI] [PubMed] [Google Scholar]
- 5.Mele D, Smarrazzo V, Pedrizzetti G, Capasso F, Pepe M, Severino S, et al. Intracardiac flow analysis: techniques and potential clinical applications. J Am Soc Echocardiogr. 2019;32(3):319–332. doi: 10.1016/j.echo.2018.10.018. [DOI] [PubMed] [Google Scholar]
- 6.Kheradvar A, Houle H, Pedrizzetti G, Tonti G, Belcik T, Ashraf M, et al. Echocardiographic particle image Velocimetry: a novel technique for quantification of left ventricular blood Vorticity pattern. J Am Soc Echocardiogr. 2010;23(1):86–94. doi: 10.1016/j.echo.2009.09.007. [DOI] [PubMed] [Google Scholar]
- 7.Assi KC, Gay E, Chnafa C, Mendez S, Nicoud F, Abascal JFPJ, et al. Intraventricular vector flow mapping-a Doppler-based regularized problem with automatic model selection. Phys Med Biol. 2017;62(17):7131–7147. doi: 10.1088/1361-6560/aa7fe7. [DOI] [PubMed] [Google Scholar]
- 8.Fukuda N, Itatani K, Ebihara A, Uno K, et al. Prolonged vortex formation during the ejection period in the left ventricle with low ejection fraction: a study by vector flow mapping. J Med Ultrason (2001) 2014;41(3):301–10. doi: 10.1007/s10396-014-0530-3. [DOI] [PubMed] [Google Scholar]
- 9.Bermejo J, Martínez-Legazpi P, del Alamo JC. The clinical assessment of intraventricular flows. Annu Rev Fluid Mech. 2015;47:315–342. doi: 10.1146/annurev-fluid-010814-014728. [DOI] [Google Scholar]
- 10.van der Geest RJ, Garg P. Advanced analysis techniques for intra-cardiac flow evaluation from 4D flow MRI. Curr Radiol Rep. 2016;4:38. doi: 10.1007/s40134-016-0167-7. [DOI] [PMC free article] [PubMed] [Google Scholar]
- 11.Dyverfeldt P, Bissell M, Barker AJ, Bolger AF, Carlhall CJ, Ebbers T, et al. 4D flow cardiovascular magnetic resonance consensus statement. J Cardiovasc Magn Reson. 2015;17(1):72. doi: 10.1186/s12968-015-0174-5. [DOI] [PMC free article] [PubMed] [Google Scholar]
- 12.Liberati A, Altman DG, Tetzlaff J, Mulrow C, Gøtzsche PC, Ioannidis JPA, et al. The PRISMA statement for reporting systematic reviews and meta-analyses of studies that evaluate health care interventions: explanation and elaboration. PLoS Med. 2009;6(7):e1000100. doi: 10.1371/journal.pmed.1000100. [DOI] [PMC free article] [PubMed] [Google Scholar]
- 13.Bramer WM, Milic J, Mast F. Reviewing retrieved references for inclusion in systematic reviews using EndNote. J Med Libr Assoc. 2017;105(1):84–87. doi: 10.5195/JMLA.2017.111. [DOI] [PMC free article] [PubMed] [Google Scholar]
- 14.Viechtbauer W. Conducting meta-analyses in R with the metafor package. J Stat Softw. 2010;36(3):1–48. doi: 10.18637/jss.v036.i03. [DOI] [Google Scholar]
- 15.Cimino S, Pedrizzetti G, Tonti G, Canali E, Petronilli V, De Luca L, et al. In vivo analysis of intraventricular fluid dynamics in healthy hearts. Eur J Mech B Fluids. 2012;35:40–46. doi: 10.1016/j.euromechflu.2012.03.014. [DOI] [Google Scholar]
- 16.Eriksson J, Bolger AF, Ebbers T, Carlhall CJ. Assessment of left ventricular hemodynamic forces in healthy subjects and patients with dilated cardiomyopathy using 4D flow MRI. Physiol Rep. 2016;4(3):e12685. doi: 10.14814/phy2.12685. [DOI] [PMC free article] [PubMed] [Google Scholar]
- 17.Elbaz MS, van der Geest RJ, Calkoen EE, de Roos A, Lelieveldt BP, Roest AA, et al. Assessment of viscous energy loss and the association with three-dimensional vortex ring formation in left ventricular inflow: in vivo evaluation using four-dimensional flow MRI. Magn Reson Med. 2017;77(2):794–805. doi: 10.1002/mrm.26129. [DOI] [PMC free article] [PubMed] [Google Scholar]
- 18.Westerdale J, Belohlavek M, McMahon EM, Jiamsripong P, Heys JJ, Milano M. Flow velocity vector fields by ultrasound particle imaging velocimetry: in vitro comparison with optical flow velocimetry. J Ultrasound Med. 2011;30(2):187–195. doi: 10.7863/jum.2011.30.2.187. [DOI] [PubMed] [Google Scholar]
- 19.Asami R, Tanaka T, Kawabata KI, Hashiba K, Okada T, Nishiyama T. Accuracy and limitations of vector flow mapping: left ventricular phantom validation using stereo particle image velocimetory. J Echocardiogr. 2017;15(2):57–66. doi: 10.1007/s12574-016-0321-5. [DOI] [PMC free article] [PubMed] [Google Scholar]
- 20.Bock J, Töger J, Bidhult S, Markenroth Bloch K, Arvidsson P, Kanski M, et al. Validation and reproducibility of cardiovascular 4D-flow MRI from two vendors using 2 × 2 parallel imaging acceleration in pulsatile flow phantom and in vivo with and without respiratory gating. Acta Radiol. 2018;60(3):327–337. doi: 10.1177/0284185118784981. [DOI] [PMC free article] [PubMed] [Google Scholar]
- 21.Kojima T, Kameyama T, Nakajima H, Khmyrova E, Kurokawa T, Saijo Y. Evaluation of vortex flow in left ventricle by echo-dynamography and phase contrast magnetic resonance angiography. Conf Proc IEEE Eng Med Biol Soc. 2012;2012:2676–2679. doi: 10.1109/EMBC.2012.6346515. [DOI] [PubMed] [Google Scholar]
- 22.Schafer M, Browning J, Schroeder JD, Shandas R, Kheyfets VO, Buckner JK, et al. Vorticity is a marker of diastolic ventricular interdependency in pulmonary hypertension. Pulm Circ. 2016;6(1):46–54. doi: 10.1086/685052. [DOI] [PMC free article] [PubMed] [Google Scholar]
- 23.Li CM, Bai WJ, Liu YT, Tang H, Rao L. Dissipative energy loss within the left ventricle detected by vector flow mapping in diabetic patients with controlled and uncontrolled blood glucose levels. Int J Cardiovasc Imaging. 2017;33(8):1151–1158. doi: 10.1007/s10554-017-1100-8. [DOI] [PubMed] [Google Scholar]
- 24.Zhong Y, Liu Y, Wu T, Song H, Chen Z, Zhu W, et al. Assessment of left ventricular dissipative energy loss by vector flow mapping in patients with end-stage renal disease. J Ultrasound Med. 2016;35(5):965–973. doi: 10.7863/ultra.15.06009. [DOI] [PubMed] [Google Scholar]
- 25.Bermejo J, Benito Y, Alhama M, Yotti R, Martinez-Legazpi P, Del Villar CP, et al. Intraventricular vortex properties in nonischemic dilated cardiomyopathy. Am J Physiol Heart Circ Physiol. 2014;306(5):H718–H729. doi: 10.1152/ajpheart.00697.2013. [DOI] [PMC free article] [PubMed] [Google Scholar]
- 26.Foll D, Taeger S, Bode C, Jung B, Markl M. Age, gender, blood pressure, and ventricular geometry influence normal 3D blood flow characteristics in the left heart. Eur Heart J Cardiovasc Imaging. 2013;14(4):366–373. doi: 10.1093/ehjci/jes196. [DOI] [PubMed] [Google Scholar]
- 27.Agati L, Cimino S, Tonti G, Cicogna F, Petronilli V, De Luca L, et al. Quantitative analysis of intraventricular blood flow dynamics by echocardiographic particle image velocimetry in patients with acute myocardial infarction at different stages of left ventricular dysfunction. Eur Heart J Cardiovasc Imaging. 2014;15(11):1203–1212. doi: 10.1093/ehjci/jeu106. [DOI] [PubMed] [Google Scholar]
- 28.Voorneveld J, Keijzer LBH, Strachinaru M, Bowen DJ, Goei JSL, Ten Cate F, et al. High-frame-rate Echo-particle image Velocimetry can measure the high-velocity diastolic flow patterns. Circ Cardiovasc Imaging. 2019;12(4):e008856. doi: 10.1161/CIRCIMAGING.119.008856. [DOI] [PubMed] [Google Scholar]
- 29.Nyrnes SA, Fadnes S, Wigen MS, Mertens L, Lovstakken L. Blood Speckle-Tracking Based on High-Frame Rate Ultrasound Imaging in Pediatric Cardiology. J Am Soc Echocardiogr. 2020;33(4):493–503.e5. doi: 10.1016/j.echo.2019.11.003. [DOI] [PubMed] [Google Scholar]
- 30.Mehregan F, Tournoux F, Muth S, Pibarot P, Rieu R, Cloutier G, et al. Doppler vortography: a color doppler approach to quantification of intraventricular blood flow vortices. Ultrasound Med Biol. 2014;40(1):210–221. doi: 10.1016/j.ultrasmedbio.2013.09.013. [DOI] [PMC free article] [PubMed] [Google Scholar]
- 31.Faurie J, Baudet M, Assi KC, Auger D, Gilbert G, Tournoux F, et al. Intracardiac Vortex dynamics by high-frame-rate Doppler Vortography-in vivo comparison with vector flow mapping and 4-D flow MRI. IEEE Trans Ultrason Ferroelectr Freq Control. 2017;64(2):424–432. doi: 10.1109/TUFFC.2016.2632707. [DOI] [PubMed] [Google Scholar]
- 32.Provost J, Papadacci C, Arango JE, Imbault M, Fink M, Gennisson J-L, et al. 3D ultrafast ultrasound imaging in vivo. Phys Med Biol. 2014;59(19):L1–L13. doi: 10.1088/0031-9155/59/19/L1. [DOI] [PMC free article] [PubMed] [Google Scholar]
- 33.Walheim J, Dillinger H, Kozerke S. Multipoint 5D flow cardiovascular magnetic resonance - accelerated cardiac- and respiratory-motion resolved mapping of mean and turbulent velocities. J Cardiovasc Magn Reson. 2019;21(1):42. doi: 10.1186/s12968-019-0549-0. [DOI] [PMC free article] [PubMed] [Google Scholar]
- 34.Bustamante M, Gupta V, Forsberg D, Carlhäll CJ, Engvall J, Ebbers T. Automated multi-atlas segmentation of cardiac 4D flow MRI. Med Image Anal. 2018;49:128–140. doi: 10.1016/j.media.2018.08.003. [DOI] [PubMed] [Google Scholar]
Associated Data
This section collects any data citations, data availability statements, or supplementary materials included in this article.
Supplementary Materials
Additional file 1: Supplementary table 1. Keywords used for database search. Supplementary table 2. Included EPIV studies. Supplementary table 3. Included and excluded VFM studies. Supplementary table 4. Included and excluded 4D flow CMR studies. Supplementary table 5. Intraventricular velocity and pressure profiles.
Additional file 2. Supplementary references
Additional file 3. Graphical abstract. Noninvasive flow visualization with multimodality imaging.
Data Availability Statement
The datasets used and/or analysed during the current study are available from the corresponding author on reasonable request.